


On September 6, 2019, the XLM price reached a low of 554 satoshis. An upward move was followed by a decrease. The price reached similar levels on September 14. It has been increasing since.

At the time of writing, XLM was trading at 570 satoshis.
Where will XLM go to next? Continue reading below to find out.
For our previous analysis, click here.
Stellar Price: Trends and Highlights for September 16
- XLM/BTC has made a double bottom pattern.
- A bullish divergence has developed in the RSI & MACD.
- There is resistance at 595 satoshis.
- XLM is trading inside a long-term descending channel.
Double Bottom
A closer look at the period discussed in the introduction shows that the Stellar price has created a double bottom at the 550 satoshi level.
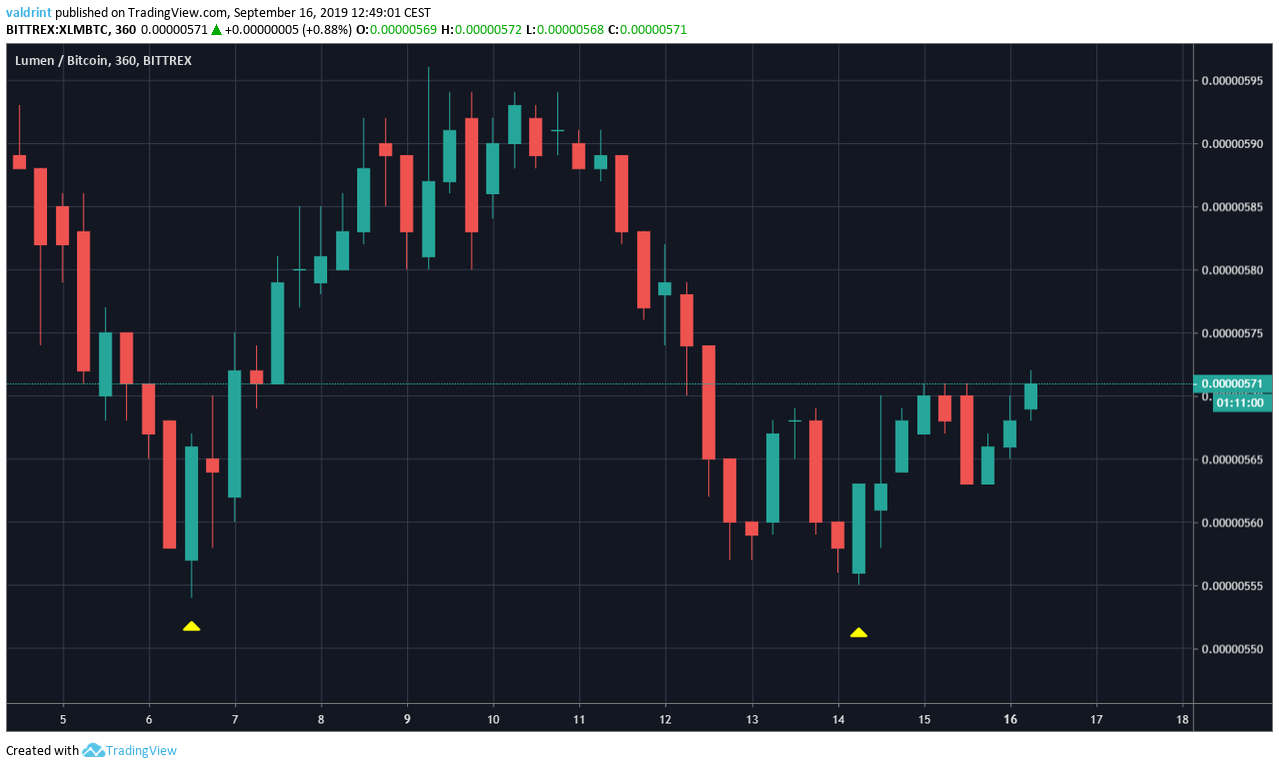
The double bottom is considered a bullish pattern, often indicating that a reversal is in store.
The possibility of a reversal is strengthened when we incorporate the RSI and the MACD into the analysis.
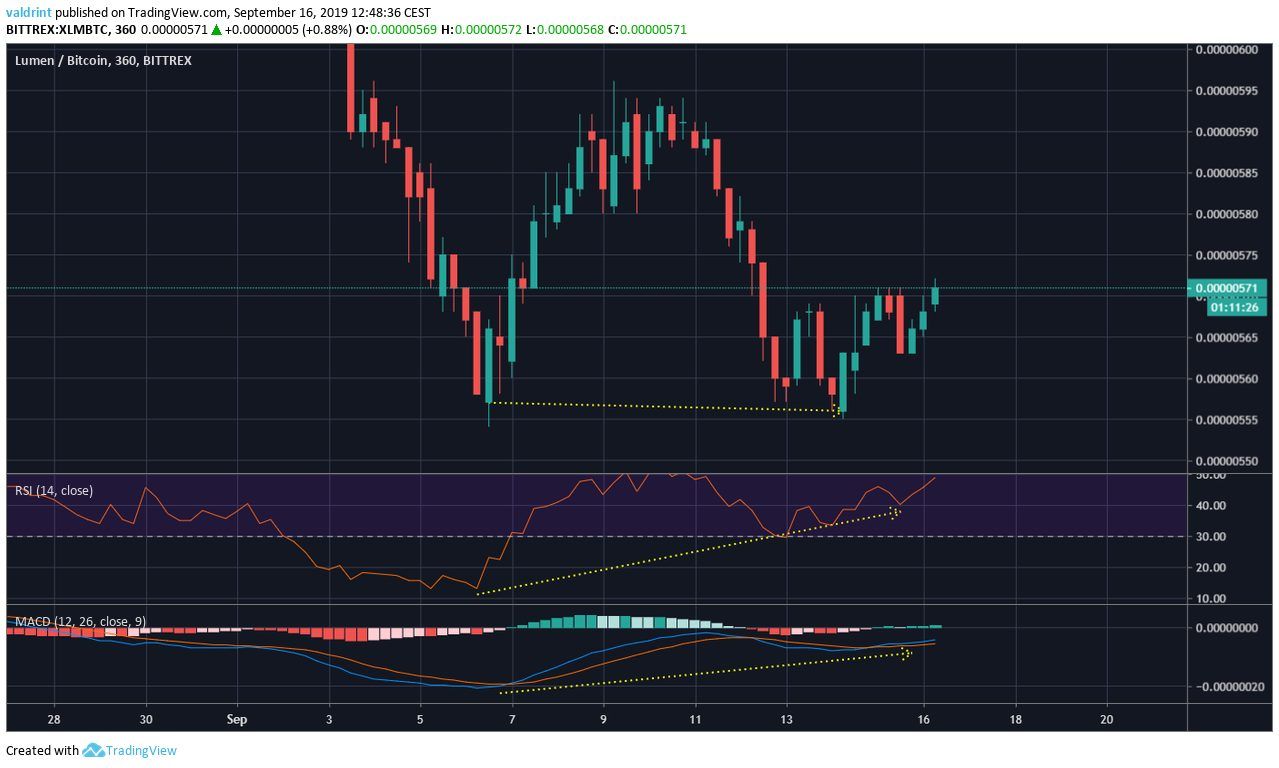
Both have been generating significant bullish divergence.
Additionally, the MACD is very close to moving into positive territory, after a previous rejection on September 11.
The reading from these two indicators combined with the creation of a bullish pattern makes it likely that XLM will begin an upward move.
How long will it increase?
Reversal Areas
A resistance area is below.
We can find it at 595 satoshis.
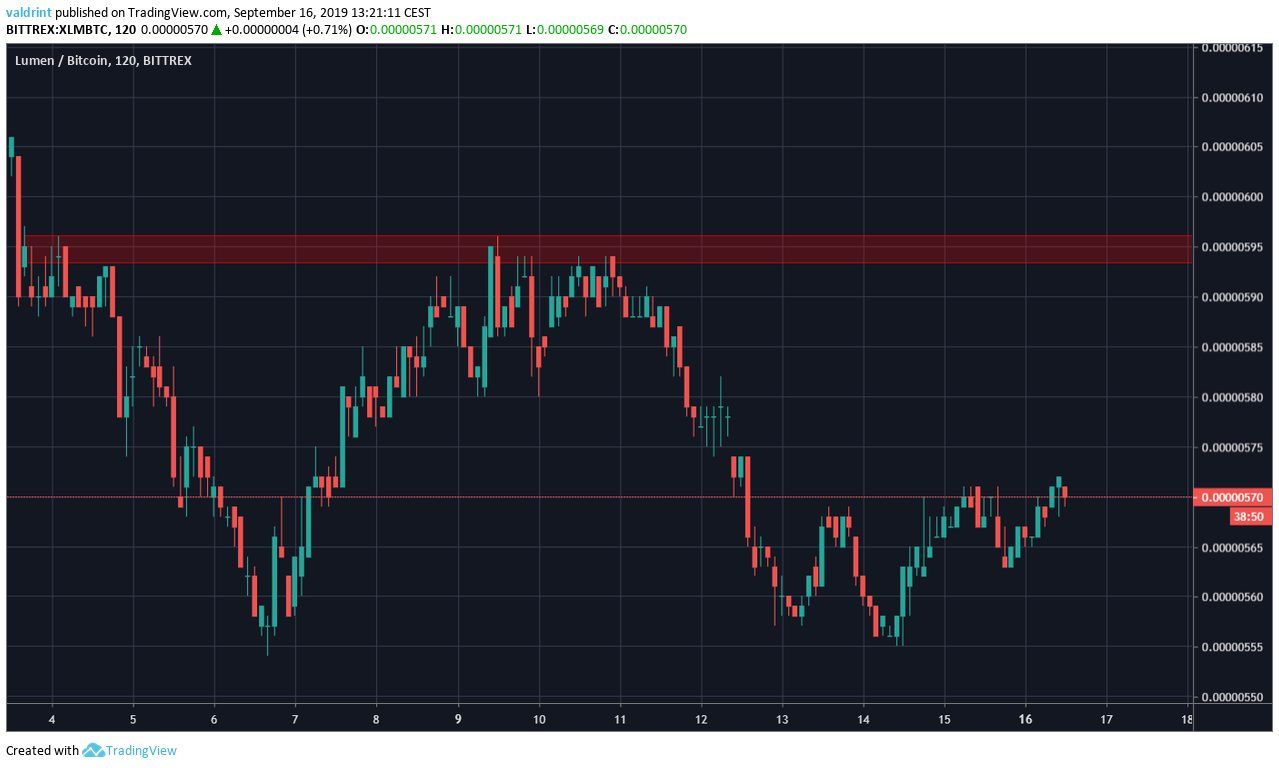
The price made an attempt at breaking out above it on September 9 and 11.
The attempt, however, was unsuccessful and the Stellar price began to decrease.
We believe the price will soon reach this area.
Long-Term Channel
Looking at the daily chart we can see that the Stellar price has been trading inside a descending channel since the beginning of July.
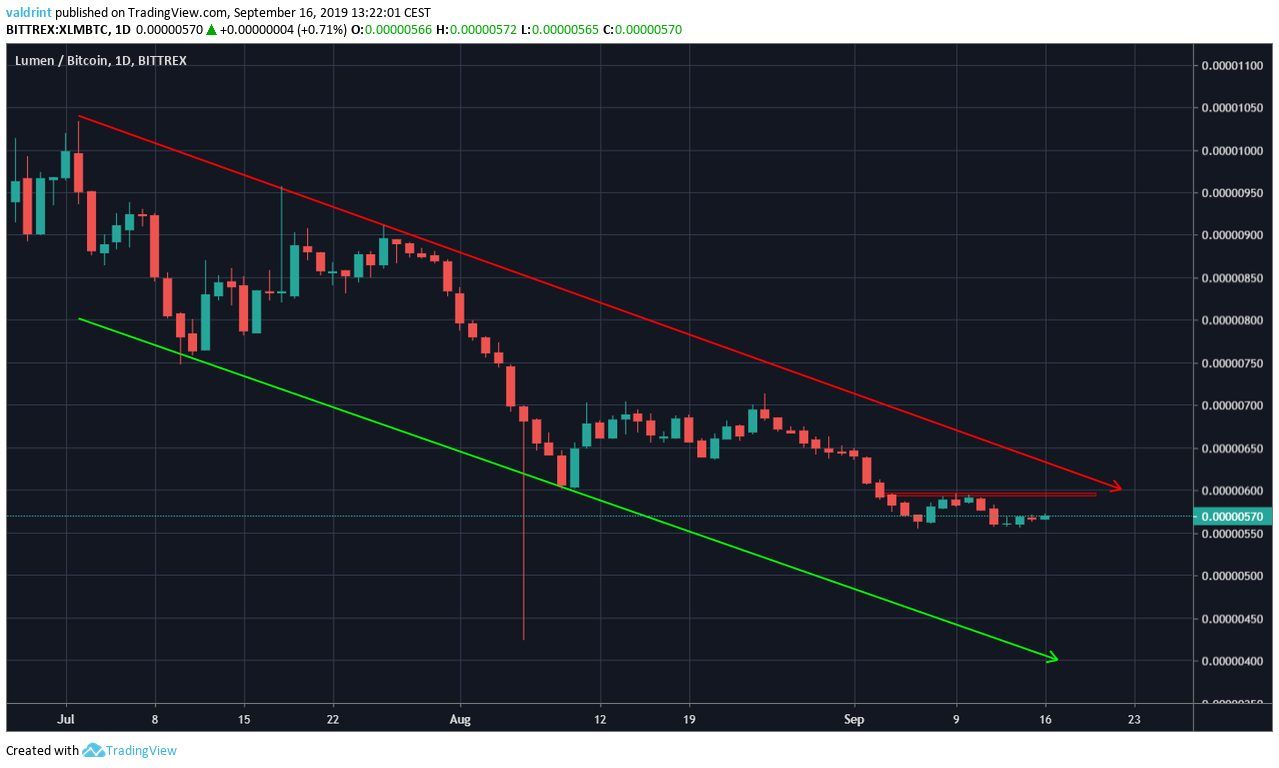
The resistance line is currently at 630 satoshis.
If the price moves above the resistance area previously discussed, we believe the rally will end at this descending resistance line.
Stellar Price Summary
The XLM price has recently made a double bottom pattern.
According to our analysis, it is likely to increase until it reaches the resistance area, and possibly higher.
For hypothetical trading purposes, we consider XLM a buy at the current level near 570 satoshis.
Do you think the Stellar price will reach the resistance area? Let us know in the comments below.
Disclaimer: This article is not trading advice and should not be construed as such. Always consult a trained financial professional before investing in cryptocurrencies, as the market is particularly volatile.
Images are courtesy of Shutterstock, TradingView.


