


After Bitcoin surged to over $8000, many other cryptocurrencies have similarly spiked. For example, both XRP and Stellar lumens (XLM) have both initiated rapid upward moves recently.
Will XLM and XRP be able to sustain these gains and rise to higher highs?
In this article, we answer this question by examining the current long-term and short-term trading patterns of Stellar lumens (XLM) and Ripple’s XRP (XRP).
Then, we compare the technical indicators in order to generate possible trade setups for both. Lastly, the major findings of our analysis are summarized in the conclusion. There the winner of this analysis is selected based on future price potential.
You can read our previous analysis of XLM and XRP here.
Rapid Upward Moves
The price of XLM reached a low of $0.110 on Apr 11. Over the next week, the price increased by 10%. By Apr 18, a high of $0.121 was reached.
A downward move followed and XLM/USD has since been trading inside the descending channel outlined below:
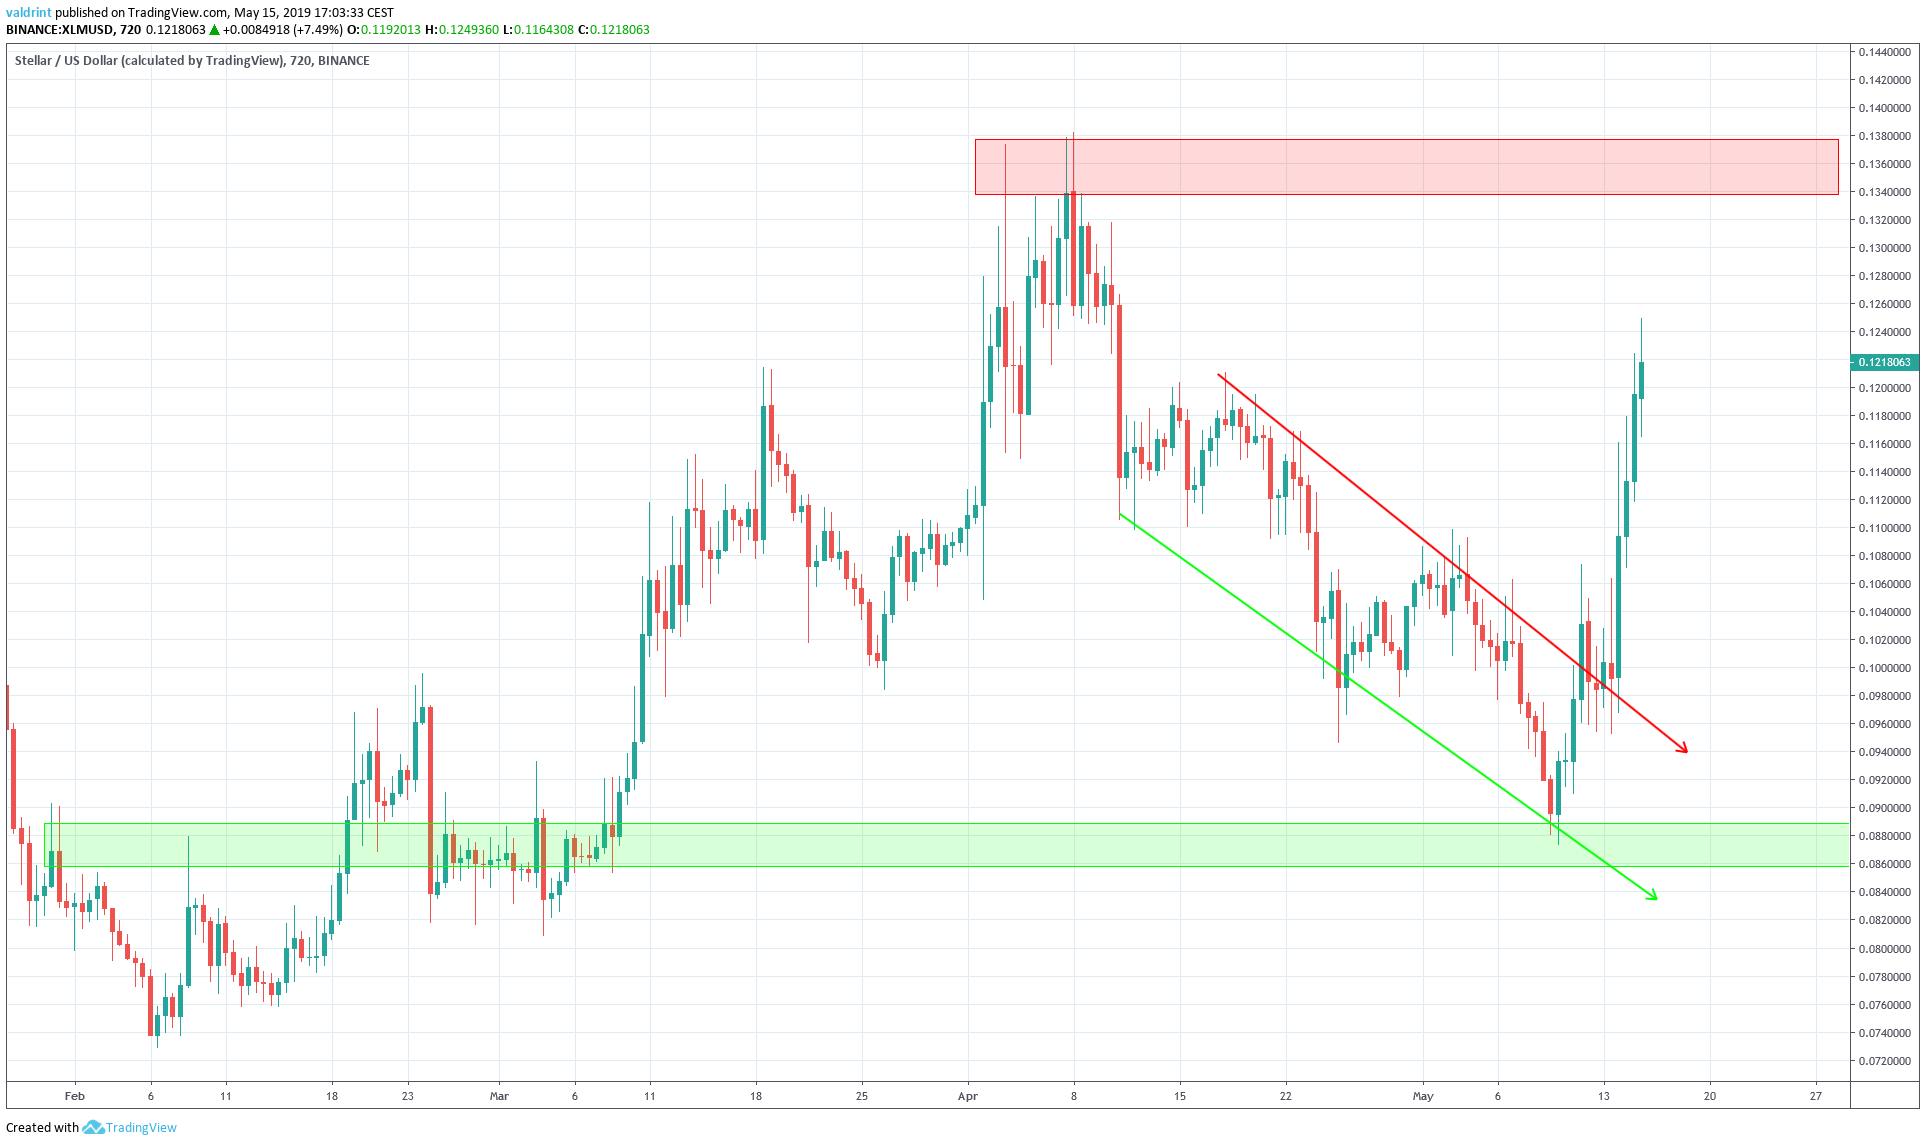
After validating the support line on May 8, the price rose increased to validate the resistance line on May 11. A breakout from the trading pattern followed shortly thereafter.
Over the next few days, the price continued rising and has yet to generate a new trading pattern. It appears to be currently moving toward the major resistance area near $0.136.
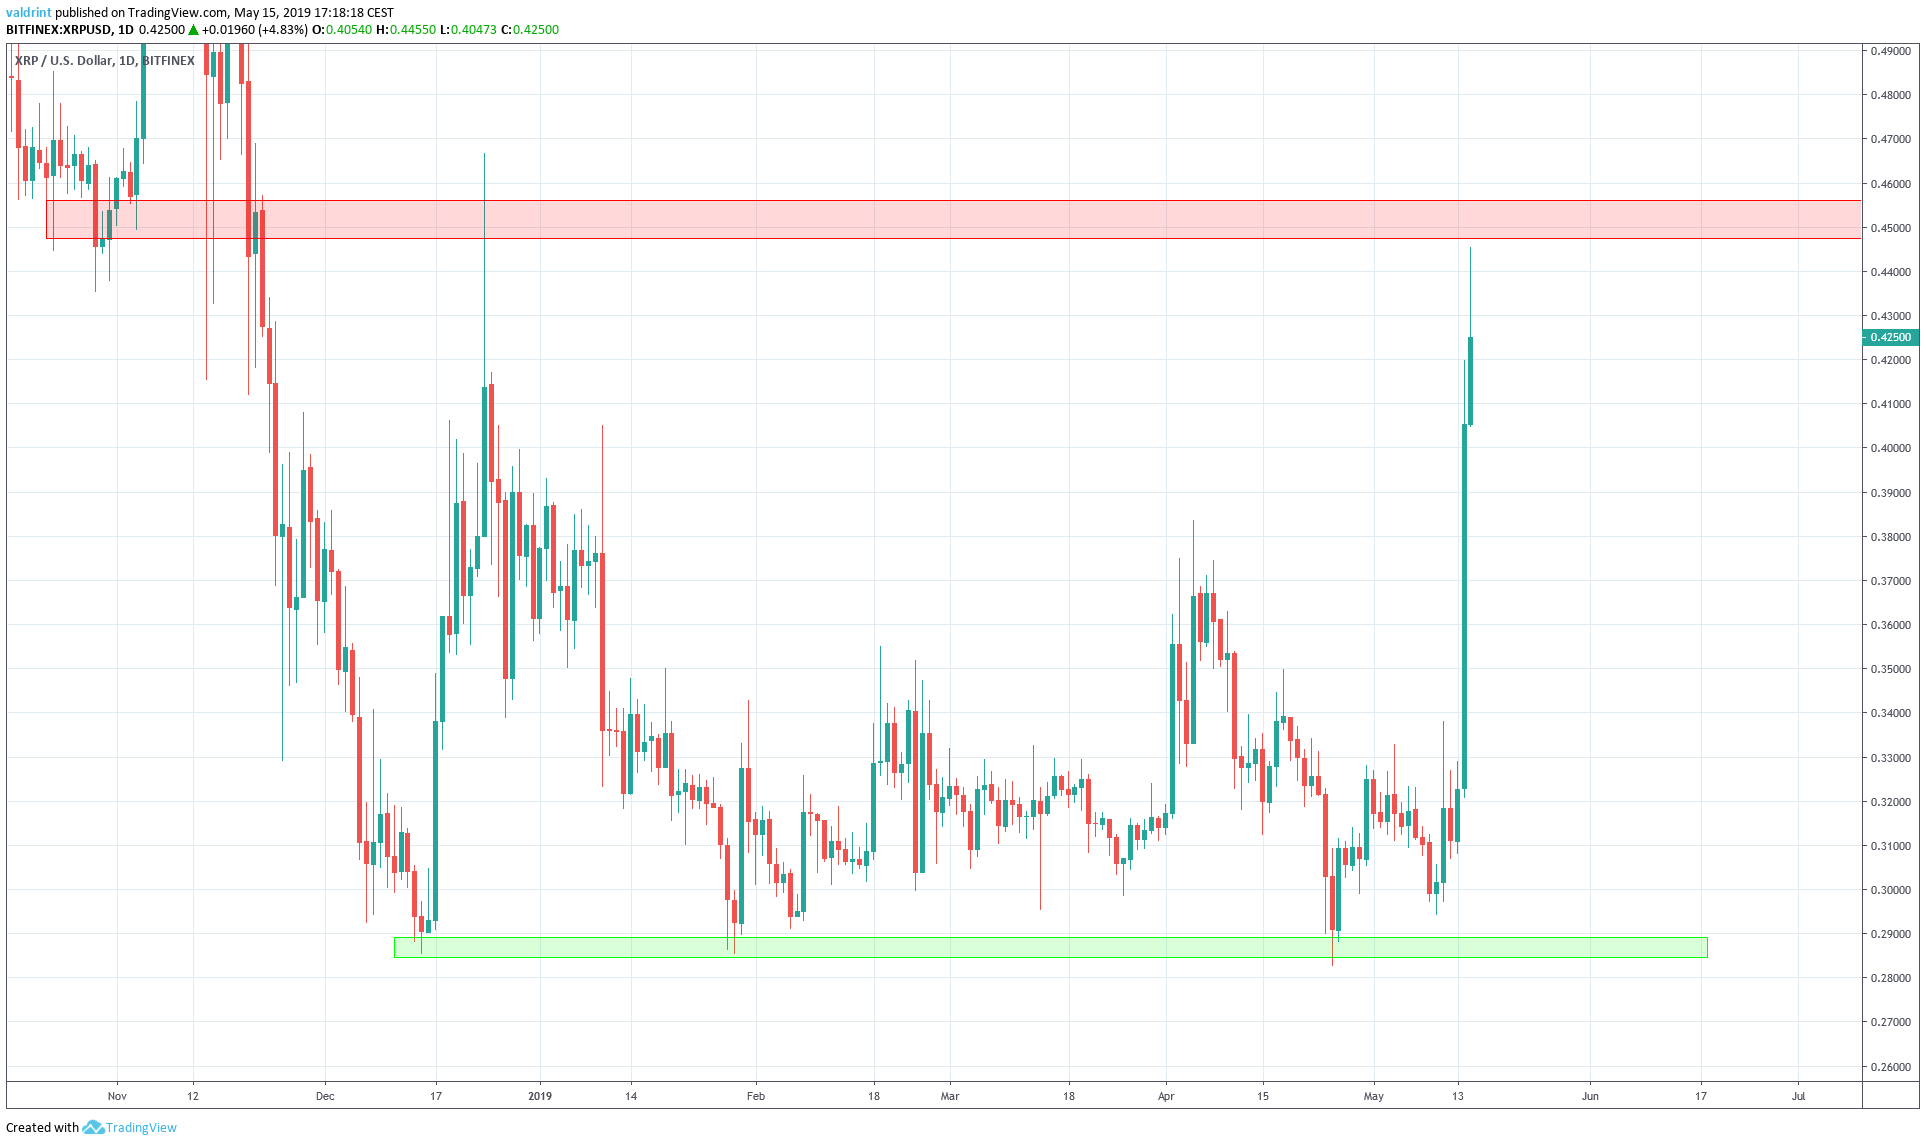
Similarly, the price of XRP/USD dropped to the major support area near $0.3 on Apr 25. A gradual upward move began. It intensified on May 14 and is nearing the major resistance area near $0.45.
Unlike XLM, however, XRP has not been following a clear trading pattern. The support and resistance area defined above are traced in the graph below:
These patterns, however, are not sufficient in predicting future price movements. In order to do that, we need to take a look at both coins in a shorter time-frame alongside technical indicators.
Lumens Inside an Ascending Wedge
On May 12, the price of XLM reached a high of $0.104. A gradual decrease ensued and the price reached a low of $0.097 on May 14.
The price of XLM/USD has been increasing since, trading inside the ascending wedge outlined below:
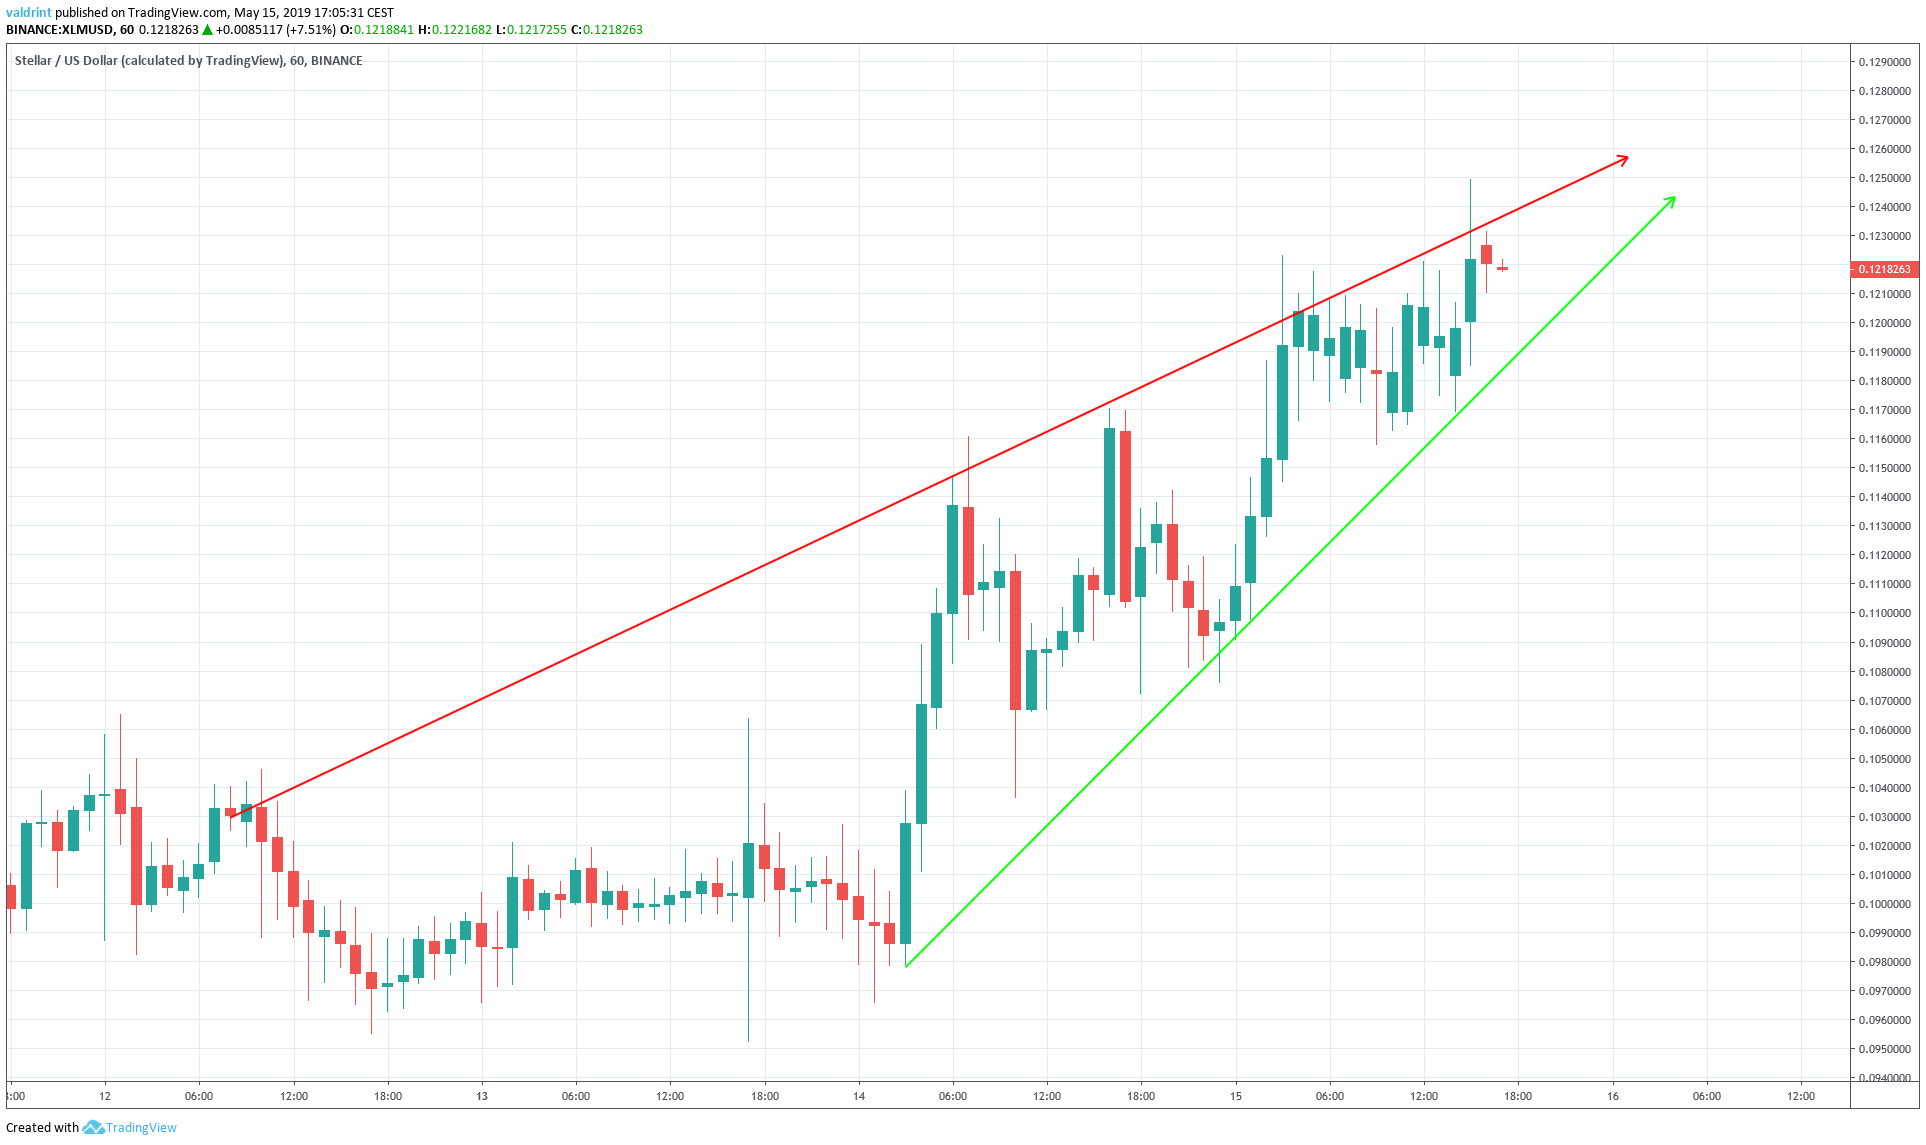
Currently, the price is trading very close to the resistance line of the wedge and appears poised for a breakout.
In order to determine whether the price will break out or decrease towards the support line, we have outlined the price alongside the RSI and the MACD below:
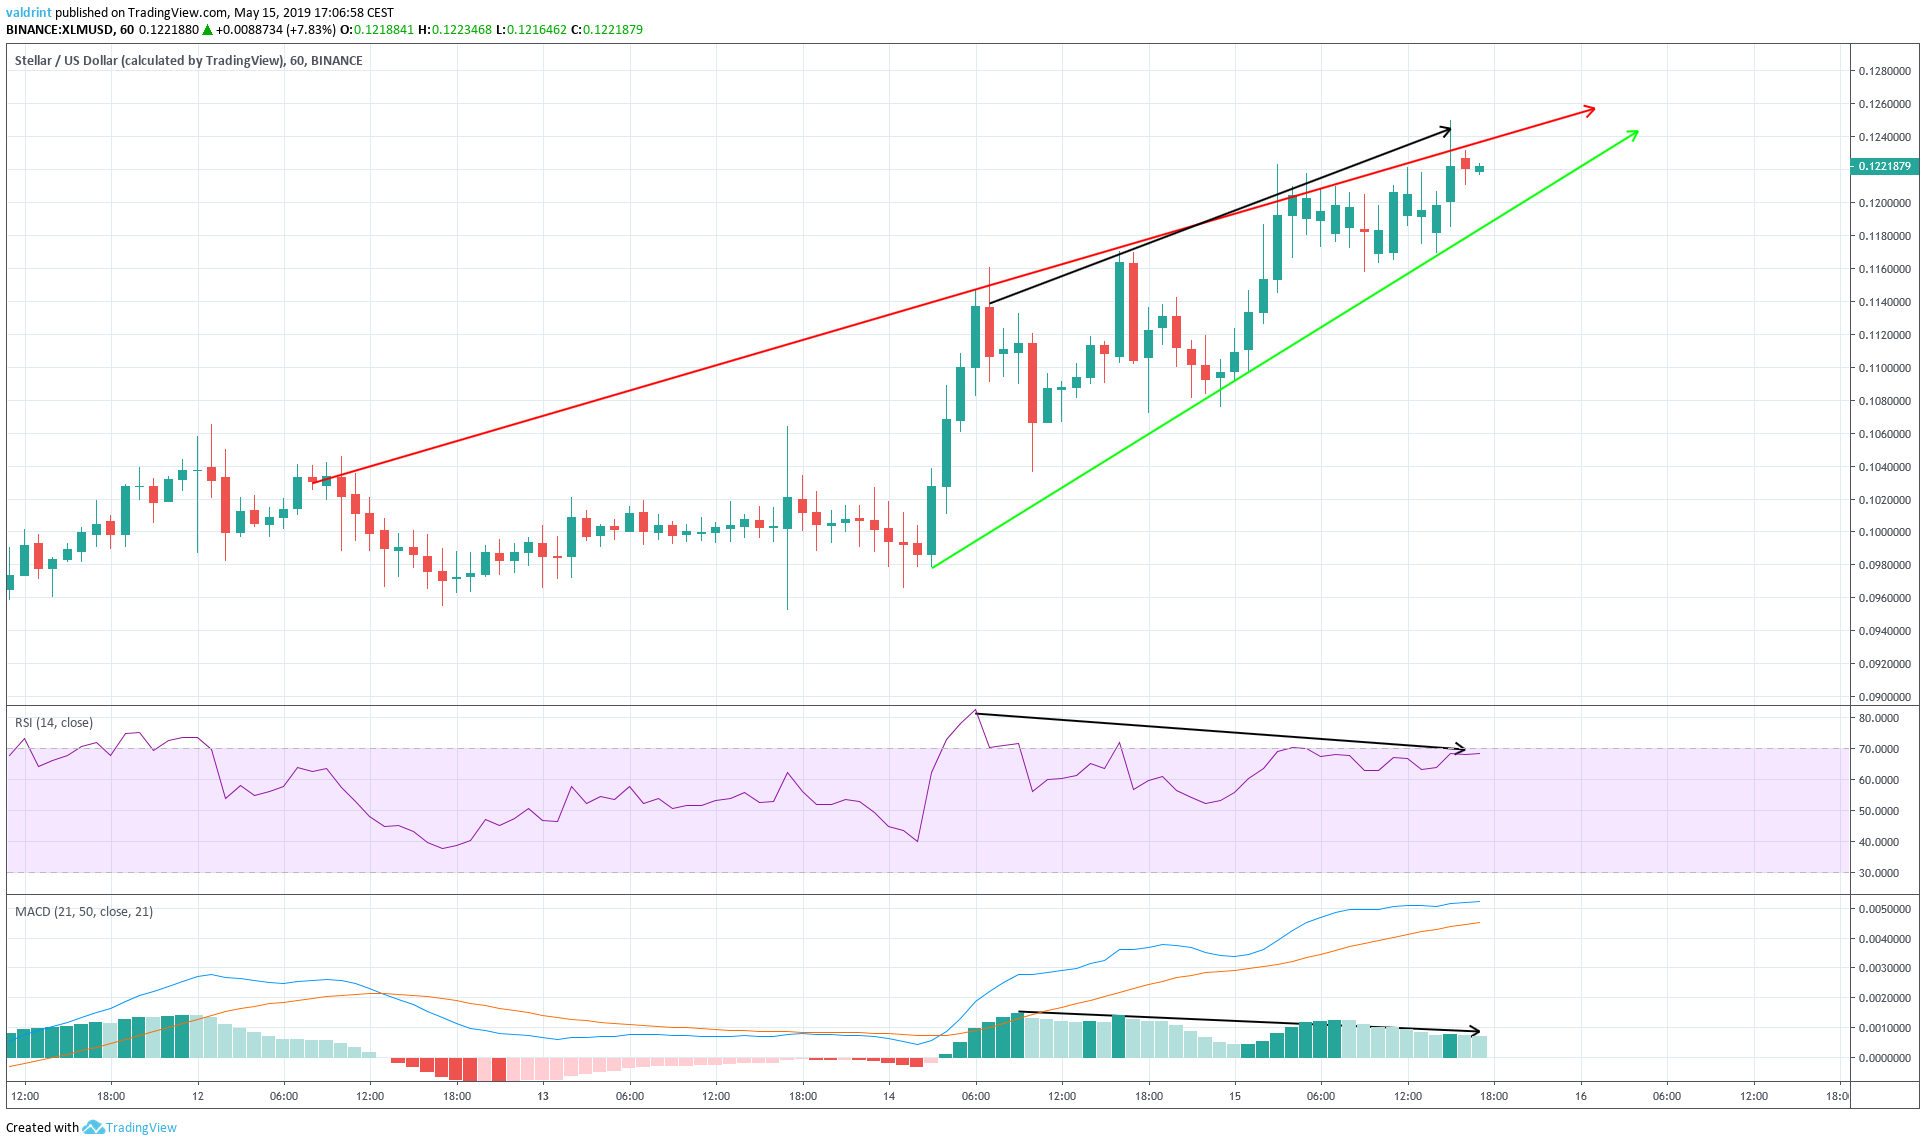
On May 14, the price reached a high of $0.114. It continued to increase and on May 15 it reached a higher high of $0.124.
Similarly, the RSI and the MACD reached a high on May 14. However, they have proceeded to generate lower values since.
This is known as bearish divergence and often precedes price decreases.
The use of these indicators makes it likely that the price will decrease until it reaches the support line. Since the ascending wedge is a bearish pattern, a breakdown is likely.
Since the price is trading close to the resistance line of the channel, we are going to analyze a possible short trade setup.
Our previous setup was unsuccessful and our stop loss of 5% was triggered.
Short Trade Setup
We are going to analyze a possible trade setup with an average entry of $0.123.
The stop-loss order will be placed at $0.127, slightly above the daily high on May 15. This is a stop loss of only 2.5%. It can be moved slightly higher based on risk tolerance and the size of the trade.
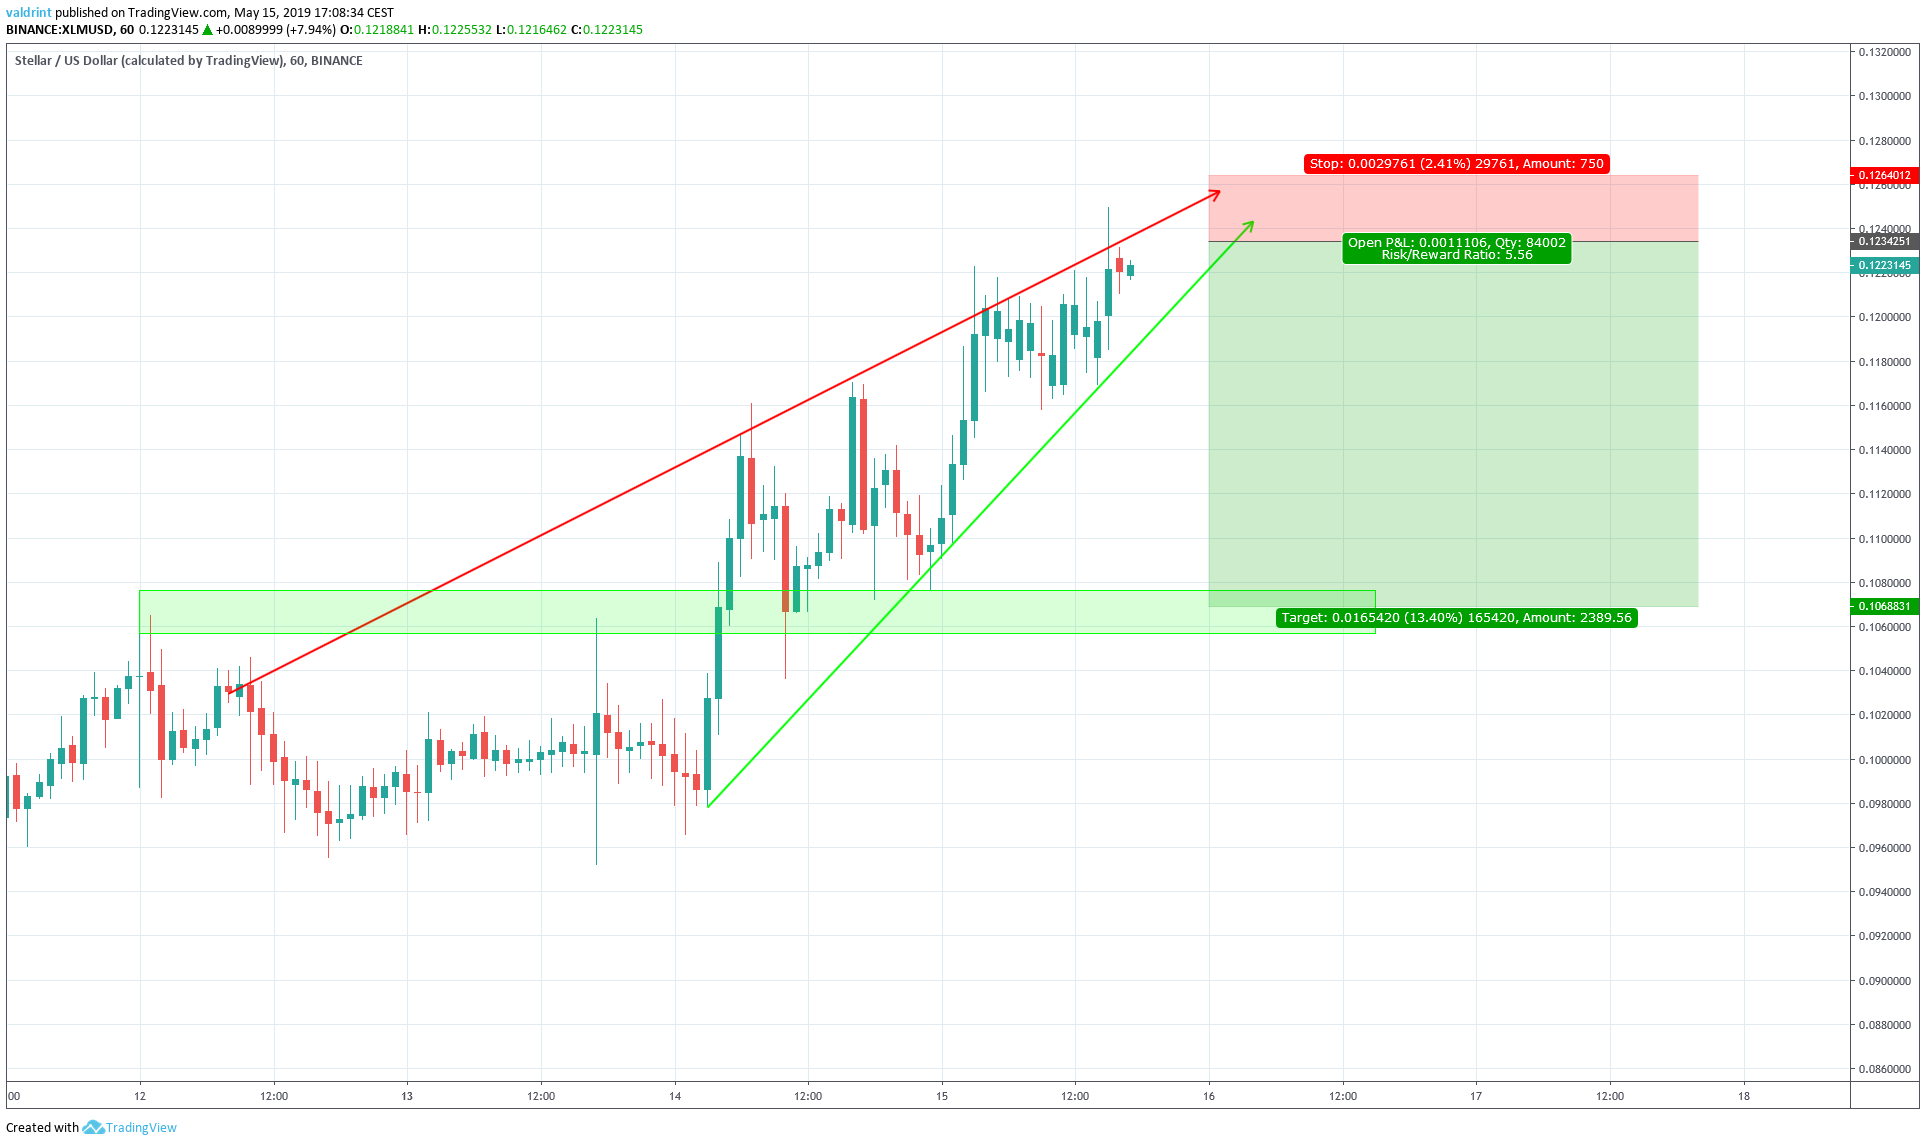
Our target is now set at $0.105. The support area is formed by the lows of May 14. A breakdown from the wedge is required for the price to reach this area. Based on the analysis of the indicators, this is likely.
Combined with our stop loss, the target would present a 5.5:1 risk to reward ratio.
Now, let’s take a look at XRP.
XRP’s Ascending Channel
The price of XRP reached highs of $0.399 on May 14. It decreased to reach a low of $0.366 the same day. It has been increasing since, trading inside the ascending channel outlined below:
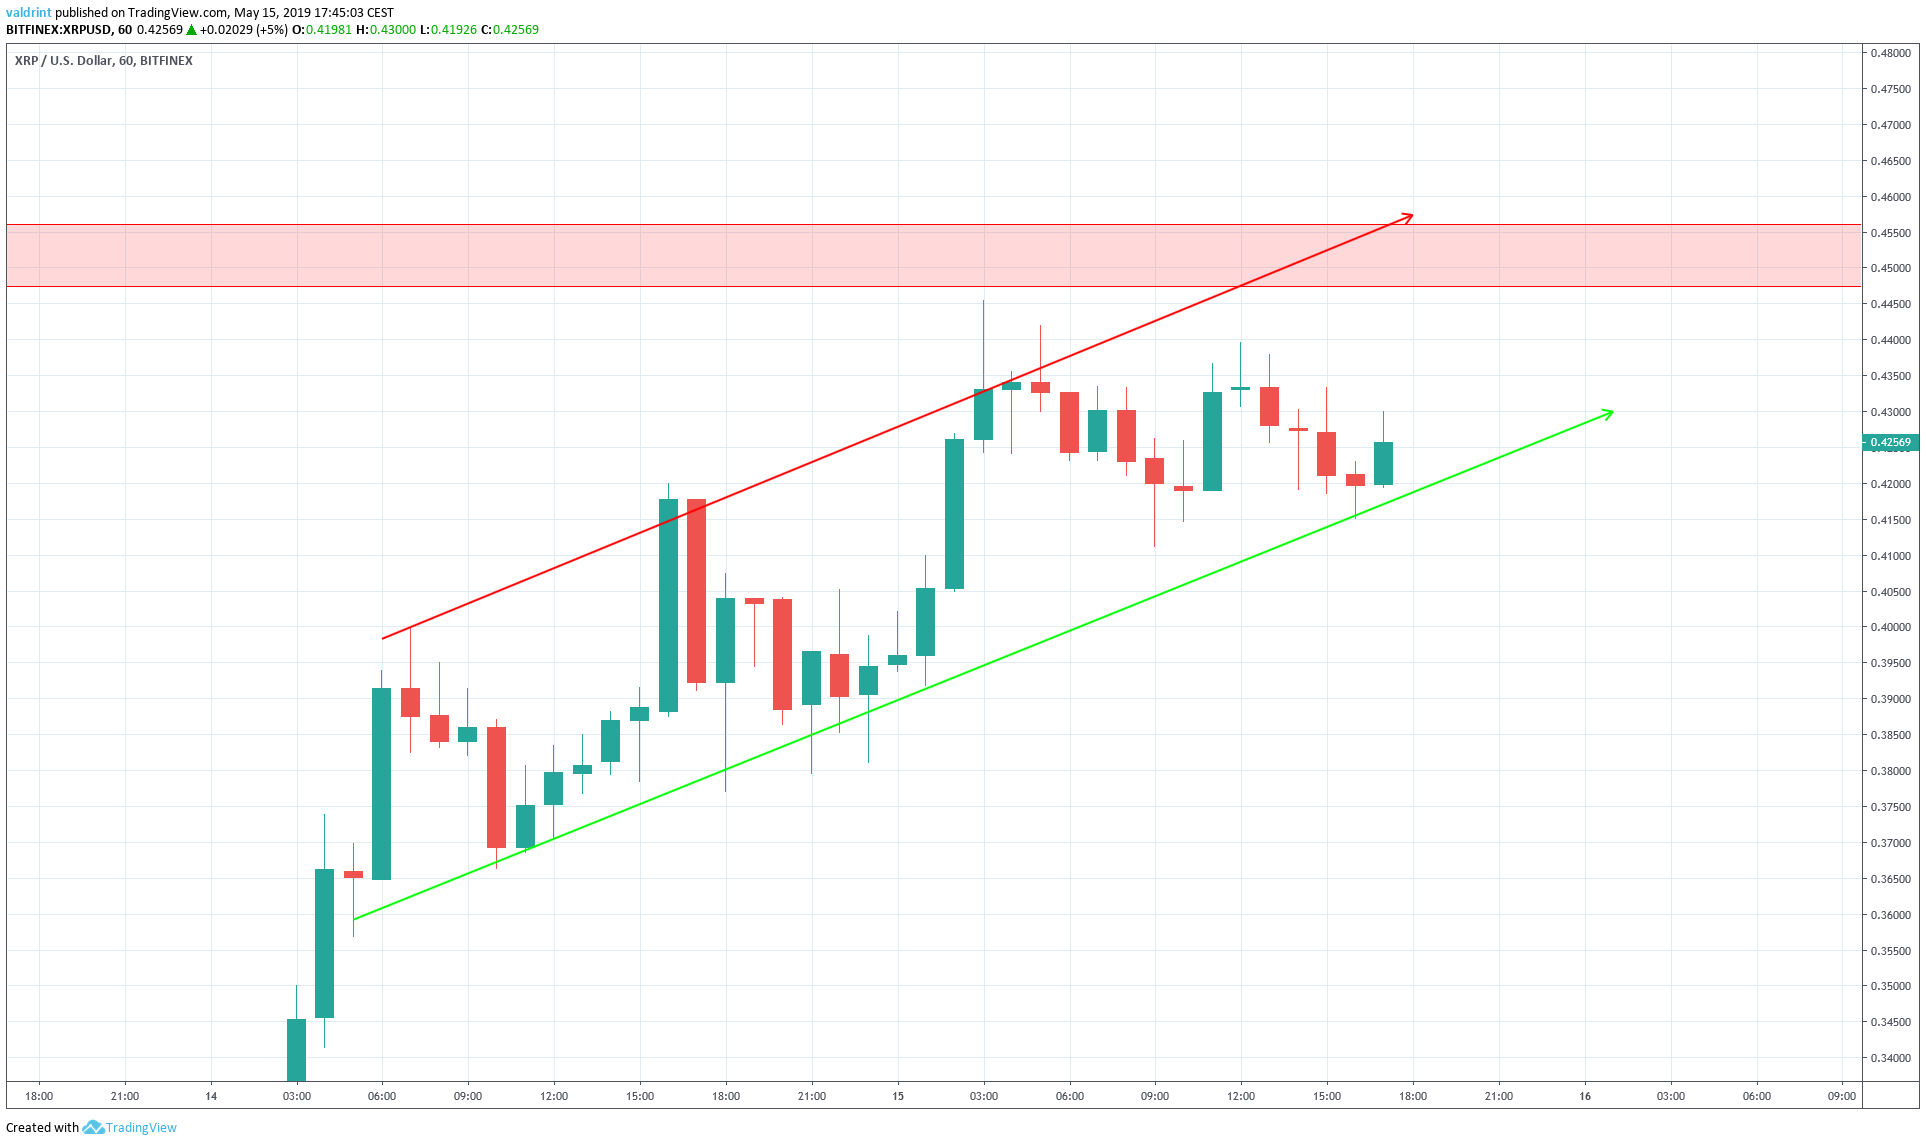
The price is currently trading on the support line of the channel.
In order to determine whether a breakdown is possible, we have outlined the price of XRP at two-hour intervals alongside volume.
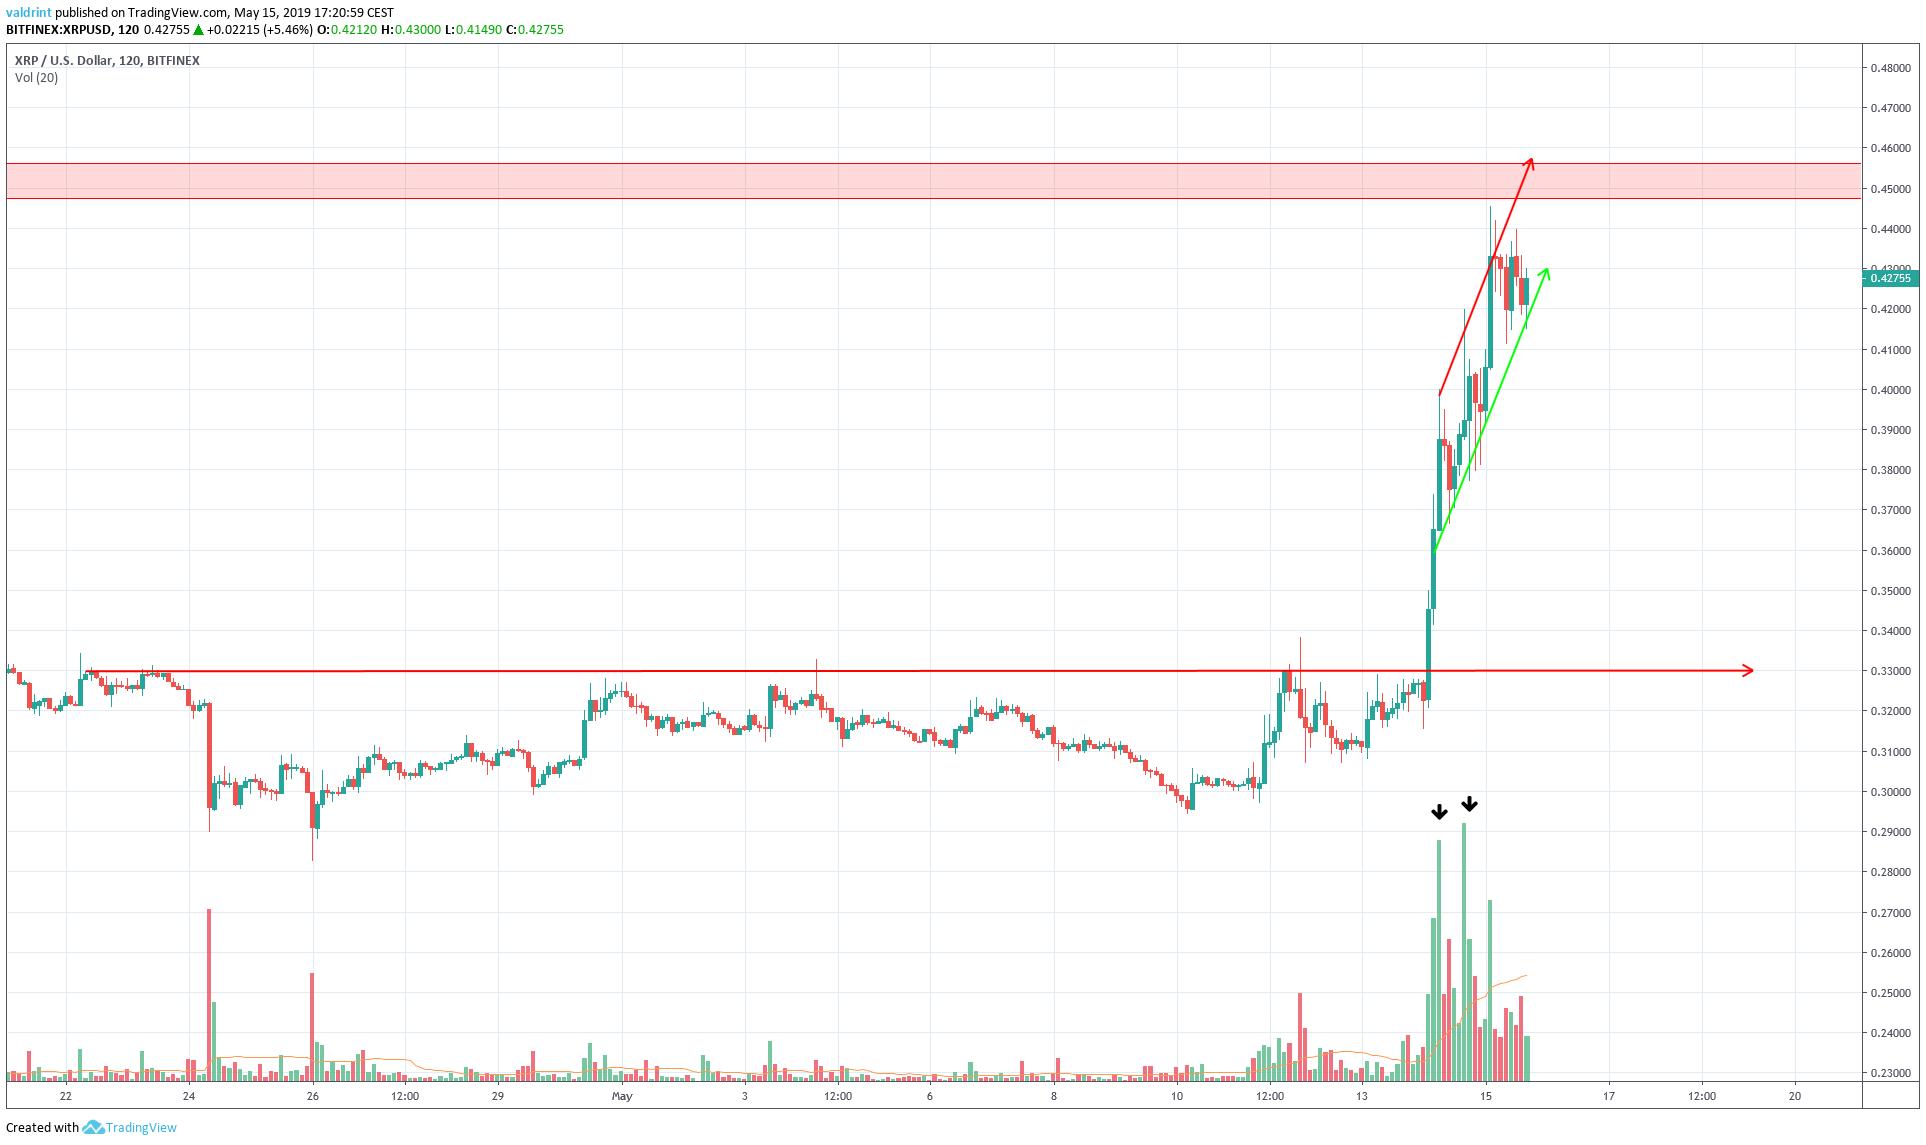
Since Apr 22, the price has been following a resistance line at $0.33. The price broke out above this line on May 14.
We can see that the breakout occurred with immense volume. This indicates that buyers have a lot of strength. Therefore, we believe that the price will not immediately break down from the channel. Rather, it is likely to increase and reach the resistance area at $0.45.
Due to the price position inside its pattern, we do not see a profitable trade setup.
A long trade towards the resistance area was considered, but it gave us a risk-to-reward ratio below 2. Therefore, we believe the prudent move is to wait until the price reaches the resistance area. A short trade setup may then be possible.
Conclusion
To conclude, both XLM and XRP began rapid upward moves over the last few days; however, both coins are close to reaching a major resistance area.
In the short-term, XLM is trading inside an ascending wedge and has developed significant bearish divergence. On the other hand, XRP is trading inside an ascending channel. Furthermore, XRP’s previous breakout occurred with enormous volume. This leads us to believe that the upward move has strength.
To conclude, we believe that XRP has higher growth potential than XLM.
However, due to its position within the trading pattern, we have identified a possible short trade setup for XLM with a risk to reward ratio of 5.5:1 while a profitable trade setup for XRP does not appear present.
A summary of our findings is presented in the table below:
XRP
XLM
WINNER
Long-term Pattern
Rapid upward move
Rapid breakout from a descending channel
Tie
Short-Term Patterns & Indicators
Bullish cross inside a horizontal channel
Bearish divergence inside an ascending wedge
XRP
Do you think the price of Stellar lumens will break down from the wedge? How much longer will XRP increase?
Disclaimer: This article is not trading advice and should not be construed as such. Always consult a trained financial professional before investing in cryptocurrencies, as the market is particularly volatile.


