


XRP and Stellar lumens are performing very differently recently. From their current trading pattern to the technical indicators, very little similarities can be found. Which is best poised for a profitable trade setup?
In this article, we answer this question by examining the current long-term and short-term trading patterns of Stellar lumens (XLM) and Ripple’s XRP (XRP). Then, we compare the technical indicators in order to generate possible trade setups for both. Lastly, the major findings of our analysis are summarized in the conclusion where the winner of this analysis is selected based on future price potential.
You can watch our latest video analysis for Stellar lumens below:
Two Ascending Support Lines and One Trading Pattern
The price reached a low of $0.072 on Feb 6. A gradual increase began and the price reached a high of $0.139 on Apr 10. XLM/USD has been following an ascending support line since.
After a gradual decrease, the price broke down from the ascending support line on Apr 24. Price bounced above and below the line for several says until May 3 when the price dropped toward the support area traced below:
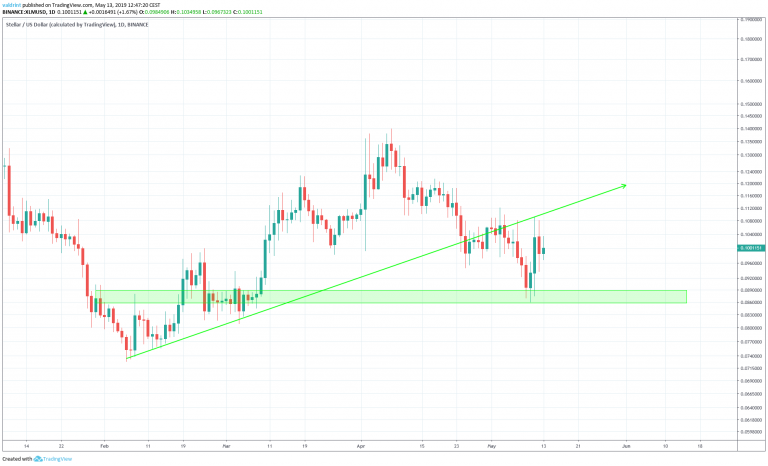
On May 10, the price reached the support area at $0.087, before beginning an upward move.
Similarly, the price of XRP/USD had been following an ascending support line beginning in early December 2018. Shortly thereafter, the price reached a high of $0.46 on Dec 24, 2018 and began trading along a descending resistance line.
The resistance and support lines combine to generate the symmetrical triangle outlined below:
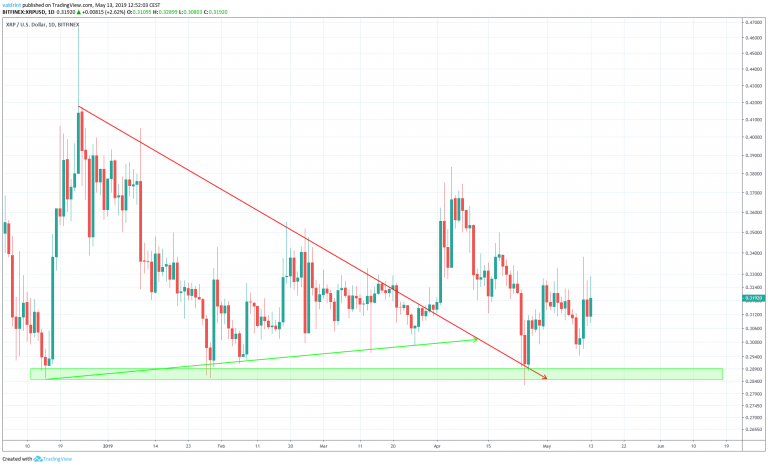
The price broke out of this triangle on Apr 2. It reached highs of $0.38 on Apr 5. Price subsequently feel and reached the resistance line on Apr 25.
We can also see that the price has created a support area near $0.285. Wicklows reached this area in late April. The price subsequently rose before a slight drop. It did not fall far enough to reach the support area a second time. Furthermore, after the drop, there was an almost immediate recovery.
These patterns, however, are not sufficient in predicting future price movements. In order to do that, we will continue to take a look at both coins in a shorter time-frame alongside technical indicators.
Lumens in a Descending Channel
On Apr 11 the price of lumens reached a low of $0.11. A gradual increase was followed by a gradual decrease.
As seen in the graph below, XLM/USD has been trading inside a descending channel since:
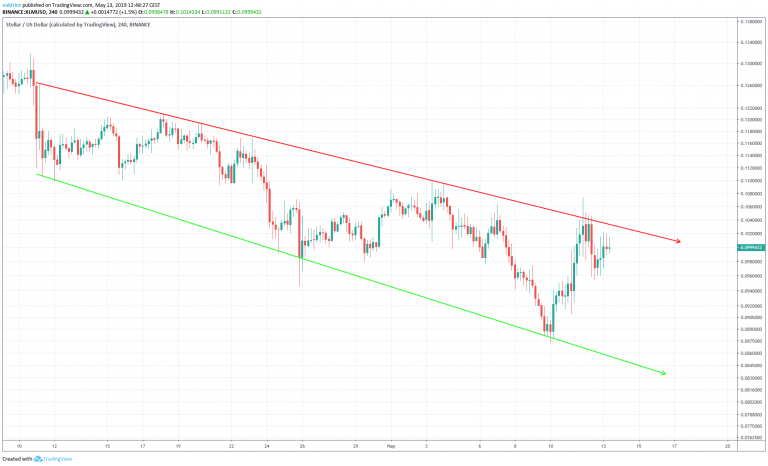
Currently, the price is trading very close to the resistance line of the channel, which has been validated six times.
In order to determine whether the price will break out or decrease towards the support line, we have outlined the price alongside the 100- and 200-period moving averages (MAs) and the RSI below:
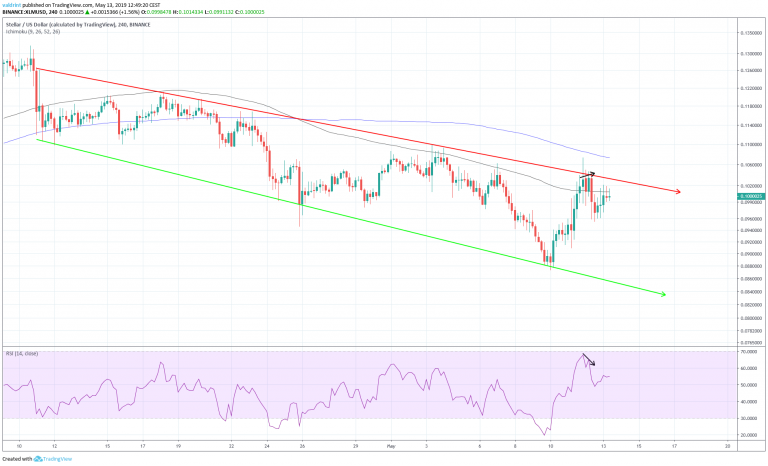
On May 11, the price reached a high of $0.103. It reached the same high the next day. Similarly, the RSI reached a high on May 11. However, it has proceeded to generate lower values since.
This is known as bearish divergence and often precedes price decreases.
Furthermore, the price is trading below the 100- and 200-period moving averages. It also facing very close resistance from the former.
The use of these indicators makes it likely that the price will decrease until it reaches the support line.
Short Trade Setup
We are going to analyze a possible trade setup with an average entry of $0.100.
The stop-loss order is placed at $0.107, slightly above the highs reached on May 12. This is a stop loss of roughly 5%.
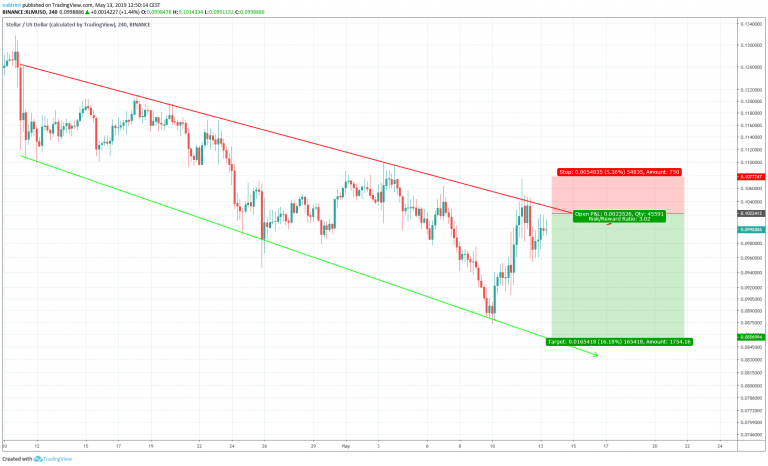
Our target would be set at $0.085. This coincides with the support line of the channel. Price could decrease to reach this area without the need for a breakdown.
Combined with our stop loss, the target would present a 3:1 risk to reward ratio.
Now, let’s take a look at XRP.
XRP’s Horizontal Channel
The price of XRP reached highs of $0.333 on Apr 22. A rapid decrease brought it to a low of $0.282 on Apr 26. Since then, it has been trading inside the horizontal channel outlined below:
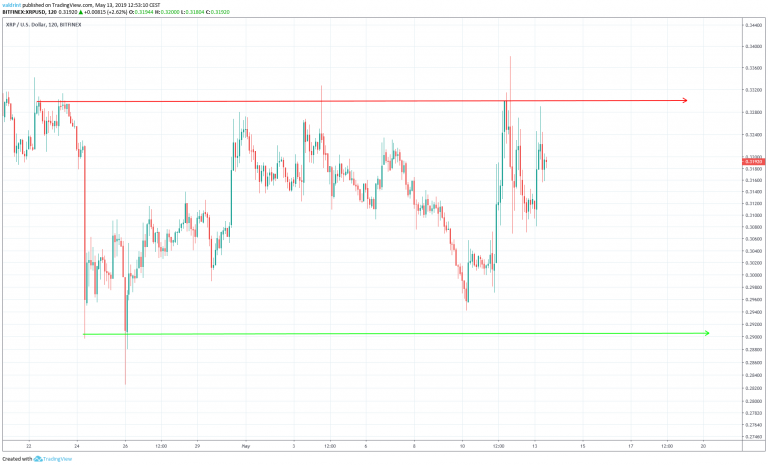
The resistance and support lines of the channel are at $0.33 and $0.29 respectively.
At the time of writing, the price was trading very close to the resistance line of the channel.
In order to determine whether a breakout is possible, we have outlined the price of XRP alongside the 100- and 200-period moving averages (MA) below:
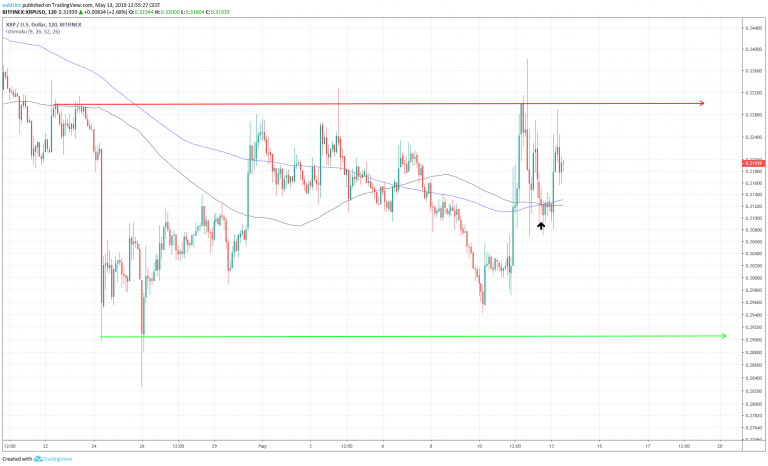
On May 12, the 100-period MA crossed above the 200-period one. This is known as a bullish cross and often indicates that an uptrend has begun. Furthermore, the price is trading above both the moving averages.
The use of these indicators makes suggests that a breakout from the channel is likely.
Combined with the fact that the price is trading very close to the resistance line of the channel, we do not see any profitable trade setups.
Our previous short trade was unsuccessful and our stop loss of 4% was triggered.
It does not appear as if a trade setup with an acceptable risk to reward ratio exists.
Conclusion
To conclude, both XLM and XRP were following ascending support lines in the long-term. However, XLM broke down from its support line and came back to validate it as resistance. To the contrary, XRP broke out and came back to validate the line as support.
In the short-term, XLM is trading inside a descending channel, while XRP is trading inside a horizontal one. Furthermore, the indicators for XLM support further decreases while the contrary is true for XRP.
However, due to its position within the trading pattern, we have identified a possible short trade setup for XLM with a risk to reward ratio of 3:1 while a profitable trade setup for XRP does not appear present.
A summary of our findings is presented in the table below:
XRP
XLM
WINNER
Long-term Pattern
Breakout from a symmetrical triangle.
Breakdown from an ascending support line
XRP
Short-Term Patterns & Indicators
Bullish cross inside a horizontal channel
Bearish divergence inside a descending channel
XRP
Do you think the price of Stellar lumens will reach the resistance line of the channel? Can XRP defy the odds and break free of its downward trend?
Disclaimer: This article is not trading advice and should not be construed as such. Always consult a trained financial professional before investing in cryptocurrencies, as the market is particularly volatile.


