


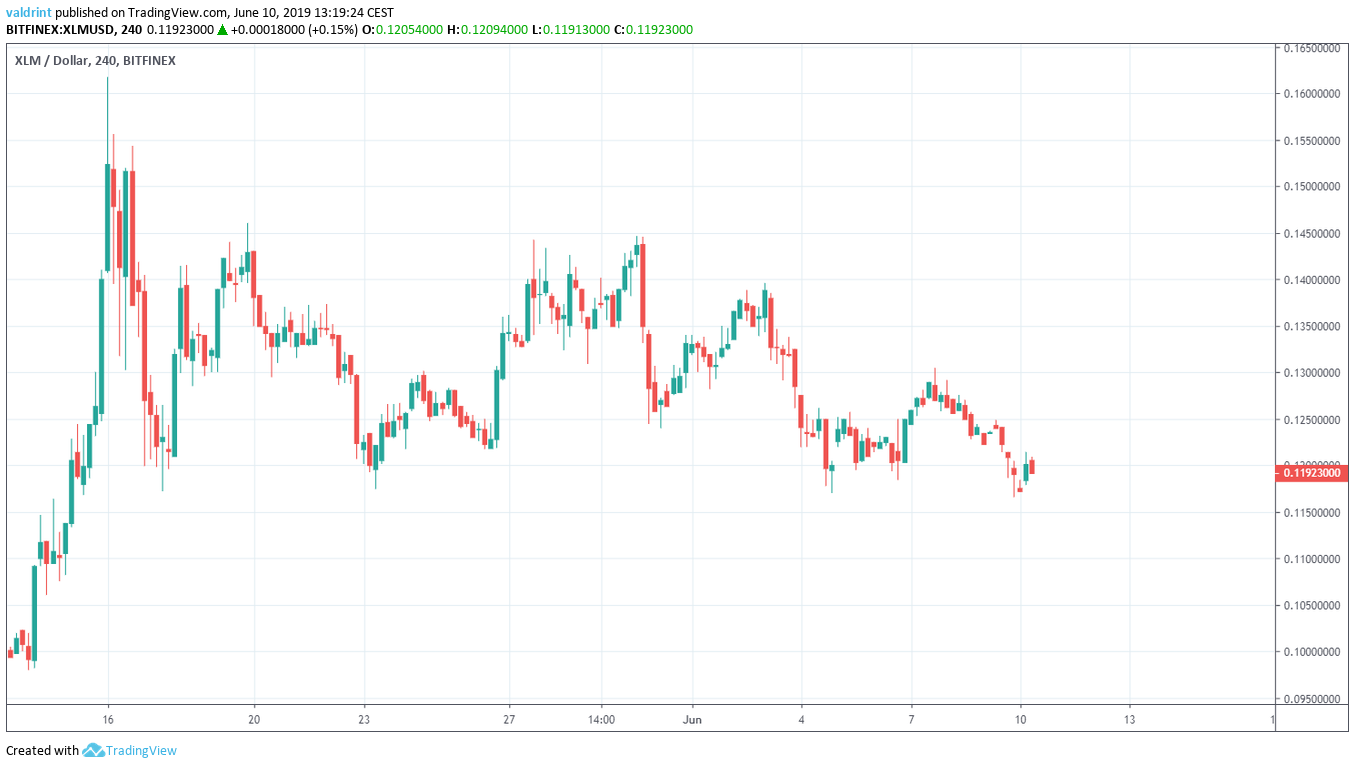
On May 16, the Stellar Lumens price (XLM) reached a high of $0.161. A rapid decrease ensued and the price reached a low of $0.117 the next day. Since then, several weak upward moves have been initiated. However, the price returned to the $0.11 level three other times.
Where will the price go next? Keep scrolling below to find out.
For a video analysis on XLM, clink the video below:
Stellar Lumens Price (XLM): Trends and Highlights for June 10, 2019
- XLM/USD reached a high on May 16.
- It is trading inside a descending triangle.
- There is short-term bullish divergence in the RSI.
- There is long-term bearish divergence in the RSI.
- The 10- and 20-day MAs have made a bearish cross.
- There is resistance near $0.145 and support near $0.10.
XLM in a Descending Triangle
On May 16, XLM/USD reached a high of $0.161. A rapid decrease followed. The next day, the Stellar Lumens price (XLM) reached a low of $0.117.
Since then, it has been trading inside the descending triangle outlined below:
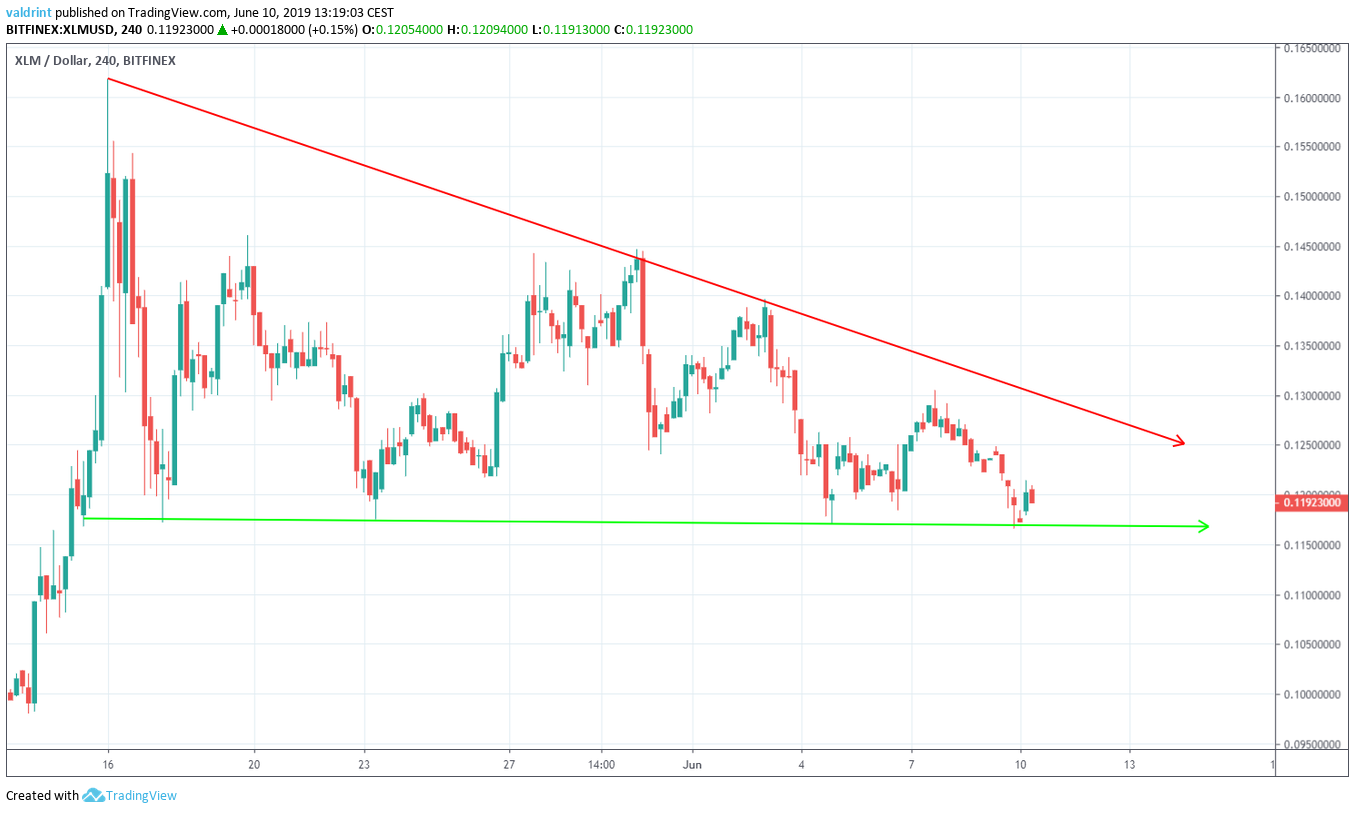
At the time of writing, the Stellar Lumens price (XLM) was trading very close to the support line of the triangle.
Will it break down? Let’s look at technical indicators and try to answer this question.
Possible Breakdown?
The Stellar Lumens price (XLM) is analyzed alongside the RSI below:
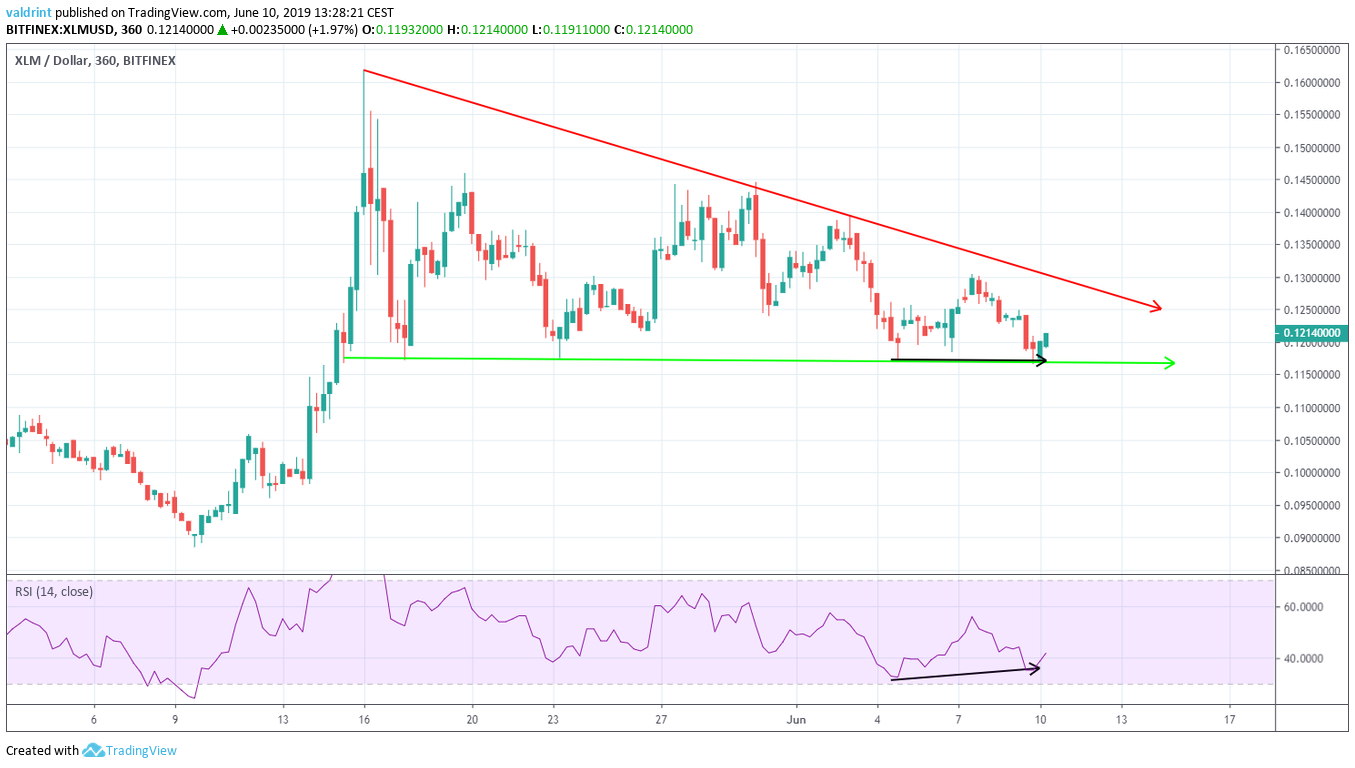
However, the divergence is not very significant. Furthermore, it is occurring inside a bearish pattern.
Therefore, we will analyze the Stellar Lumens price (XLM) at daily intervals alongside the 10-, 20-day moving averages and the RSI below:
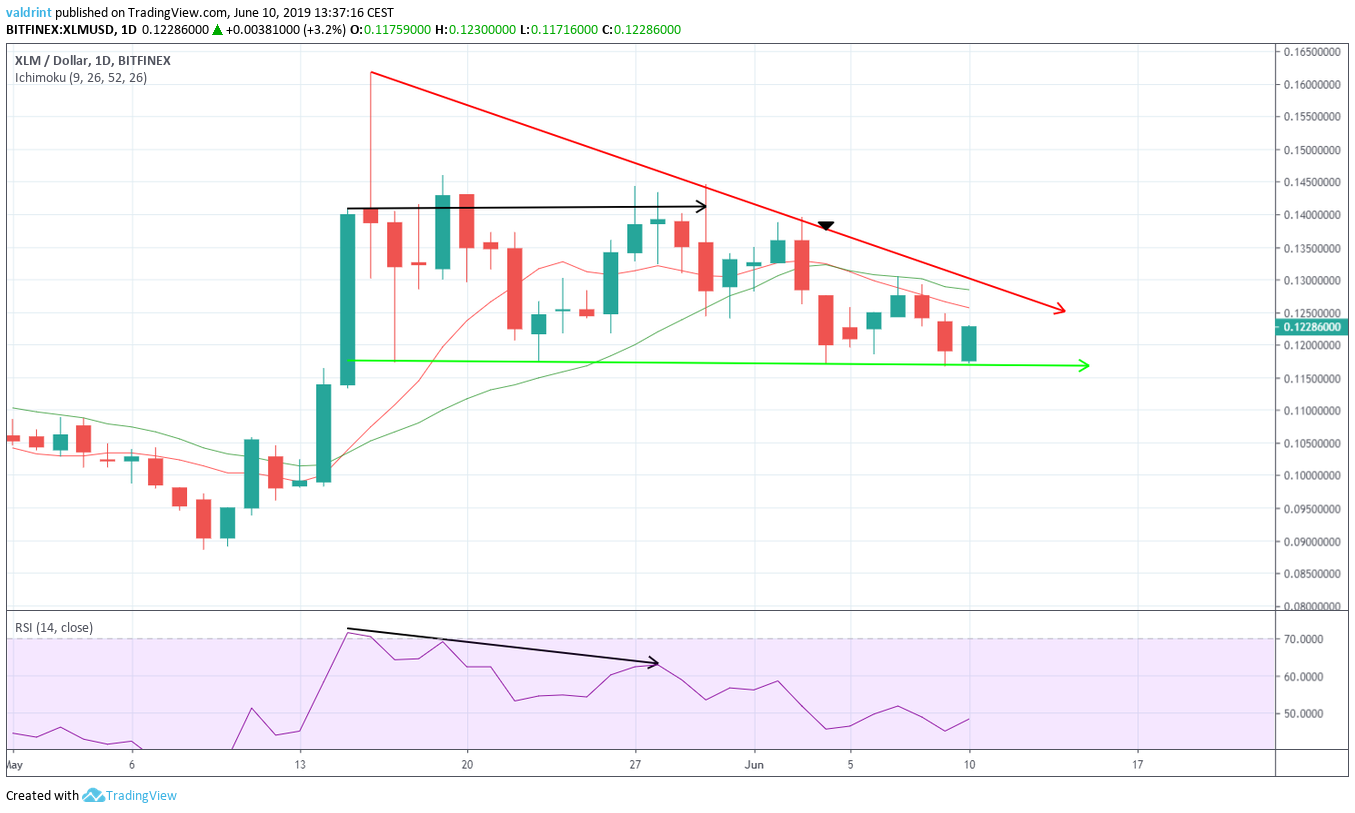
On June 4, a bearish cross occurred between the 10- and 20-day moving averages. This often indicates that a downtrend has begun. Since then, the Stellar Lumens price (XLM) has been trading below both MAs.
Furthermore, significant bearish divergence is observed in the RSI between the highs on May 16 and 30.
To conclude, the use of these indicators supports a short-term increase. However, they give a significant bearish outlook for the long-term.
Stellar Lumens Price (XLM): Reversal Areas
One support area and one resistance area are outlined for XLM below. If a decisive move occurs, they are likely to provide a reversal.
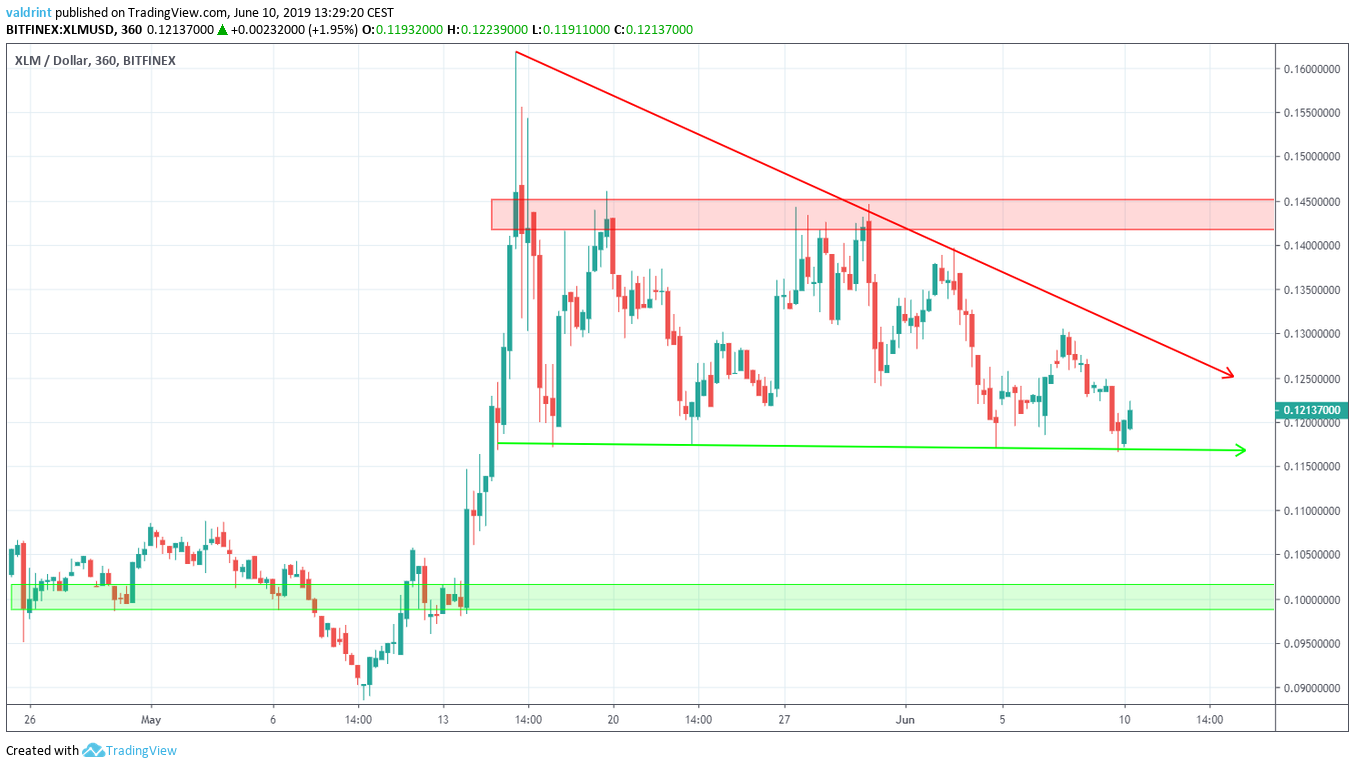
The closest support area is found near $0.10. If the Stellar Lumens price (XLM) breaks down from the triangle, it is likely to provide a reversal.
Conversely, the closest resistance area is found near $0.145. If the price breaks out from the triangle, it is likely to meet resistance in this area. According to technical indicators, this is unlikely.
Summary
To conclude, we believe that the Stellar lumens price (XLM) has likely reached a top on May 16. Since then, the price has been trading inside a descending triangle. Technical indicators give a slightly bullish outlook in the short-term and a bearish outlook for the long term.
Do you think the Stellar lumens price (XLM) will break down from the triangle? Let us know your thoughts in the comments below.
Disclaimer: This article is not trading advice and should not be construed as such. Always consult a trained financial professional before investing in cryptocurrencies, as the market is particularly volatile.


