


The Stellar (XLM) price has broken out from a long-term resistance area and is trading inside a shorter-term range.
Until the price breaks upwards or downwards from the latter, we cannot accurately determine the direction of the future movement.
Weakness After the Breakout
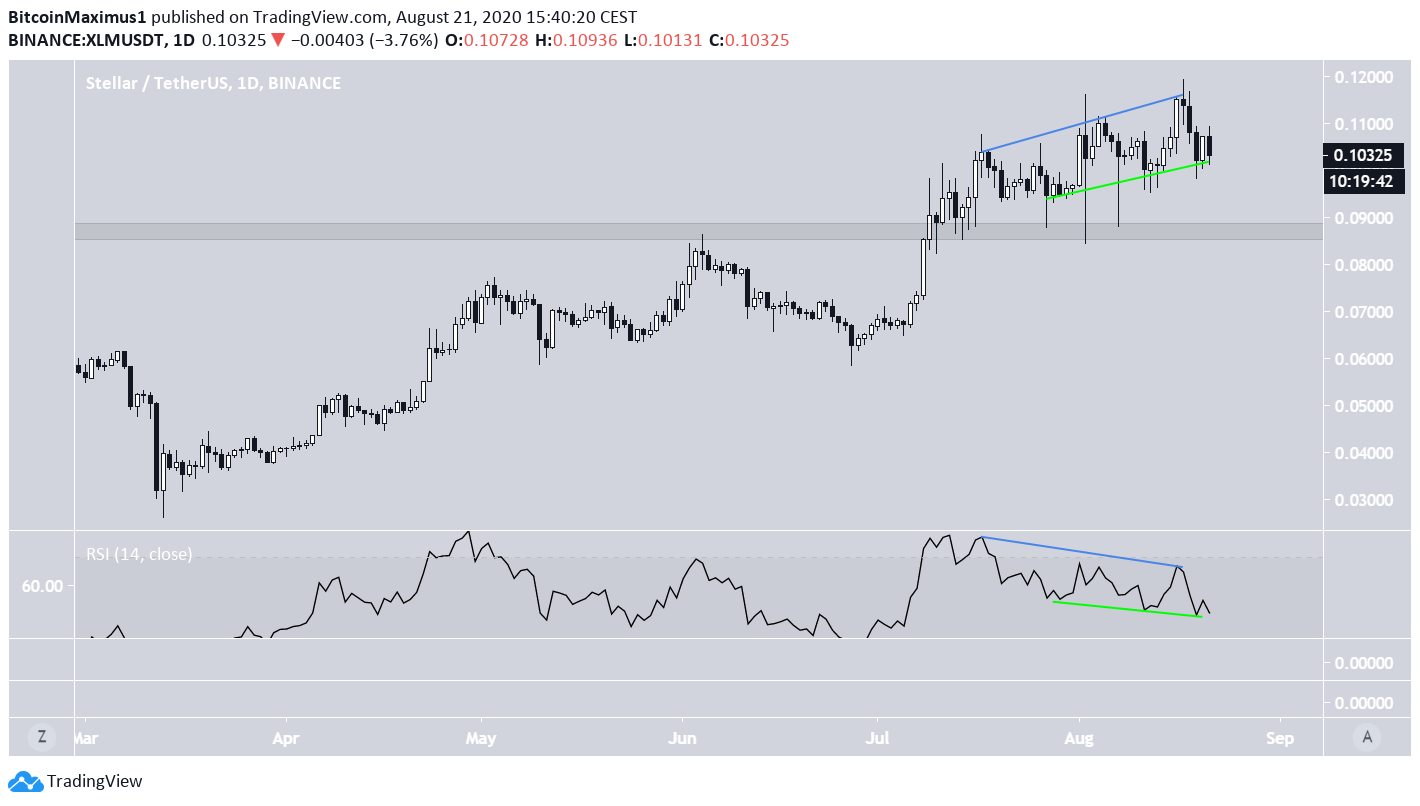
On July 5, the XLM price broke out from the $0.087 area, which had been providing resistance since July 2019. After breaking out, the price validated this as support and continued moving upwards.
However, the move since has not been impulsive, rather, the price has created long wicks on each side during a gradual increase. This makes it possible that the previous rally is a correction rather than a new upward move.
Technical indicators give conflicting signs. The RSI has formed bearish divergence, which preceded a decline from $0.119, but has followed that up with hidden bullish divergence. While the direction of the trend is currently not clear, as long as the price is trading above $0.087, we can consider the price action bullish.
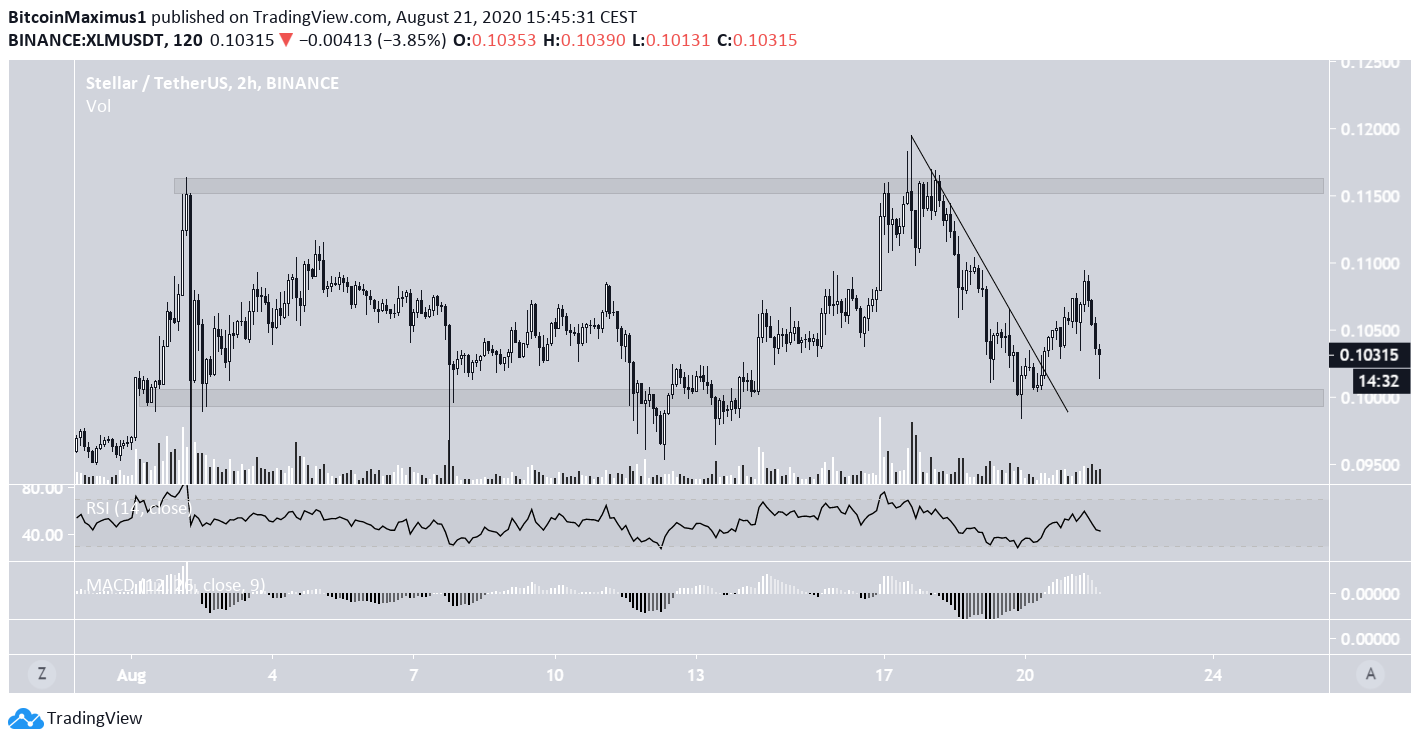
The shorter-term chart shows a range between $0.10 – $0.115, with the price being very near the former. In addition, we can see a breakout from a short-term descending resistance line. However, the breakout took place on particularly low volume.
Neither the RSI nor the MACD is clearly set on a direction, so it’s likely that the price will continue trading between these two levels.
XLM Wave Count
Cryptocurrency trader @Glowto1994 outlined a wave count for XLM in which the price increases all the way to $0.16 after a short-term fall.
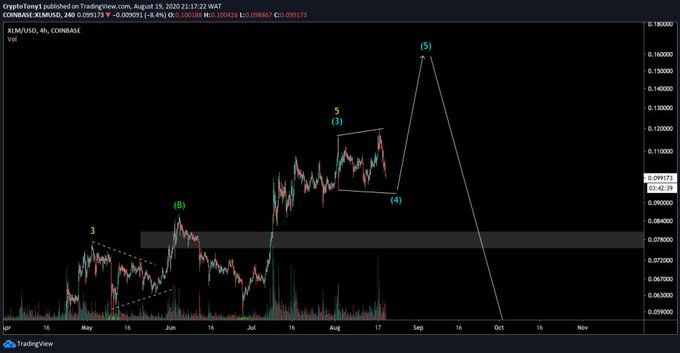
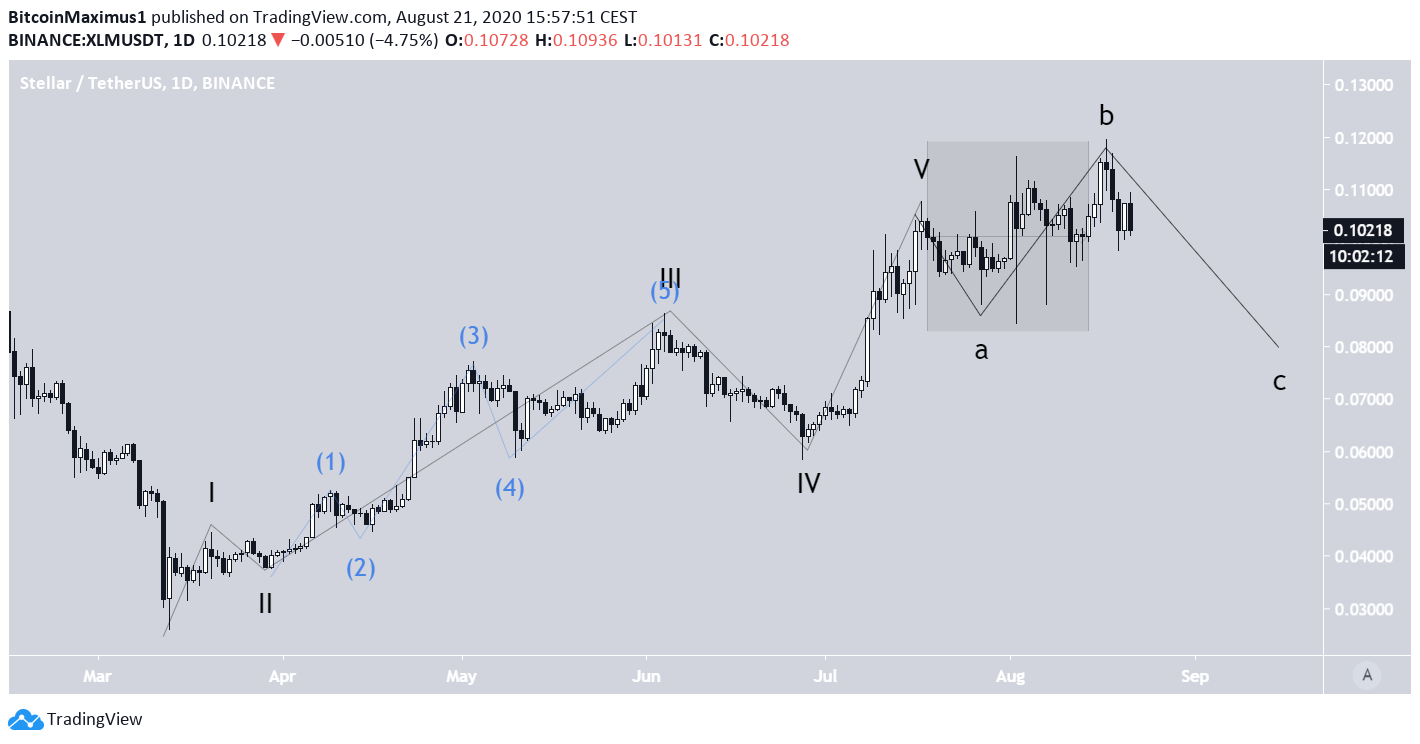
Beginning from the March 13 bottom, the wave count suggests that the price has just completed wave 3 (black) and has now begun wave 5. While this is a valid formation, the corrections of sub-wave 4 (blue) and wave 4 (black) are extremely unusual.
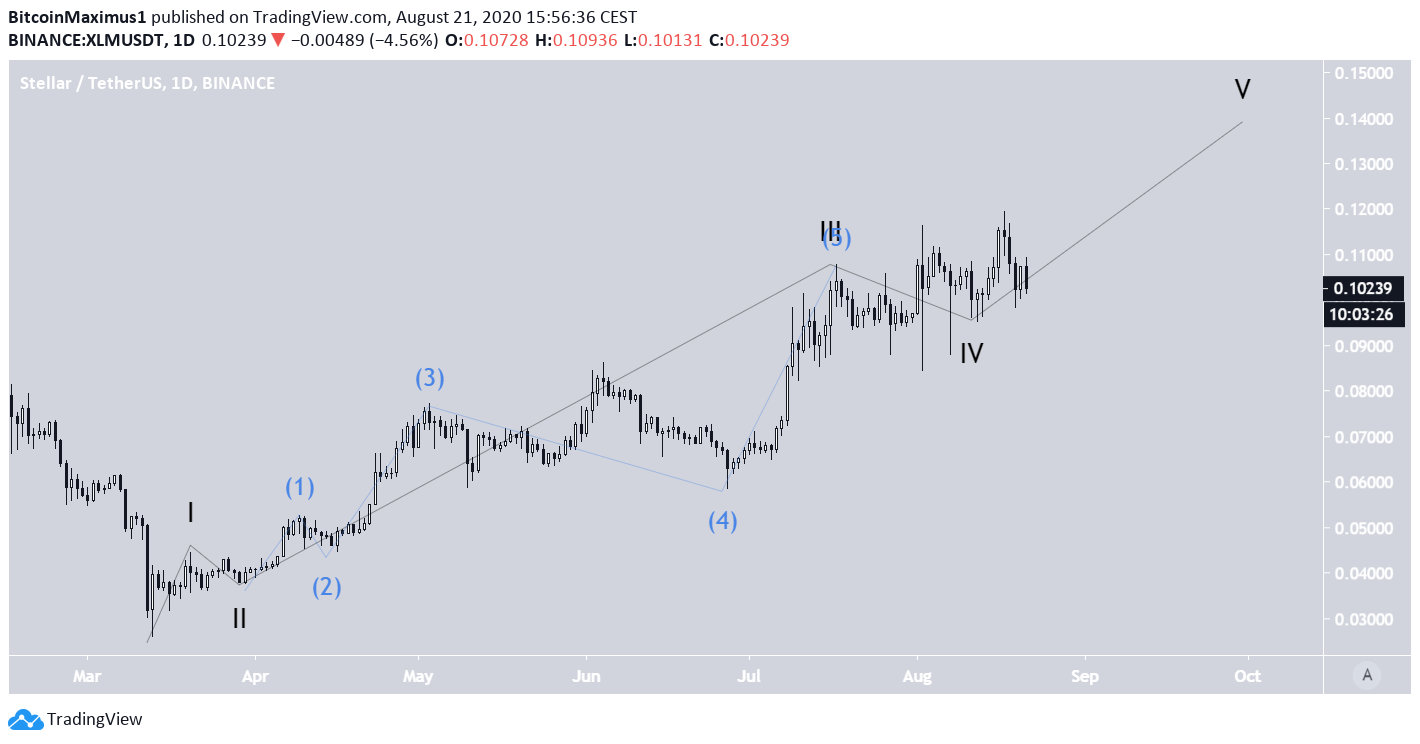
In addition, it’s also possible that the price has already completed a five-wave impulsive formation, and is now in an expanded flat correction.
Due to the overlap and numerous long wicks during the July 10 – August 10 period, it’s difficult to highlight the correct formation.
To conclude, the XLM price has broken out from a long-term resistance area, but it’s not yet confirmed whether the breakout is at the beginning of a new upward movement or a correction. A breakout/down from the short-term range outlined in the first section will determine the direction of the future trend.


