


The Stacks (STX) price reached a new yearly high on March 20, but has begun to show signs of weakness.
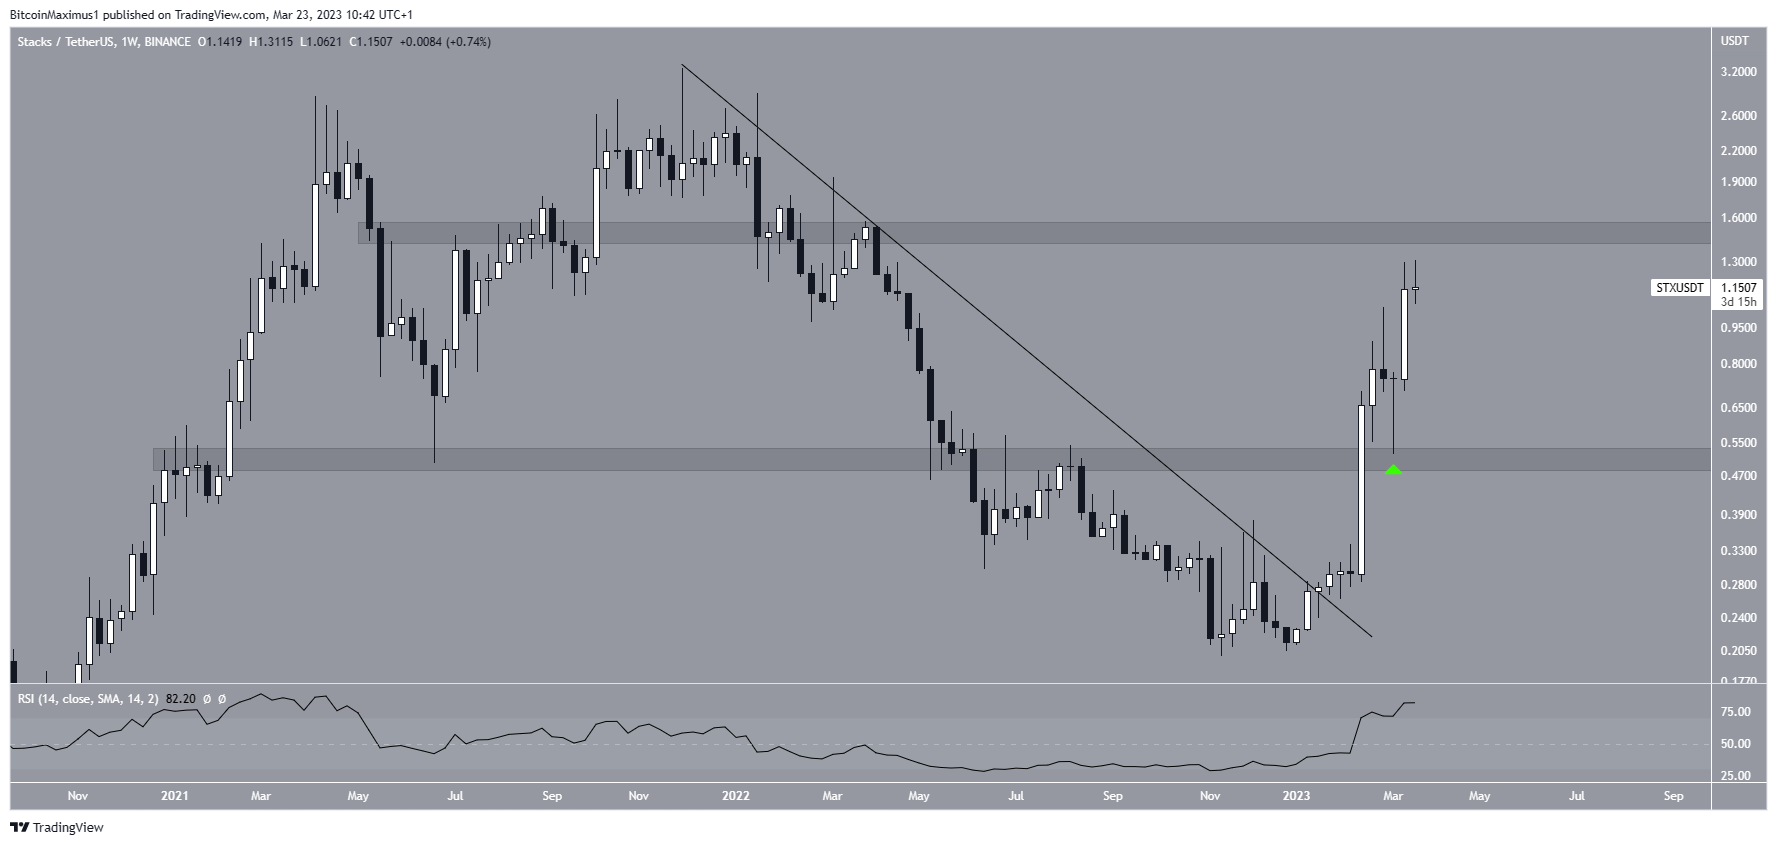
The weekly chart shows that the STX price has increased since the beginning of the year, breaking out from a long-term resistance line in January. Afterward, it created a massive, long lower wick (green icon) during the week of March 6-13. The wick validated the $0.50 horizontal area as support. The price followed this up with a bullish candlestick next week, leading to a yearly high of $1.31.
The ongoing upward movement is supported by the RSI, which broke out above 70 and is still increasing. Despite being in overbought territory, the indicator has not generated any bearish divergence.
If the increase continues, the next resistance area would be at $1.55.
Stacks (STX) Rally Coming to an End?
The technical analysis from the daily time frame shows that the STX price could be nearing a local top. There are two main reasons for this.
Firstly, the price seems to have completed an extended third wave (white) in a five-wave upward movement. The sub-wave count is given in black.
Besides a completed sub-wave count, the daily RSI also supports the possibility of a drop since it has generated bearish divergence (green line).
If a drop occurs, the STX token price could fall toward the 0.5-0.618 Fib retracement support levels at $0.63-$0.76. Afterward, the fifth and final wave could reach the previously outlined $1.55 resistance area.
A decrease below the wave one high (red line) of $0.38 would invalidate the wave count and could cause a drop toward $0.20.
On the other hand, a close above $1.31 could lead to an immediate pump toward $1.55. The next 24 hours will likely be crucial in determining the future trend.
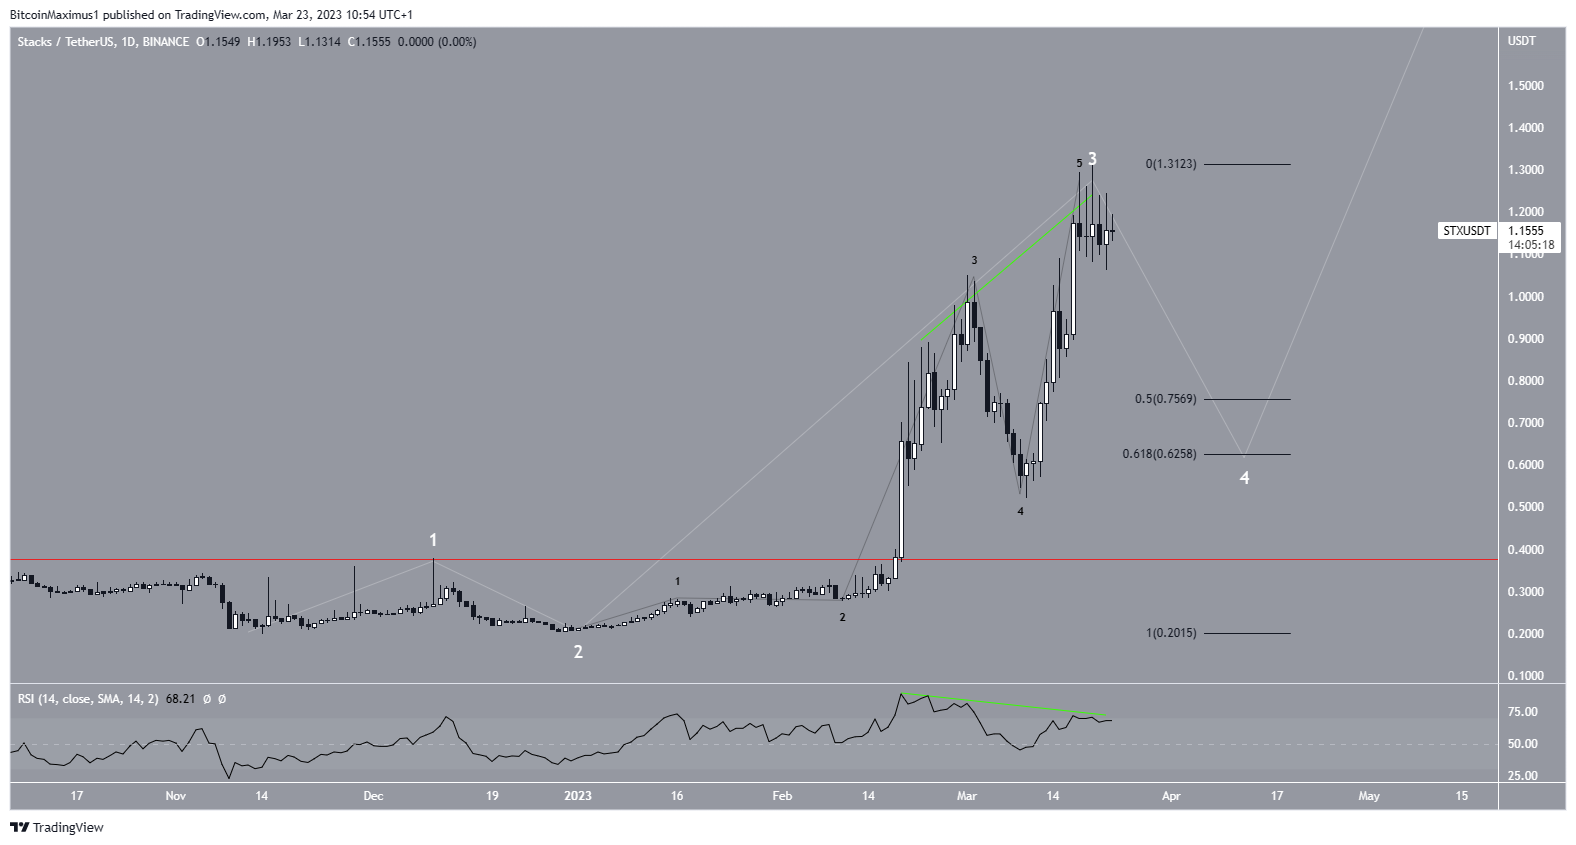
To conclude, the most likely Stacks price forecast is a drop to the $0.63-$0.76 region before the continuation of the increase. A daily close above $1.31 would invalidate the bearish forecast and cause an increase toward $1.55.


