
Be[In]Crypto analyzes the price movement for seven different cryptocurrencies, including Stacks (STX), which is in the process of validating the $0.42 area as support.
BTC
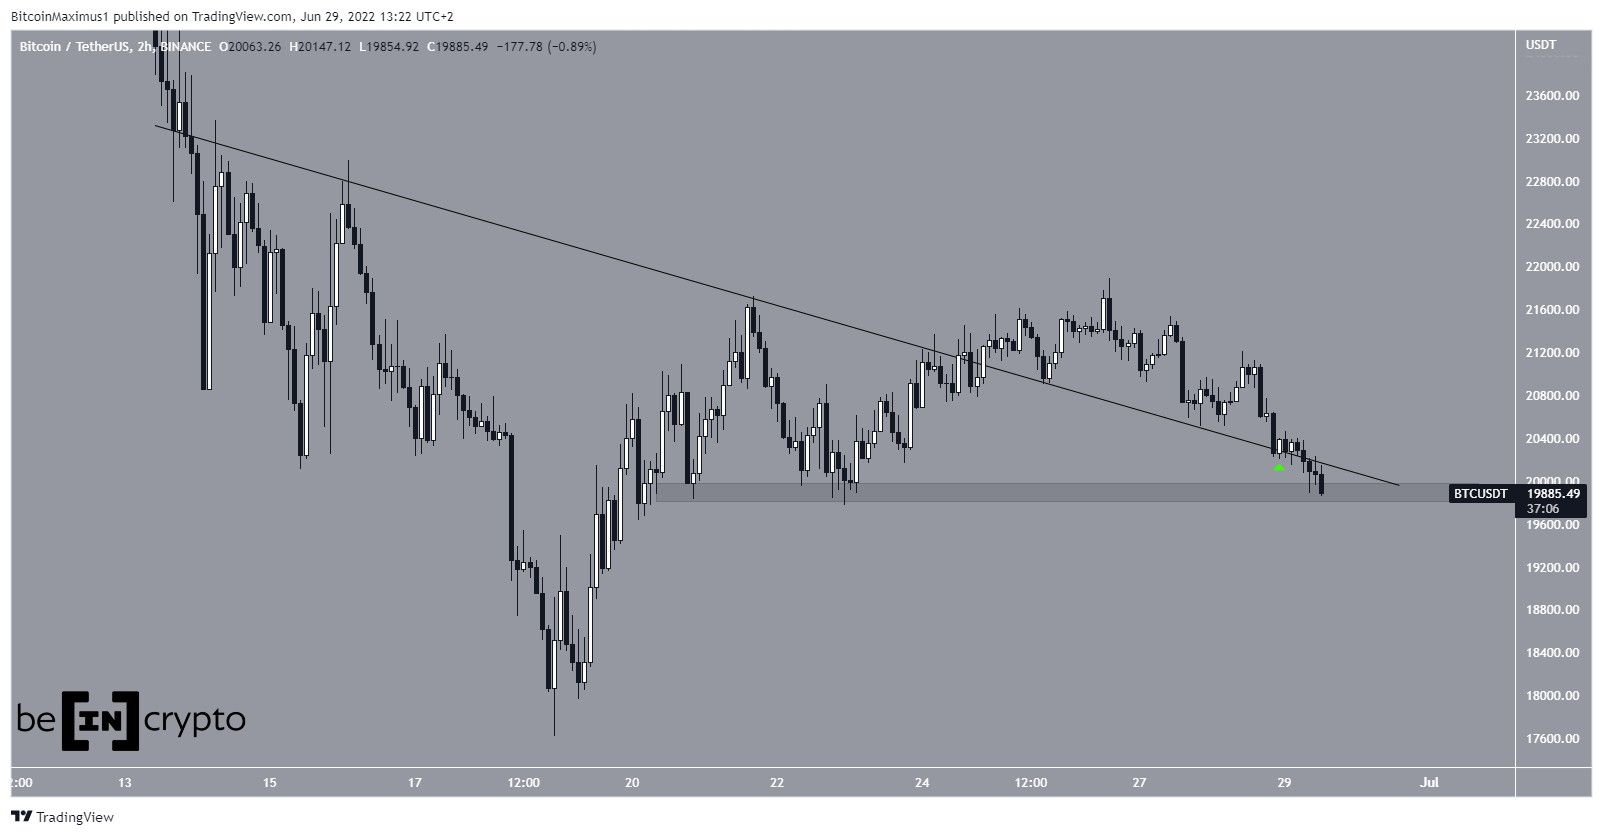
On June 24, BTC broke out from a descending resistance line that had previously been in place since June 13.
Afterward, it attempted to validate it as support on June 28 (green icon), but failed to do so and fell below the area shortly afterward.
Currently, the price is attempting to hold on above the $19,800 horizontal support area. This is the final support prior to the June lows at $17,600.
ETH
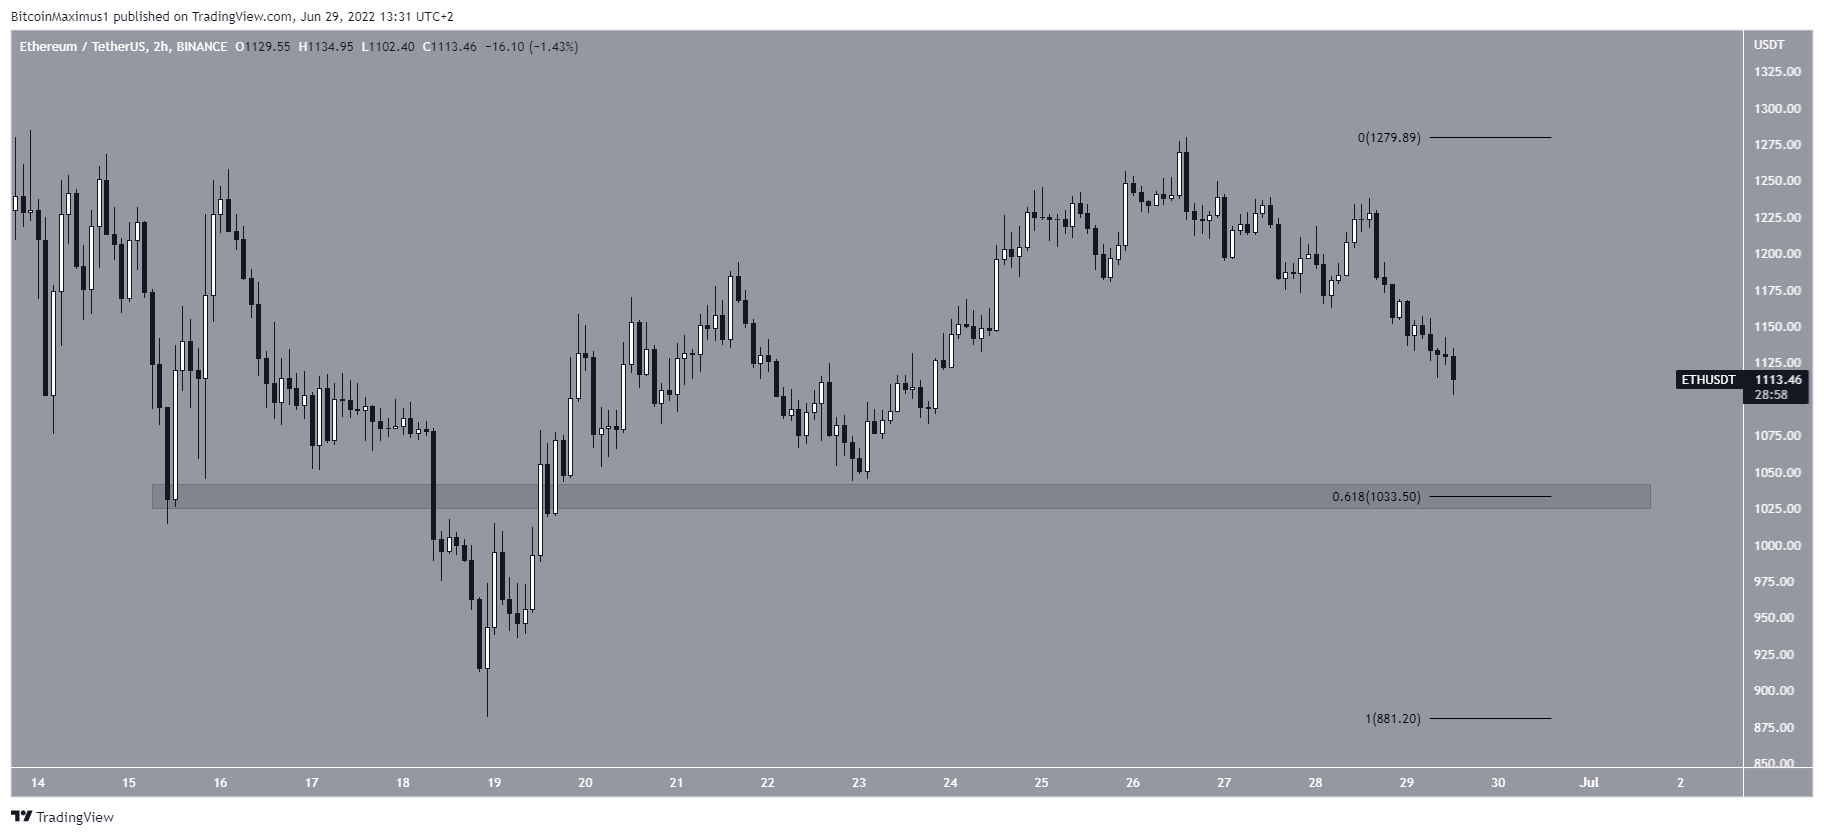
Similar to BTC, ETH has been moving upwards since June 18. The upward movement led to a high of $1,280 on June 26.
The price has been decreasing since and is approaching the main support area at $1,033. This is the 0.618 Fib retracement support level and a horizontal support area.
XRP
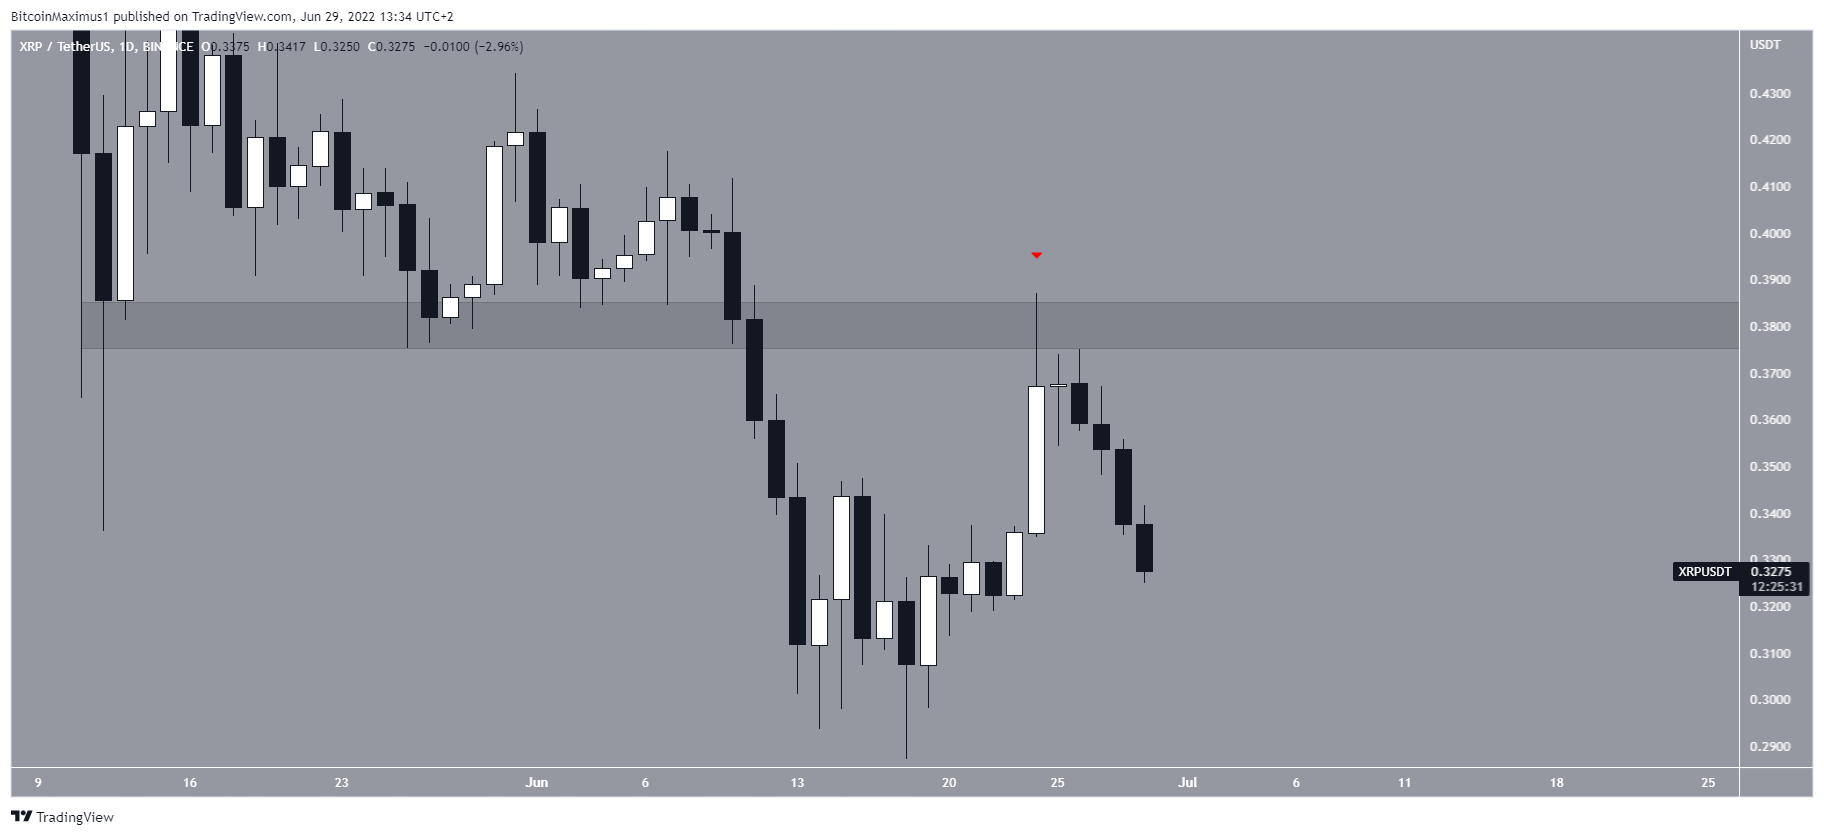
On June 24, XRP reached a high of $0.38 on June 24. But, it was rejected by the $0.38 horizontal resistance area, which had previously been acting as support since May 9.
This initiated a downward movement that has so far taken the price to $0.33. The next closest support area is at $0.30, created by the June lows.
STX
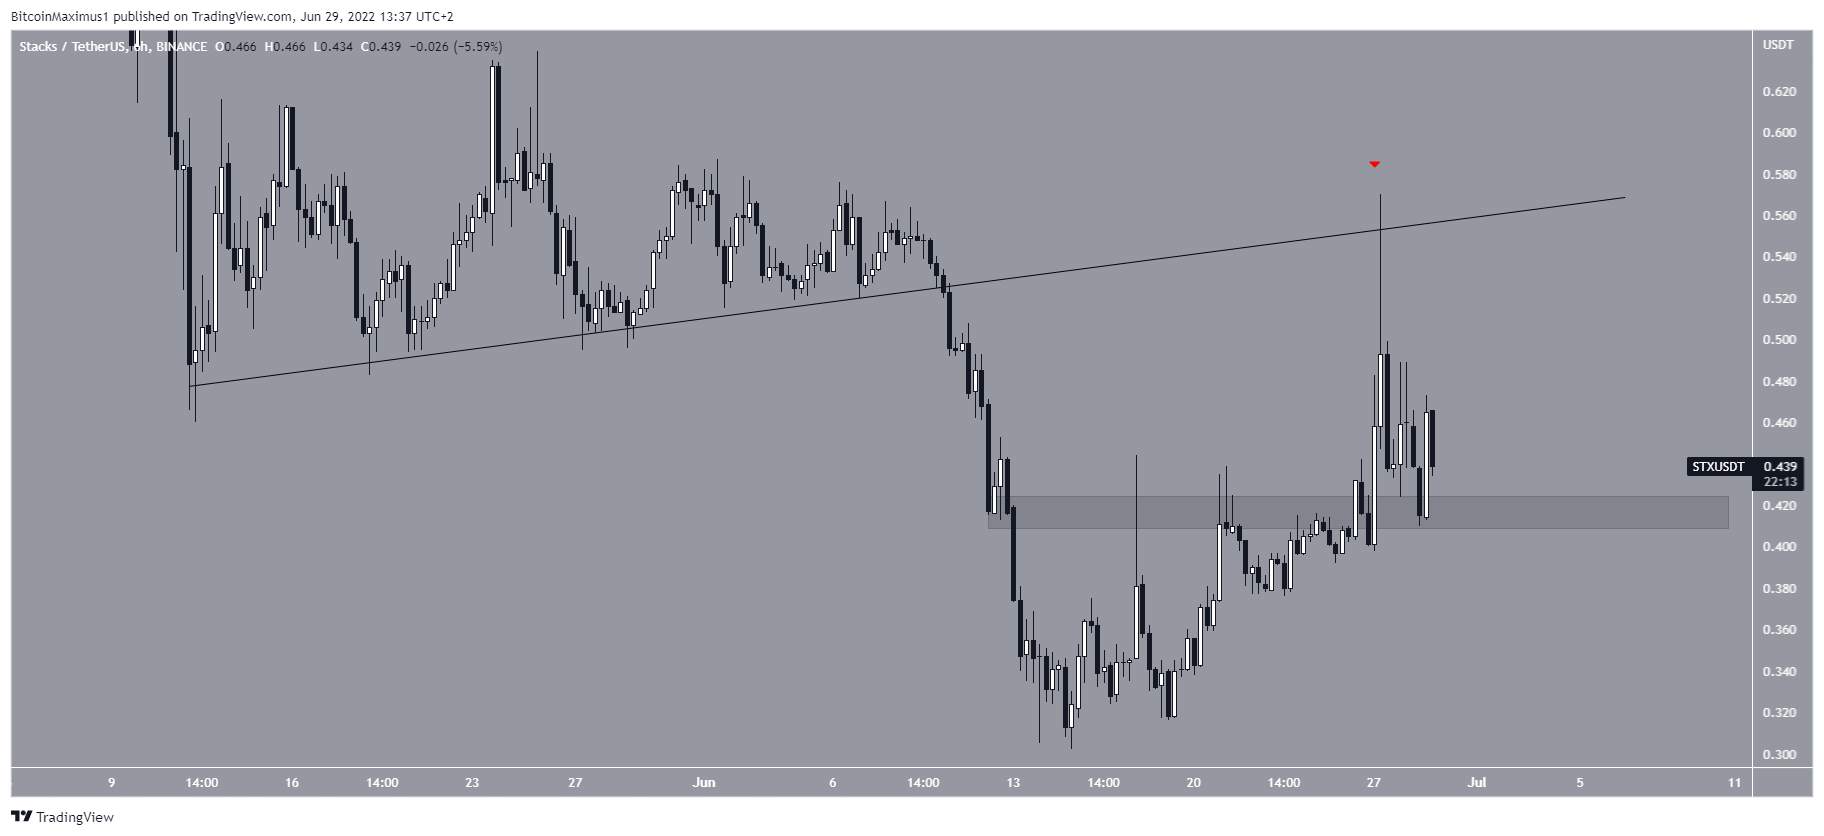
STX has been increasing since June 14. The upward movement has so far led to a high of $0.57 on June 27. This caused a rejection from the previous ascending support line, which has now turned to resistance (red icon).
Despite the rejection, the price has managed to hold on above the $0.42 horizontal area, which has now turned to support.
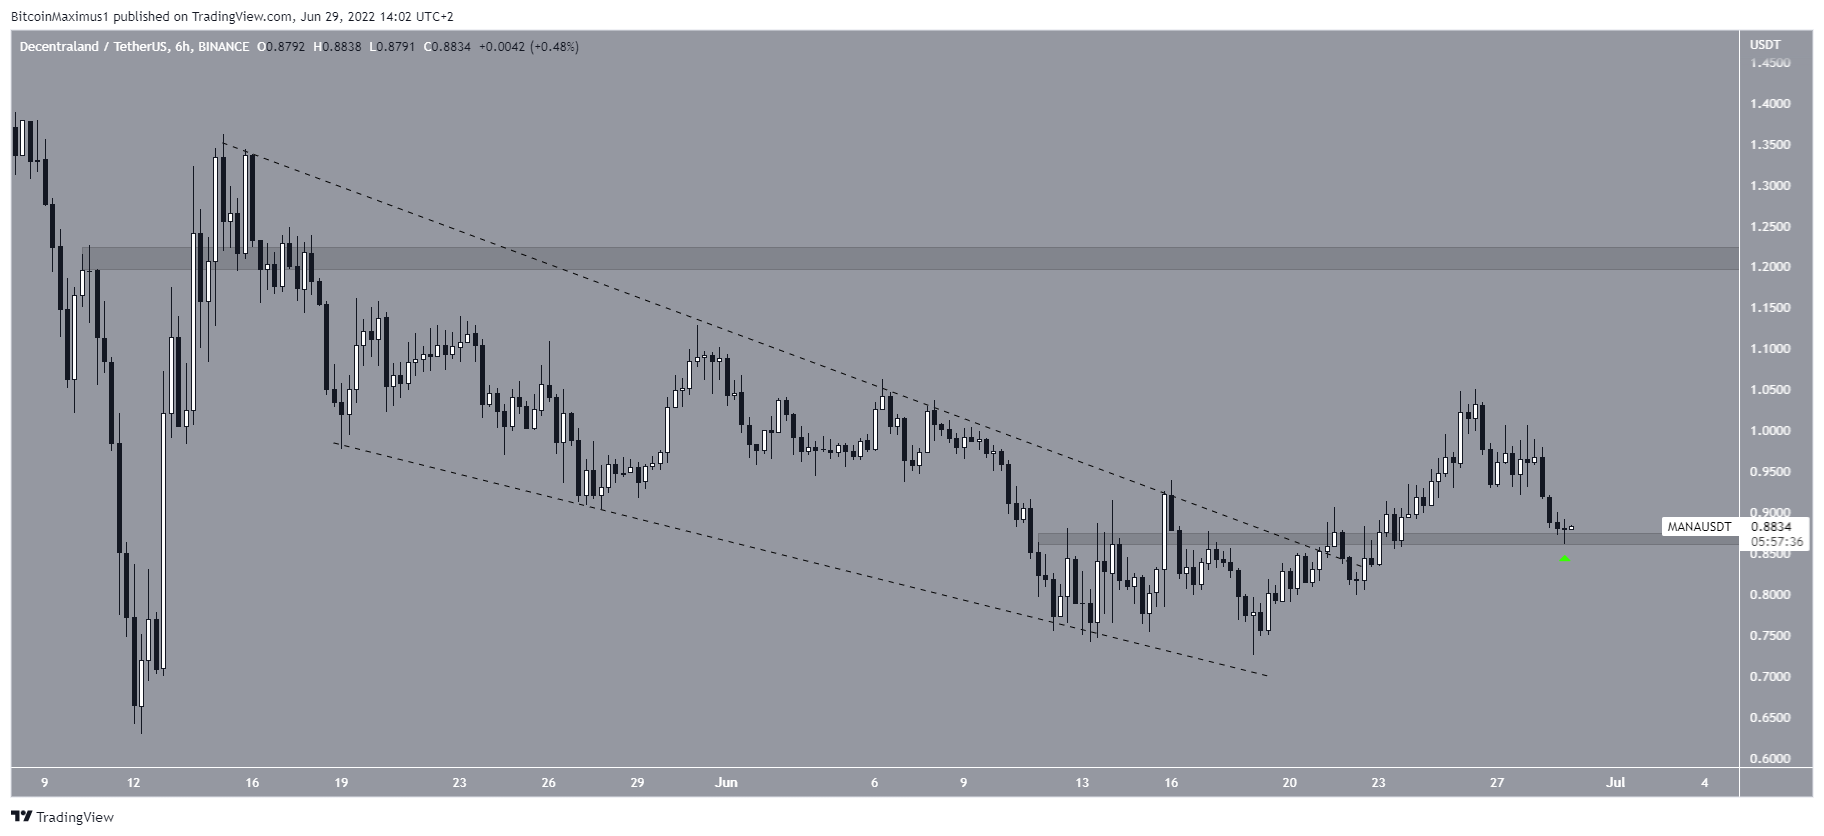
MANA
On June 22, MANA broke out from a descending resistance line and proceeded to reach a high of $1.05 on June 26.
The price has been falling since but bounced above the $0.86 horizontal support area on June 29.
If it manages to create a higher low at this level, the next resistance would be at $1.22.
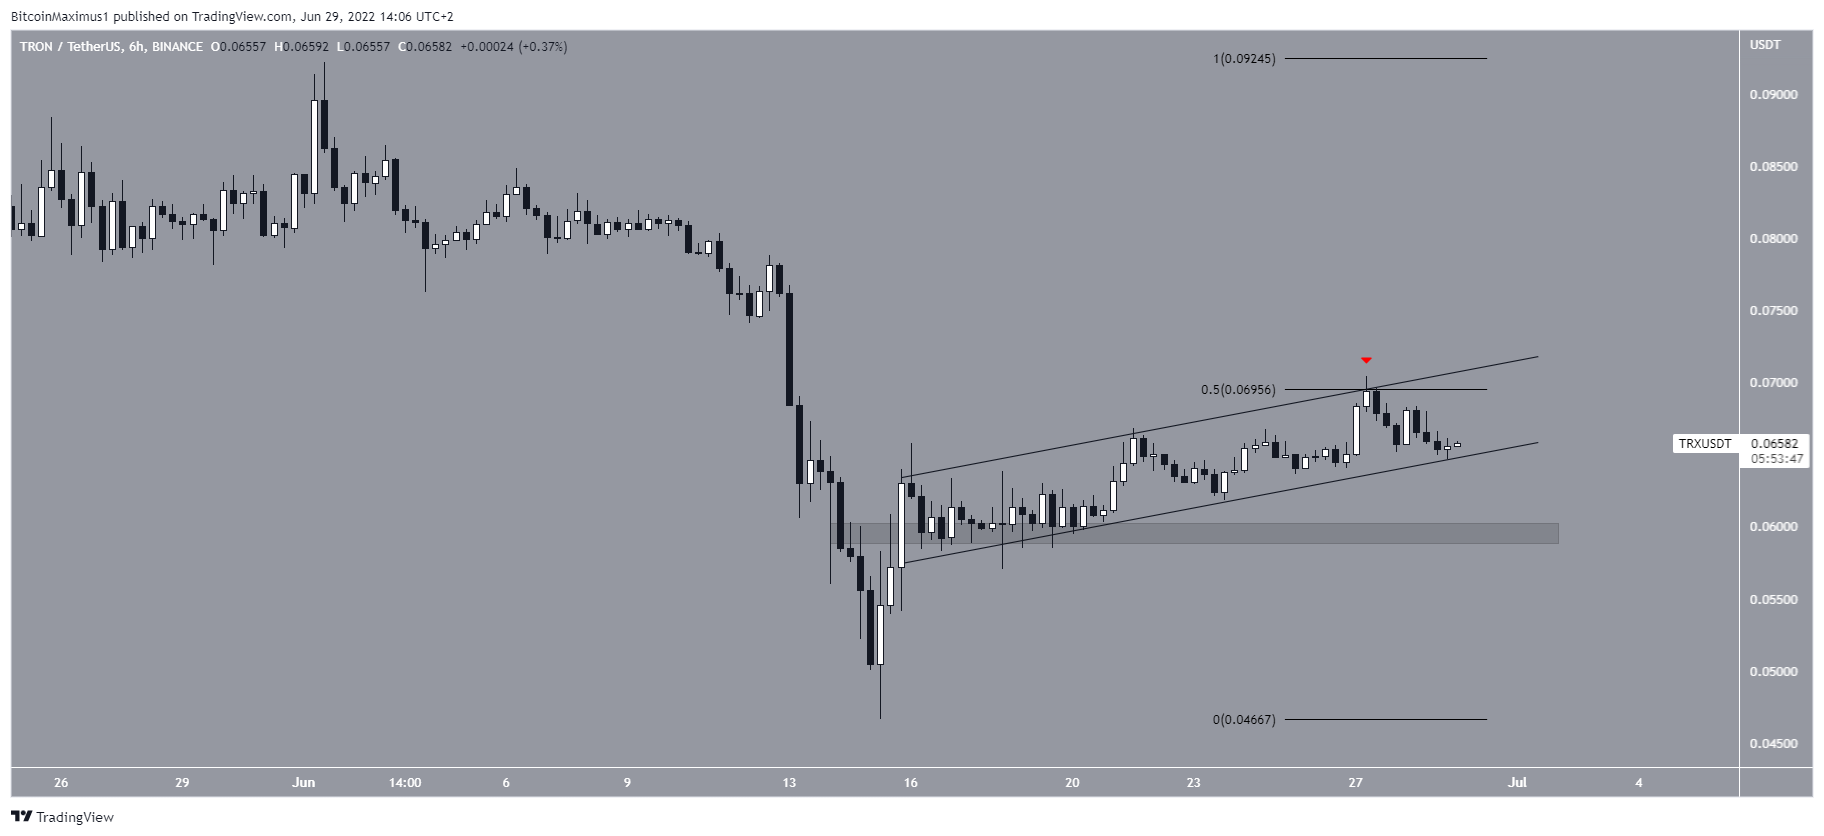
TRX
On June 15, TRX initiated a sharp upward movement that led to a high of $0.066 the next day. Since then, the price has been increasing at a very gradual pace, trading inside an ascending parallel channel. Such channels usually contain corrective movements, meaning that an eventual breakdown from it would be expected.
Furthermore, the price has been rejected by the 0.5 Fib retracement resistance level (red icon).
If a breakdown from the channel transpires, the closest support area would be at $0.06.
ALPHA
ALPHA has been decreasing since it was rejected by the $0.138 resistance area on June 26 (red icon). The downward movement has so far led to a low of $0.1. This is a minor horizontal support level.
If it fails to initiate a reversal, the price would be expected to decrease towards its June lows at $0.094.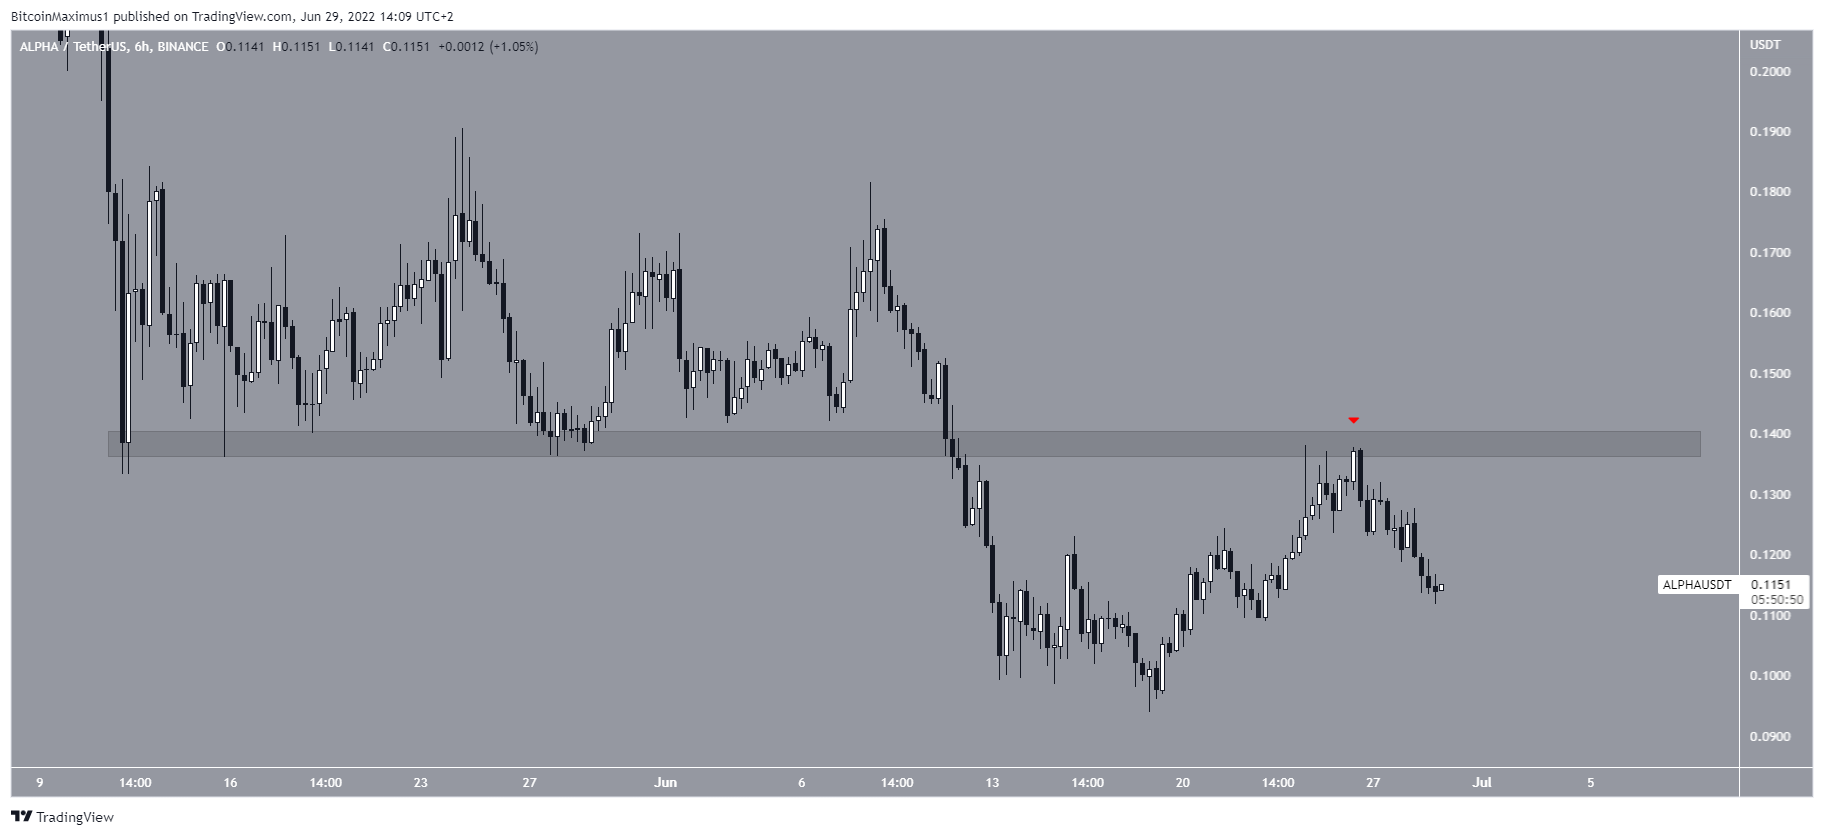
For Be[in]Crypto’s latest bitcoin (BTC) analysis, click here
