


Serum (SRM) broke out from the $10 horizontal area on Sept 9 and nearly reached a new all-time high price.
As long as it is trading above this level, it is likely to continue moving upwards towards price discovery.
SRM breaks out
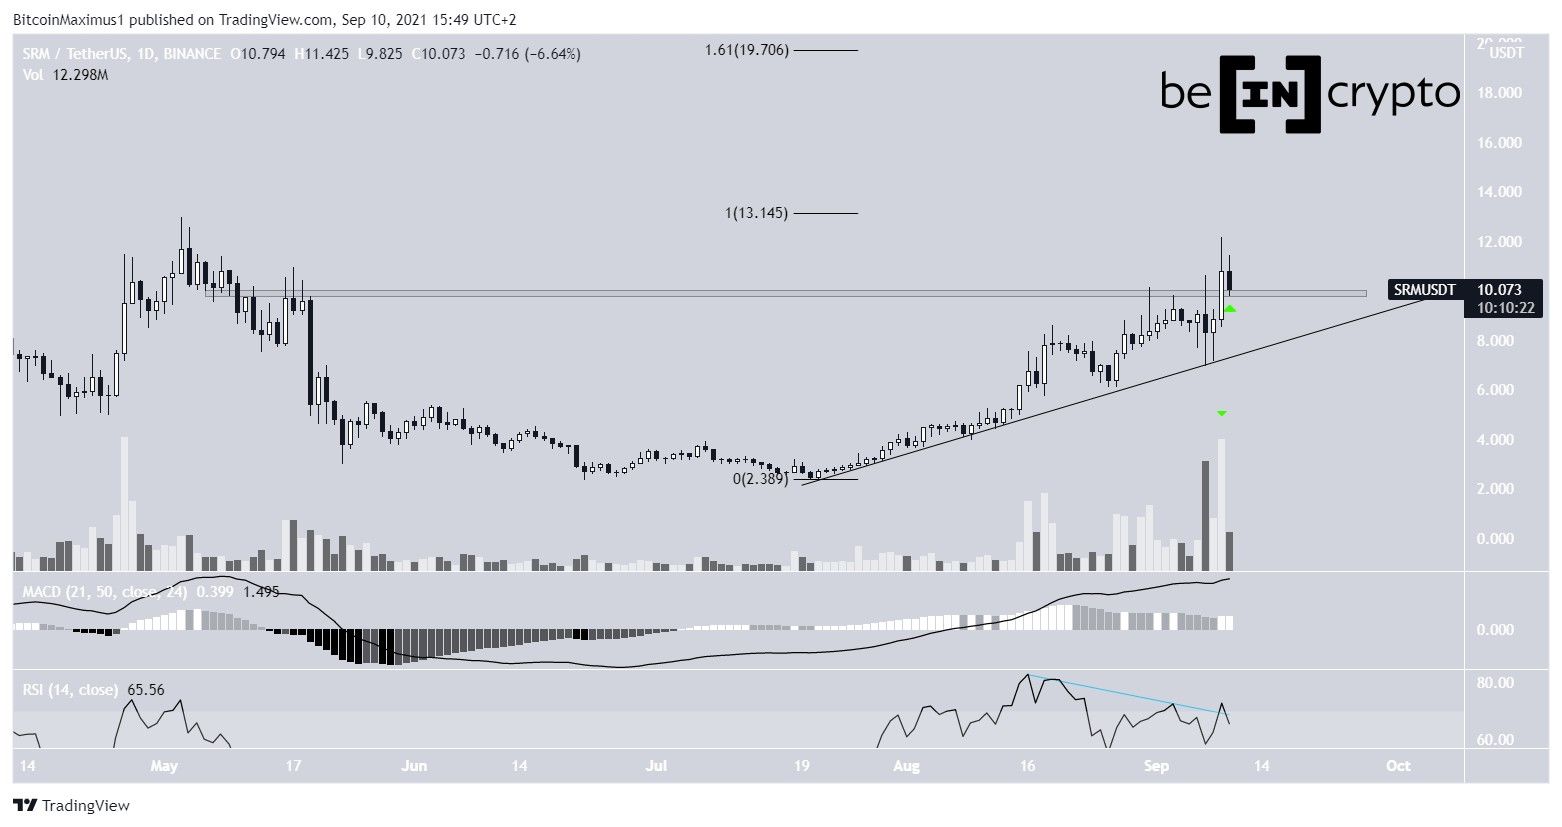
SRM has been increasing alongside an ascending support line since July 20. On Aug 31, it made an attempt at breaking out above the $10 resistance area, but was unsuccessful in doing so. Afterwards, it began another upward movement on Sept 7 and managed to break out two days later. The breakout transpired with considerable volume.
However, it failed to reach a new all-time high, falling short when it reached a high of $12.17.
Currently, it is attempting to hold on above the $10 resistance area, potentially validating it as support.
If it manages to do that, it will likely increase towards a new all-time high and potentially move towards the $1.61 external Fib retracement resistance at $19.70.
Future movement
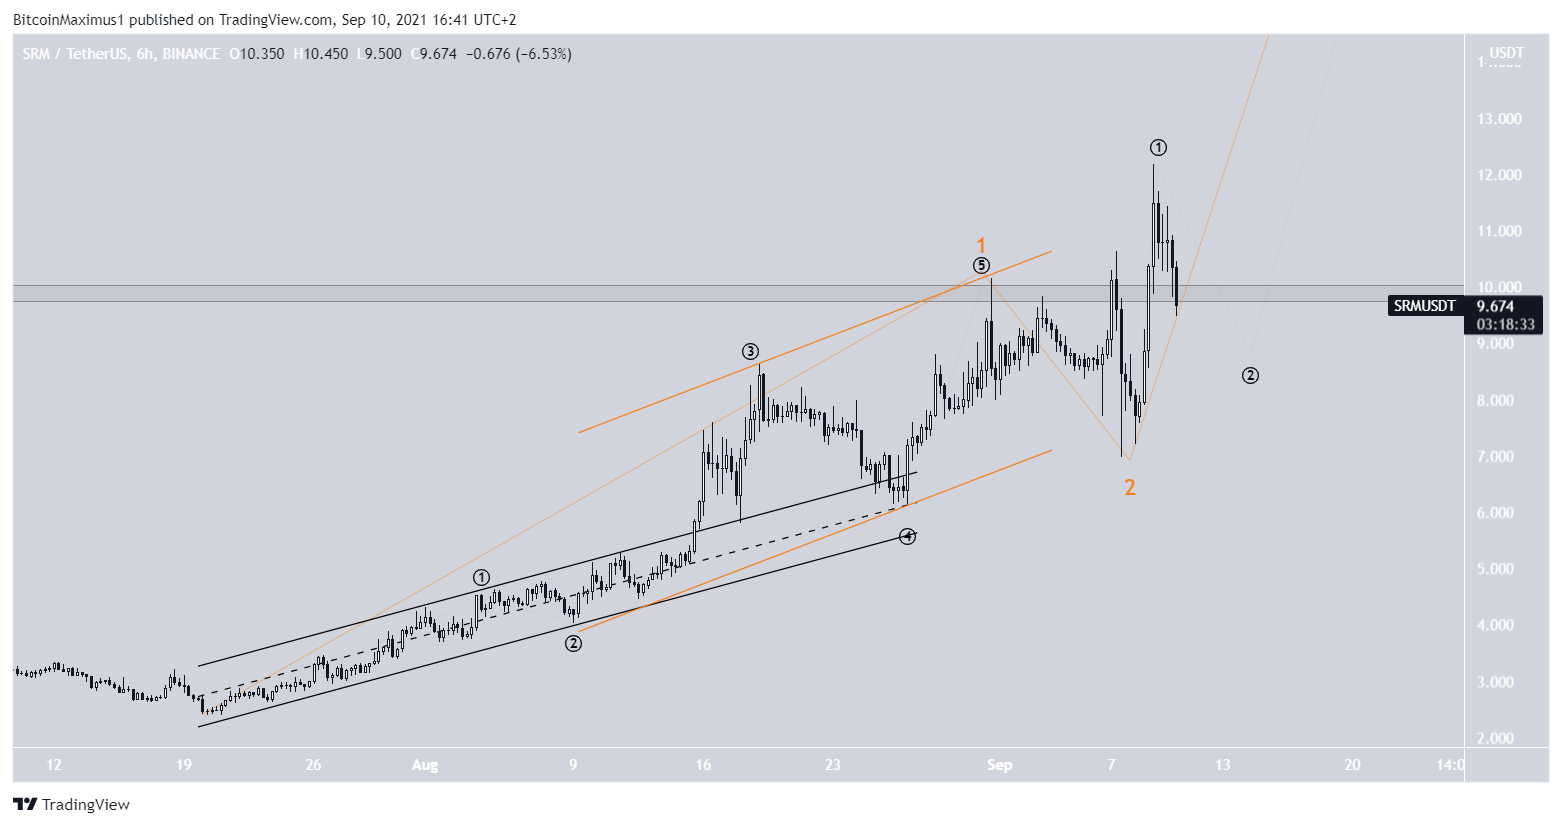
The wave count indicates that SOL has completed wave one of a bullish impulse (orange). The sub-wave count is given in black.
The impulse maintains all channeling rules, since a fourth wave pullback is completed in sub-wave four (black channel) and the top of sub-wave five reaches the top of the 2-4 channel (orange).
If the wave count is correct, it is possible that SRM has begun an extended long-term wave three, which could take it to a new all-time high and well into price discovery.
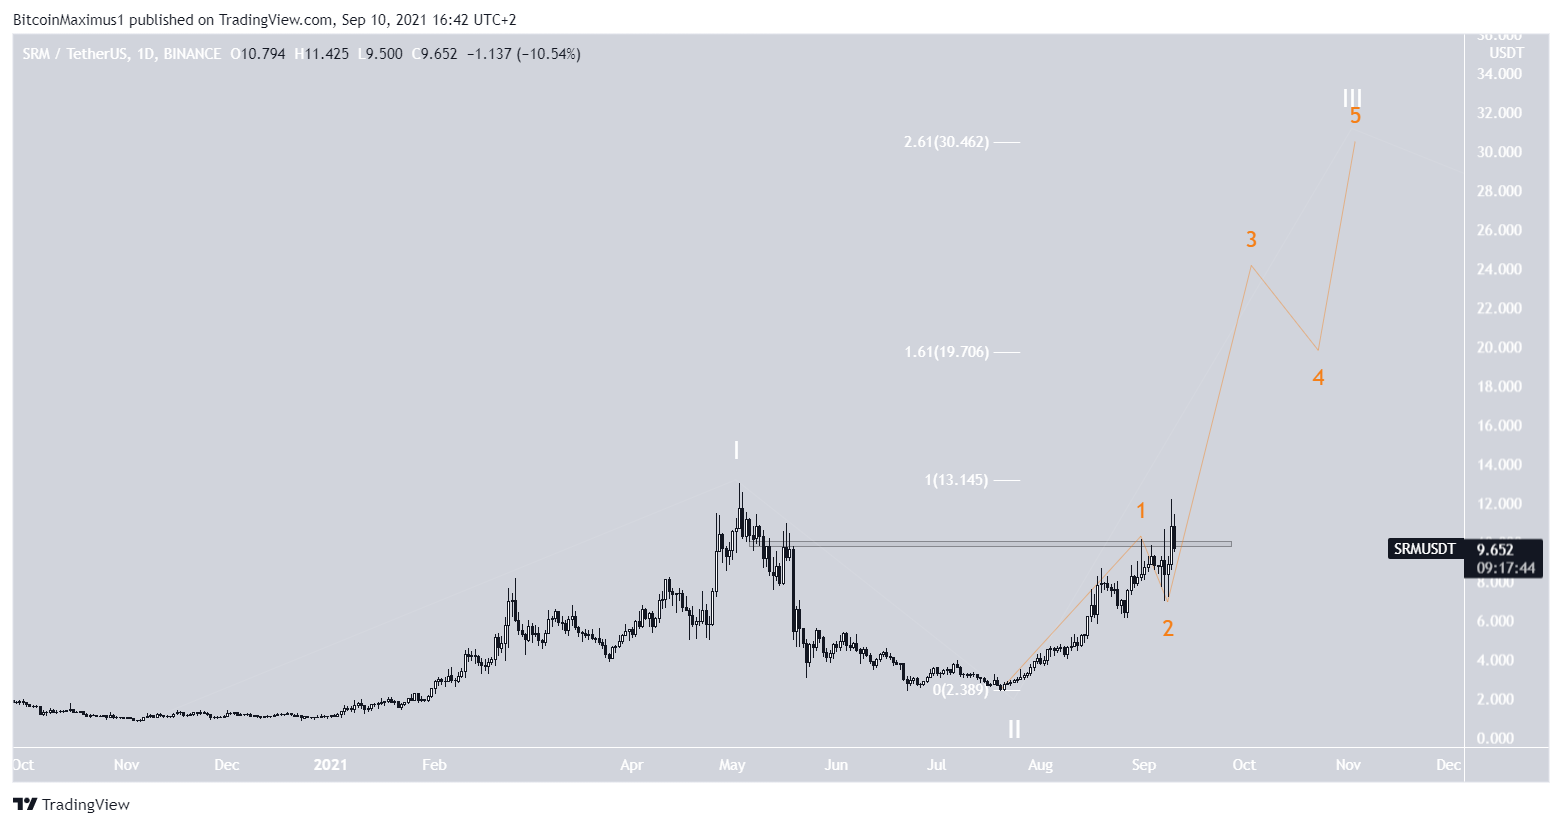
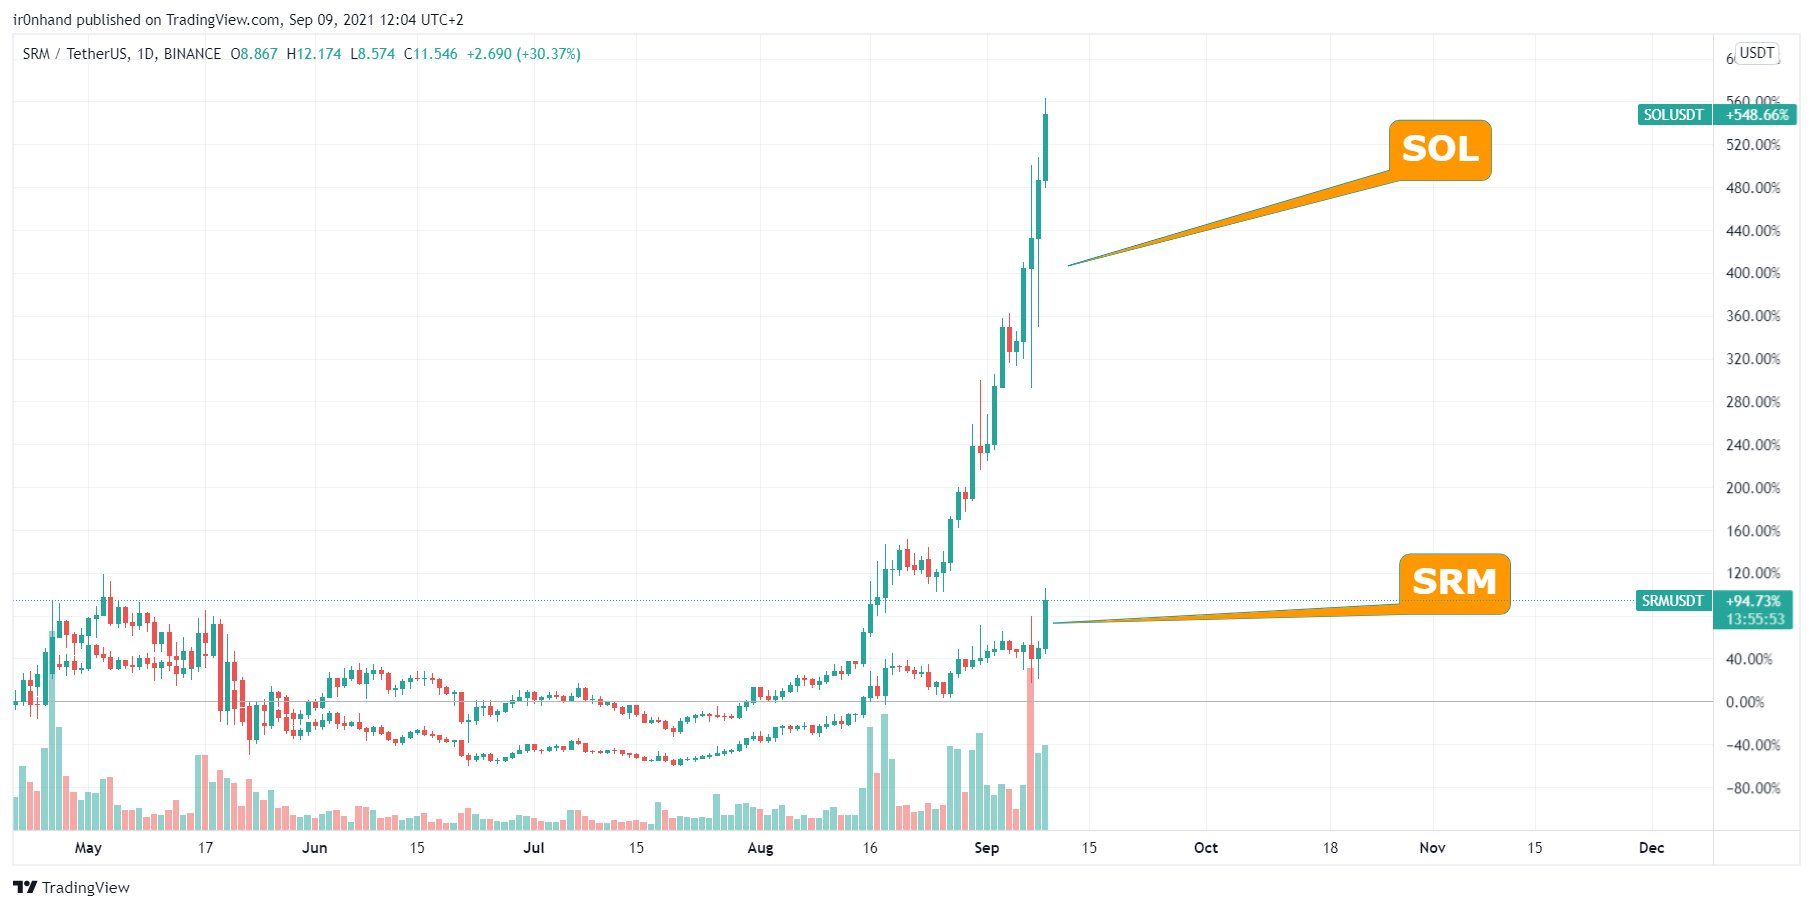
Cryptocurrency trader @J0hnnyw00 outlined the SRM chart, stating that its upward movement could mimic that of SOL. If the token manages to hold on above the $10 support area, it could indeed increase at a parabolic rate, as outlined in the previous count.
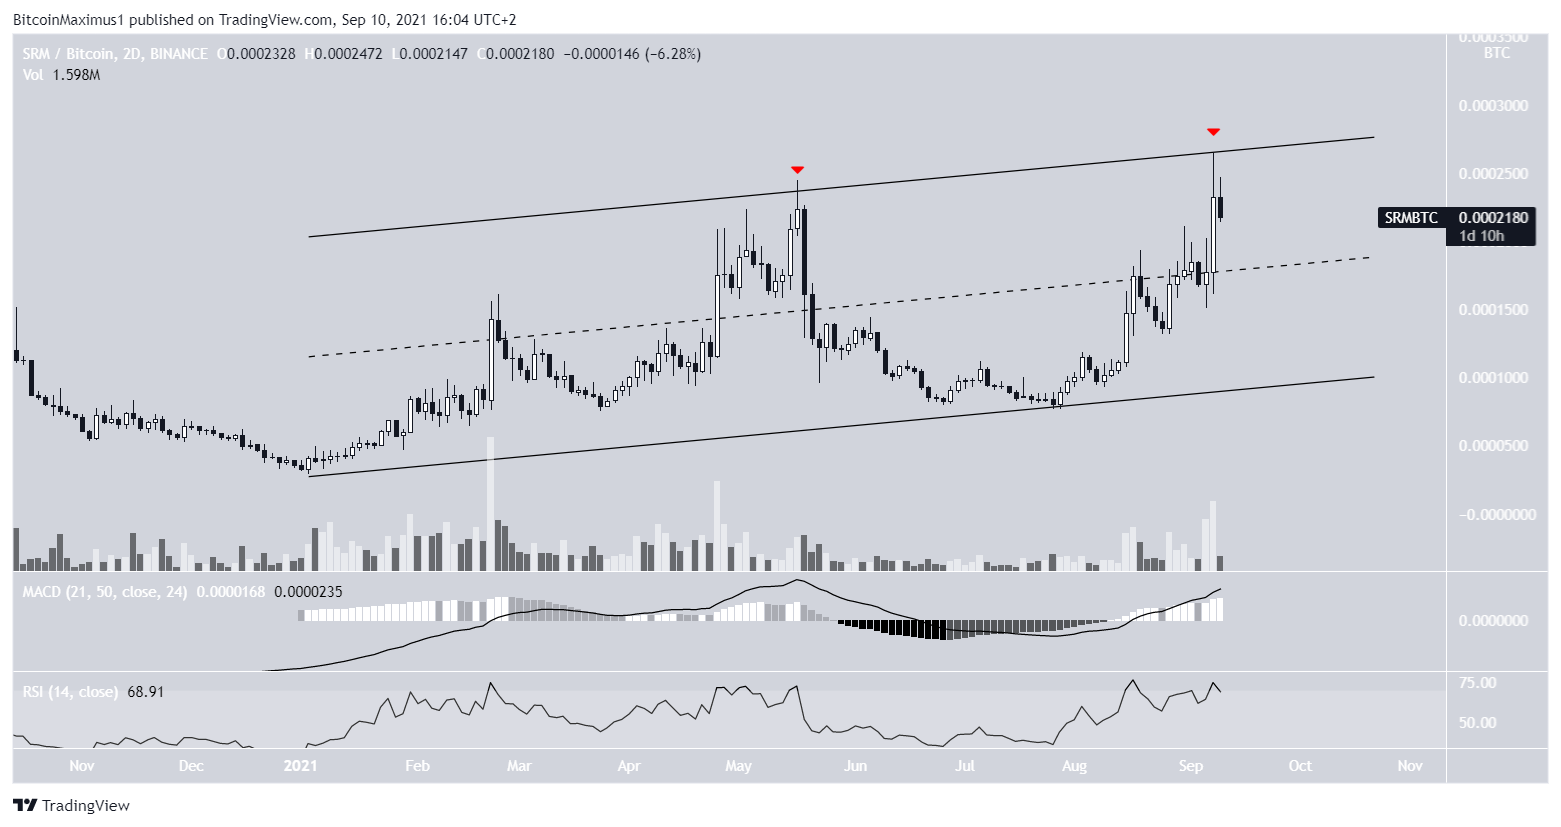
SRM/BTC
The SRM/BTC movement is not as clear as that of the USD pair. The token is trading inside a large ascending parallel channel. Such channels usually contain corrective structures.
Furthermore, it was rejected by its resistance line twice, most recently on Sept 9.
However, it is still trading inside the upper portion of the channel. In addition to this, the MACD and RSI are both increasing.
Therefore, due to the mixed signs, the token has to either break out from the channel or fall into its lower portion in order for the direction of the trend to become clear.
For BeInCrypto’s latest Bitcoin (BTC) analysis, click here.


