
Somnia, an EVM-compatible Layer 1 blockchain, has quickly birthed one of the fastest-rising new tokens. At press time, Somnia (SOMI) trades near $1.59, after jumping almost 40% in the past 24 hours. Since its launch, the Somnia price has been up more than 250%. Still, it has pulled back about 14% from its all-time high of $1.84, set only a few hours ago.
On the surface, this looks like a token cooling off. But repeating chart patterns and technical signals suggest that the price pullback could just be a pause before the next rally begins.
Chart Fractals Hint at Another Rally, With Bulls In Control
One of the clearest clues for the Somnia price comes from repeating momentum signals. The Relative Strength Index (RSI) is a tool that measures the strength of price moves on a scale of 0 to 100. Lower numbers suggest weakness, while higher numbers show strength.
Want more token insights like this? Sign up for Editor Harsh Notariya’s Daily Crypto Newsletter here.
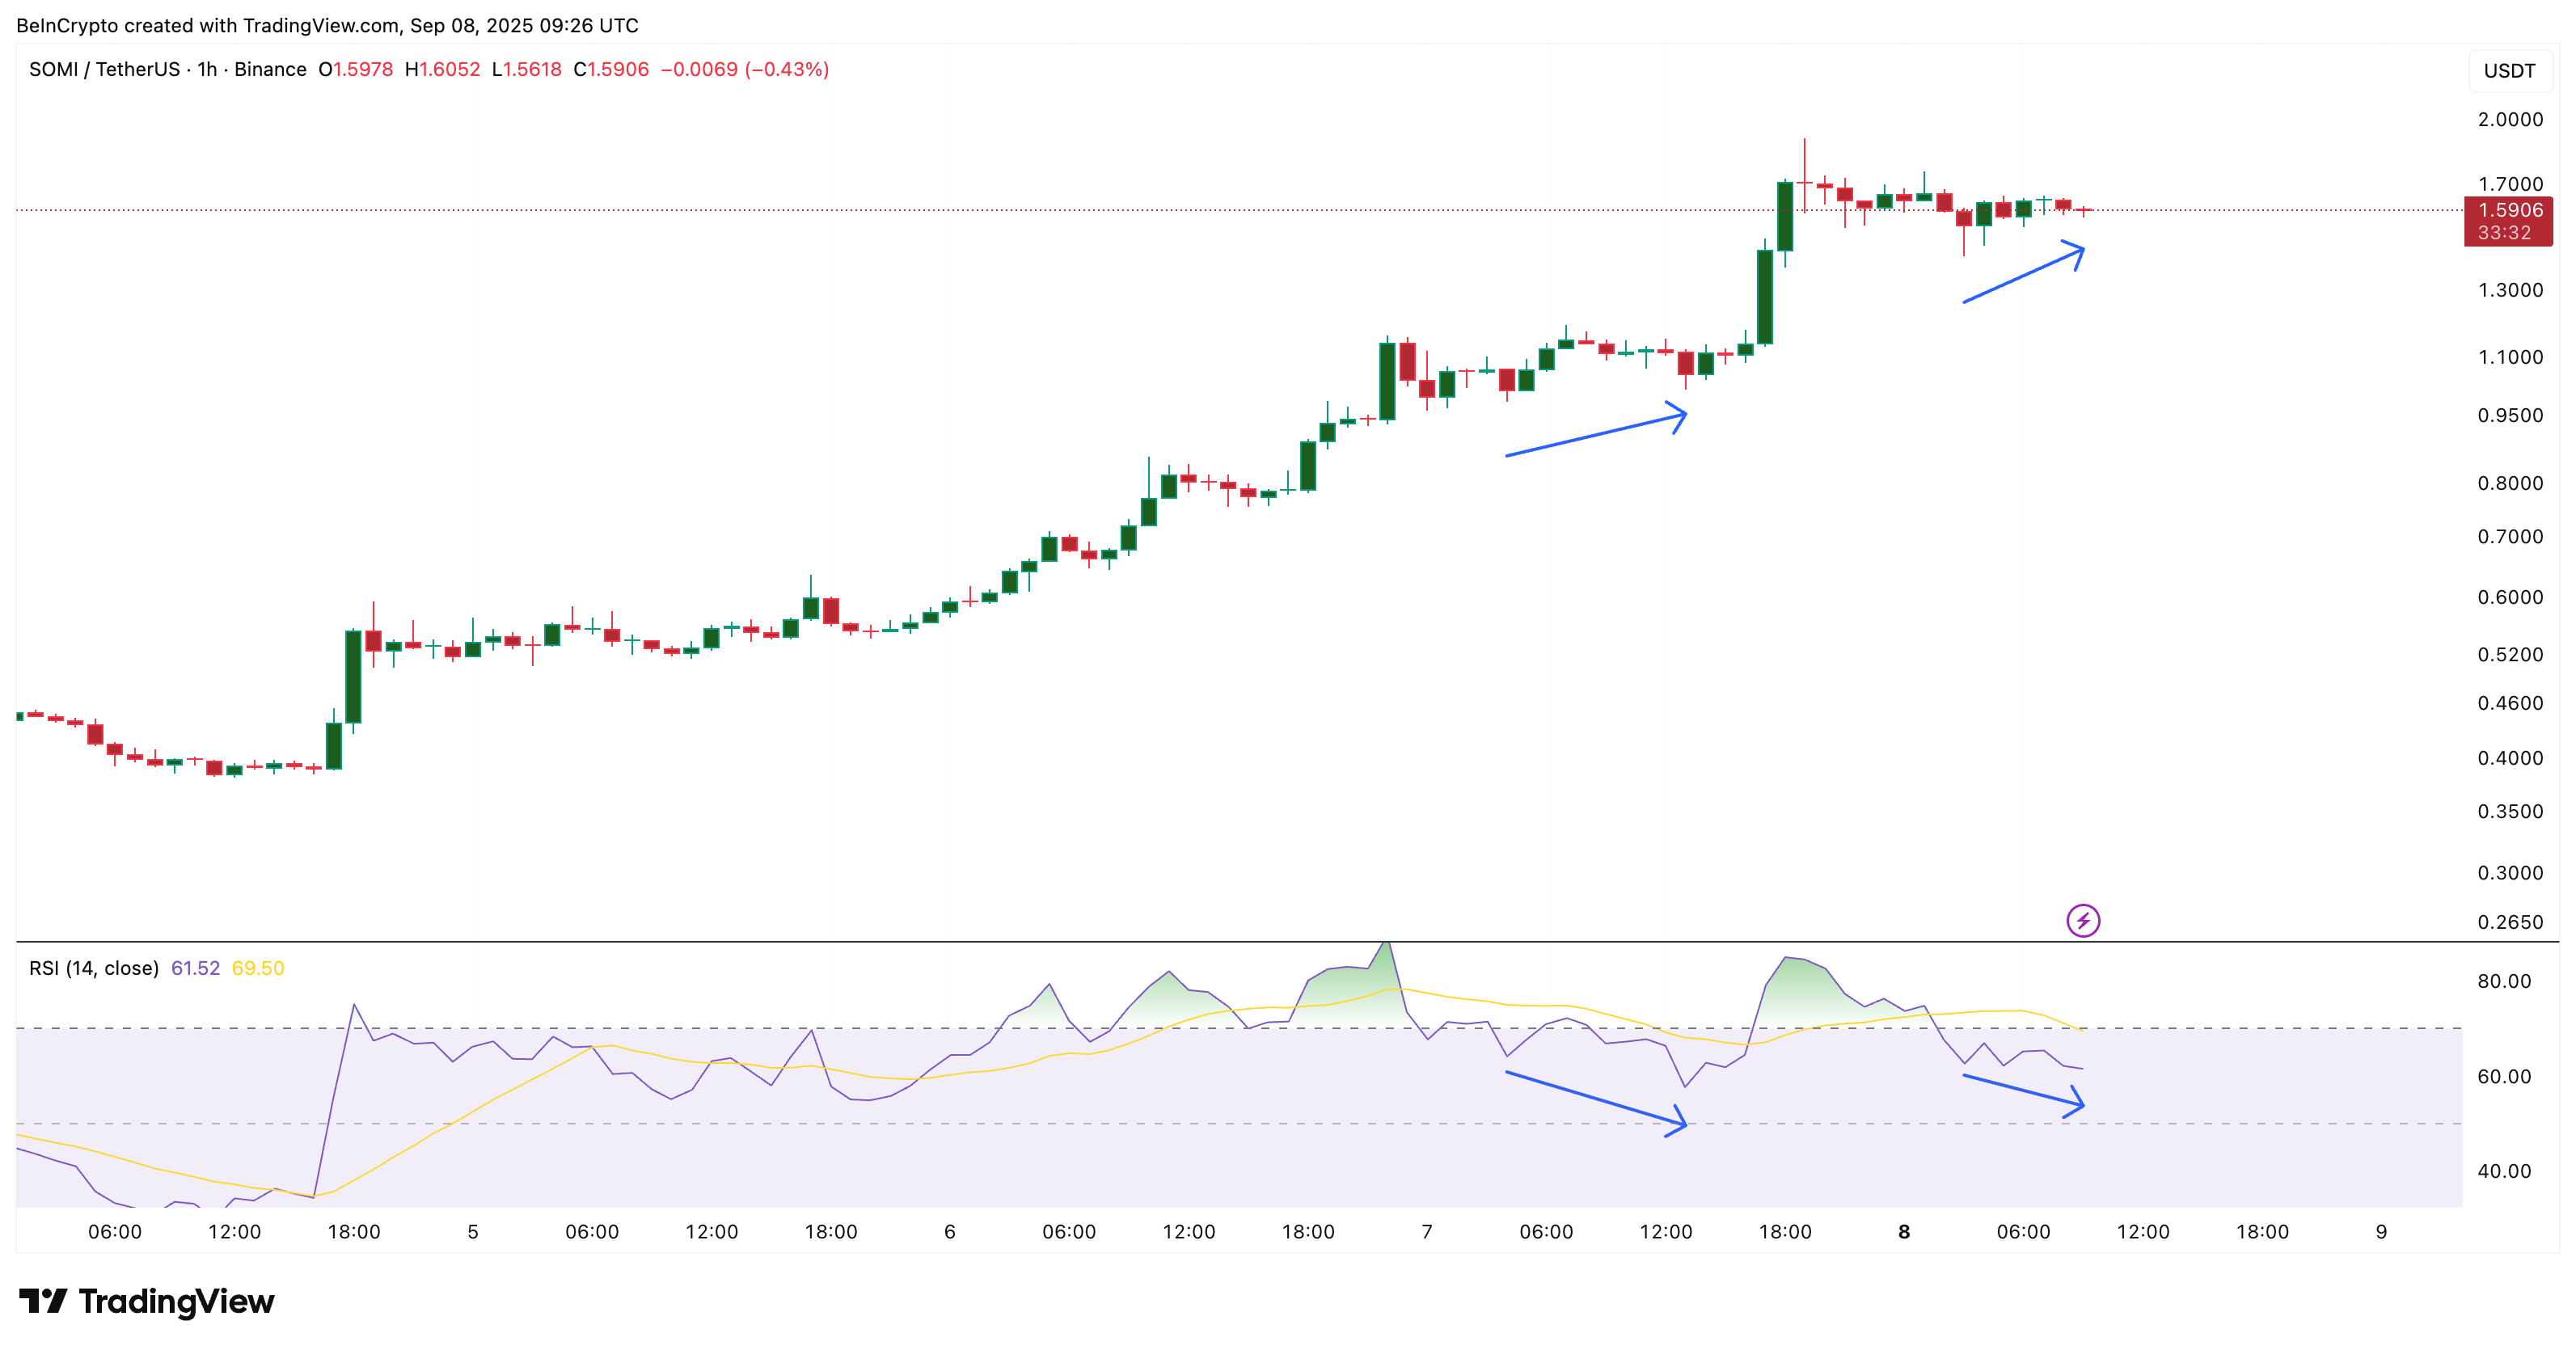
On Somnia’s 1-hour chart, the same setup that appeared before its last big rally has surfaced again. Back when the token traded near $1.10, the price made a higher low while the RSI dipped to a lower low. This mismatch, called a divergence, showed sellers were fading. What followed was a surge from $1.10 to $1.84 — nearly 70% gains.
That same signal has now returned. The Somnia price has held a higher low, while the RSI has continued to slide lower. This often suggests hidden strength, with buyers quietly taking over.
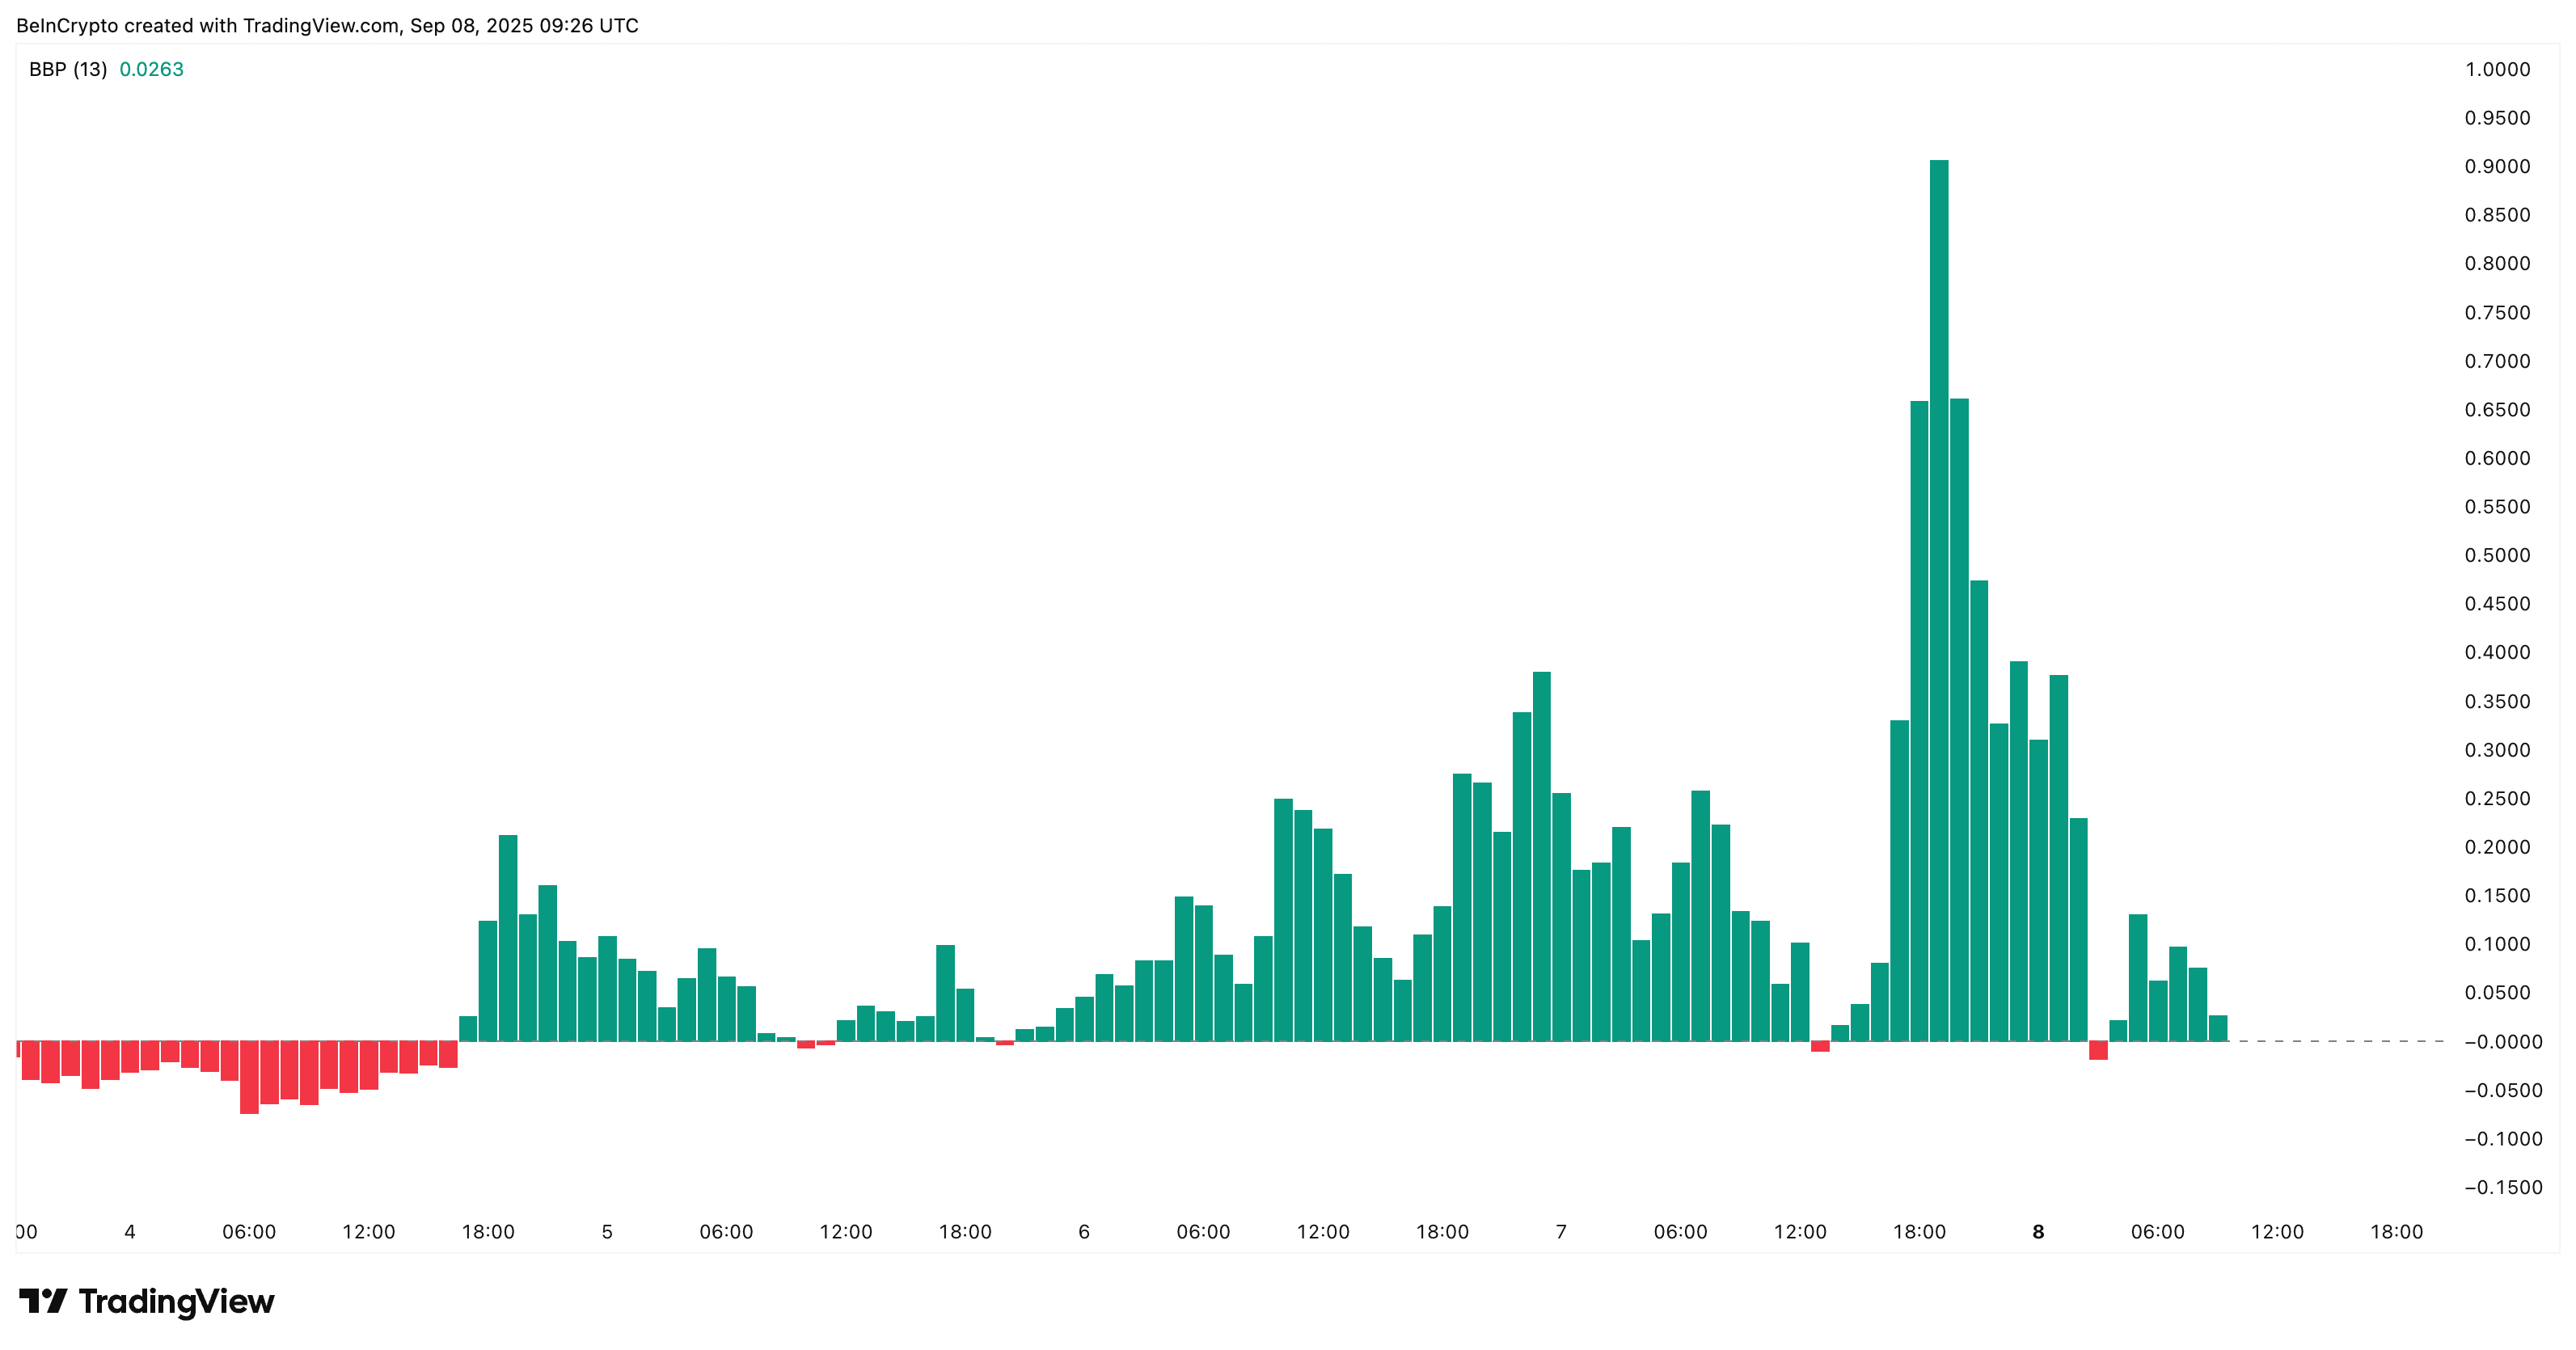
Supporting this case, the bull-bear power indicator — which compares buyer pressure against seller pressure — is still positive. Even with the recent pullback, buyers are stronger than sellers, giving weight to another possible breakout.
Somnia Price Levels And Inflows Line Up For A Breakout
Because Somnia is a new token, it has little trading history. That’s why traders use Fibonacci extensions of earlier moves to project possible targets. Here’s how the setup looks now:
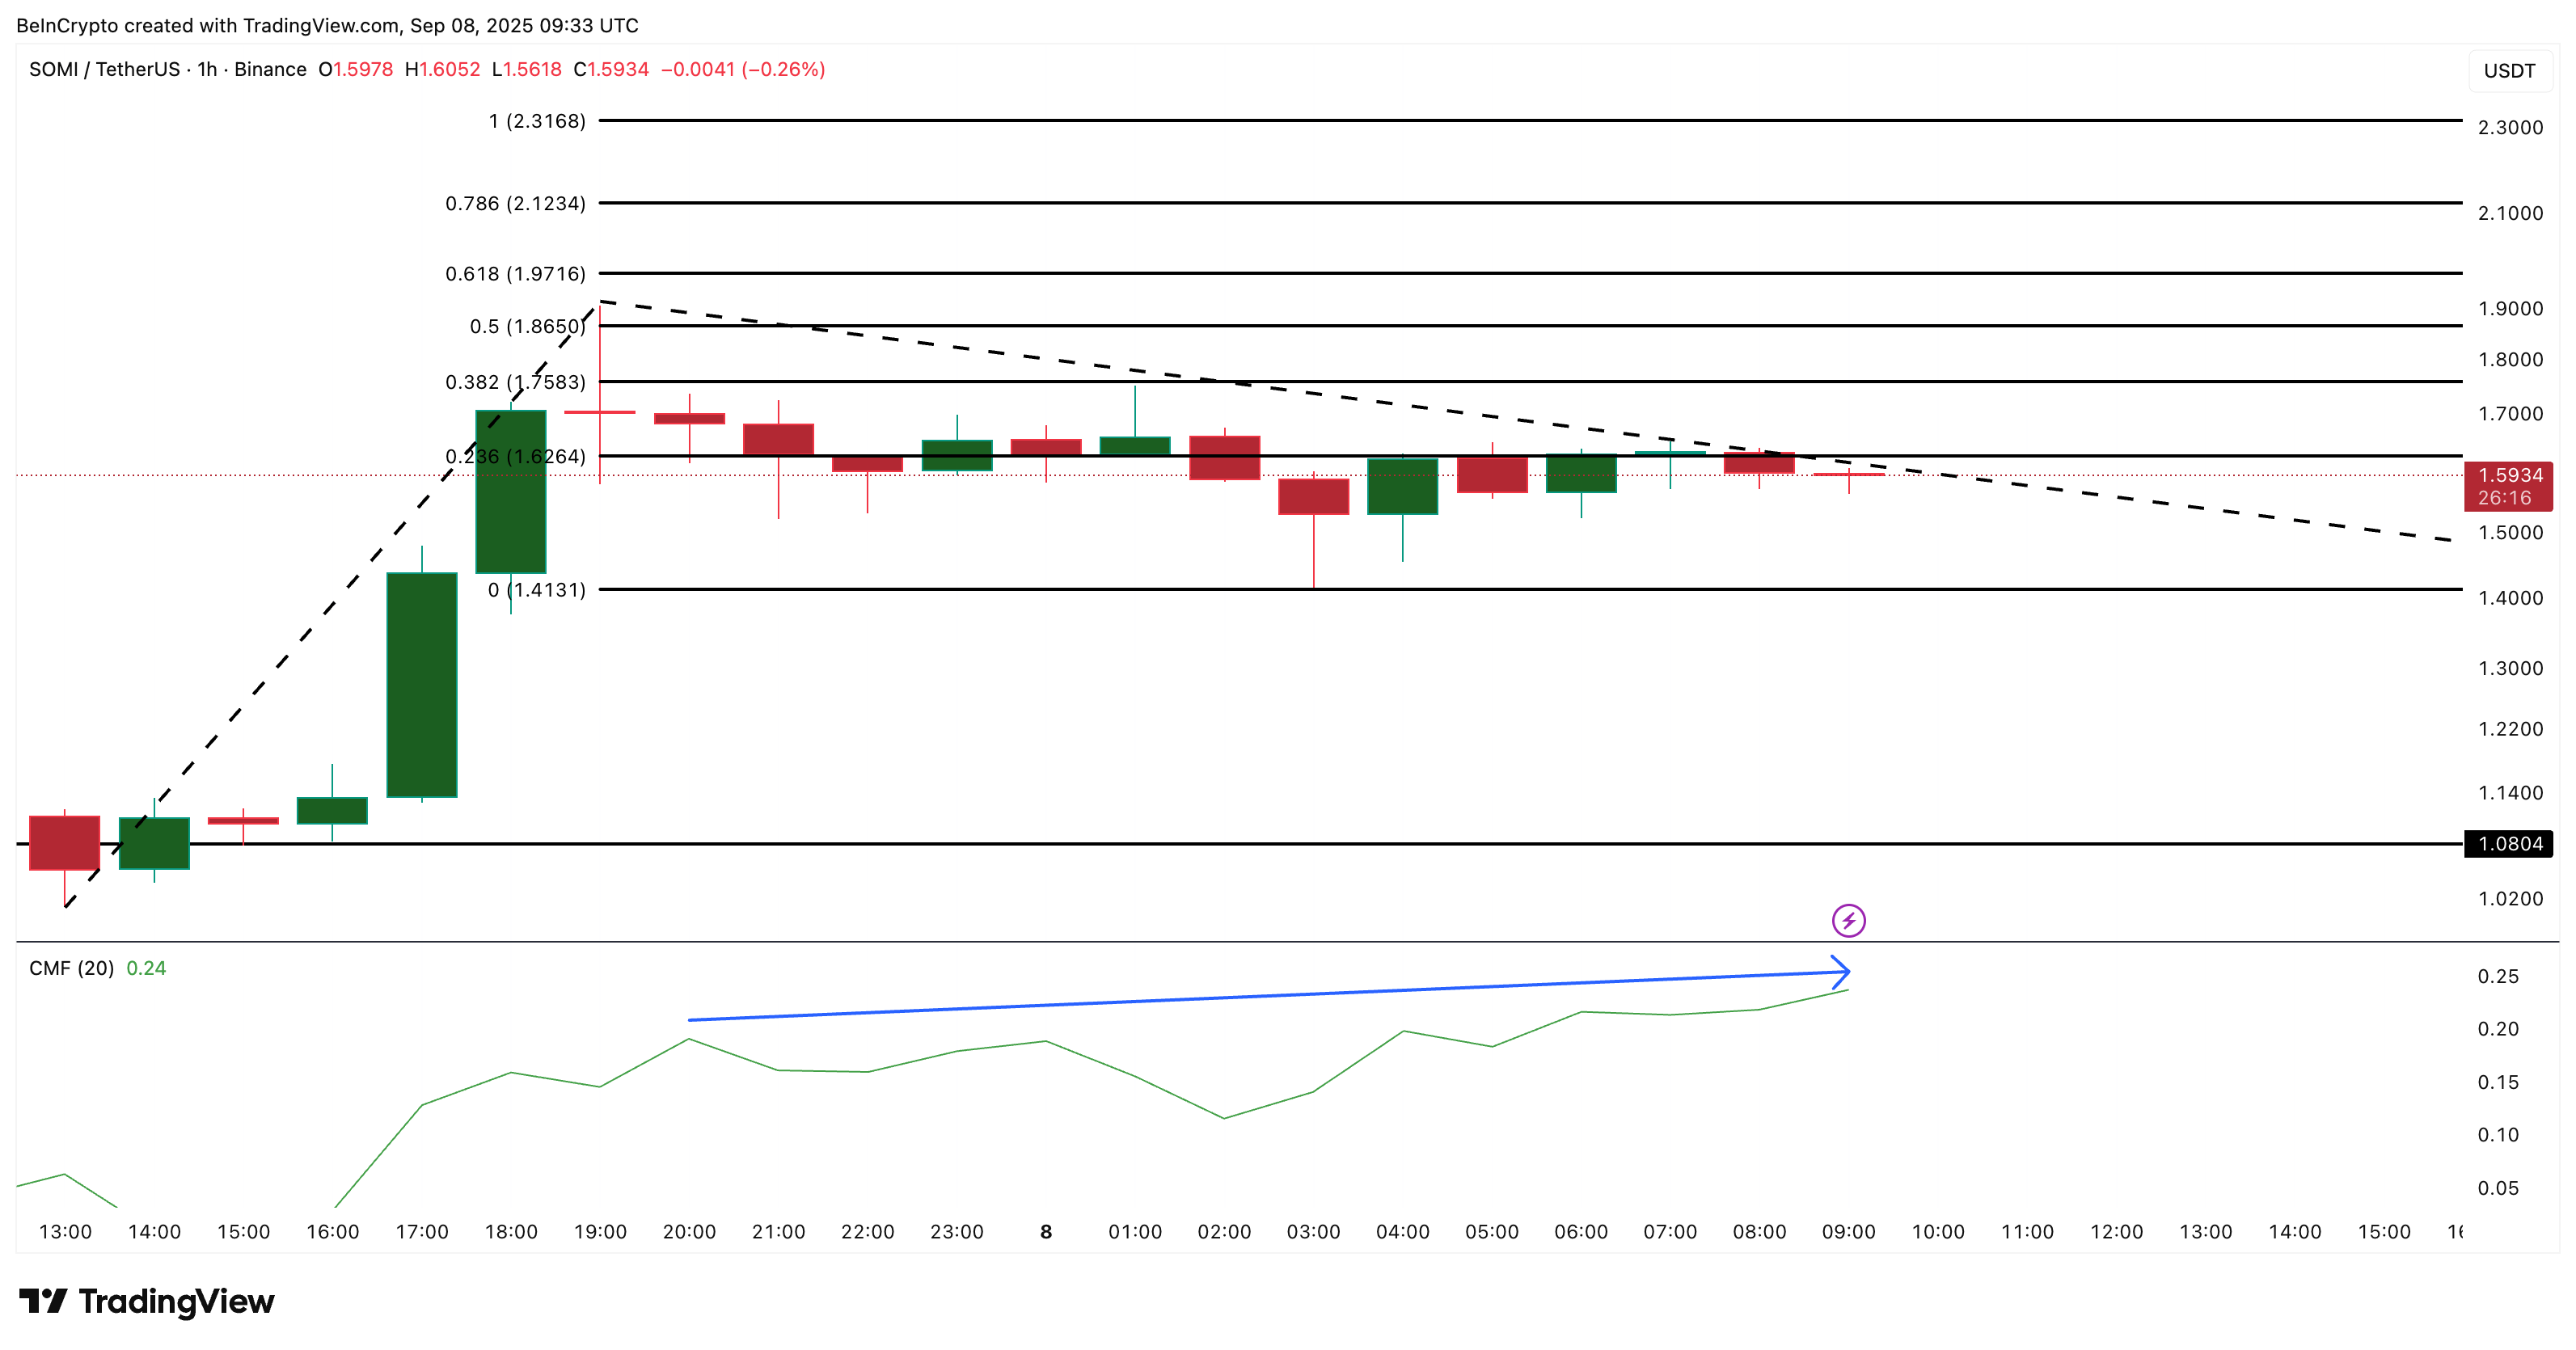
- The first hurdle is $1.62, just above the current $1.59 level.
- If cleared, the next test is $1.86, close to the last high. That would again put SOMI in the price discovery category.
- Beyond that, projections point to $2.12 and then $2.31.
A move from $1.59 to $2.32 would be a rally of almost 46%.
Steady inflows highlighted on the 1-hour chart confirm this price map. The Chaikin Money Flow (CMF) tracks whether money is entering or leaving a token. As long as CMF stays above zero, it shows that money is flowing in. Even during the correction from $1.84 to $1.59, the CMF continued to move higher. That means large wallets continued to buy during the dip, keeping demand alive.
However, a dip under $1.41 would invalidate this short-term bullish hypothesis. If that happens, the SOMI price could even correct to $1.08 in the absence of strong technical support levels.
When both price levels and inflows point in the same direction, it often means a pullback is not weakness but a reset; a catapult-like setup for the next rally.
