


Solana (SOL) has reached a crucial diagonal and horizontal support level. Whether it bounces above it or breaks down will likely determine the direction of the next move.
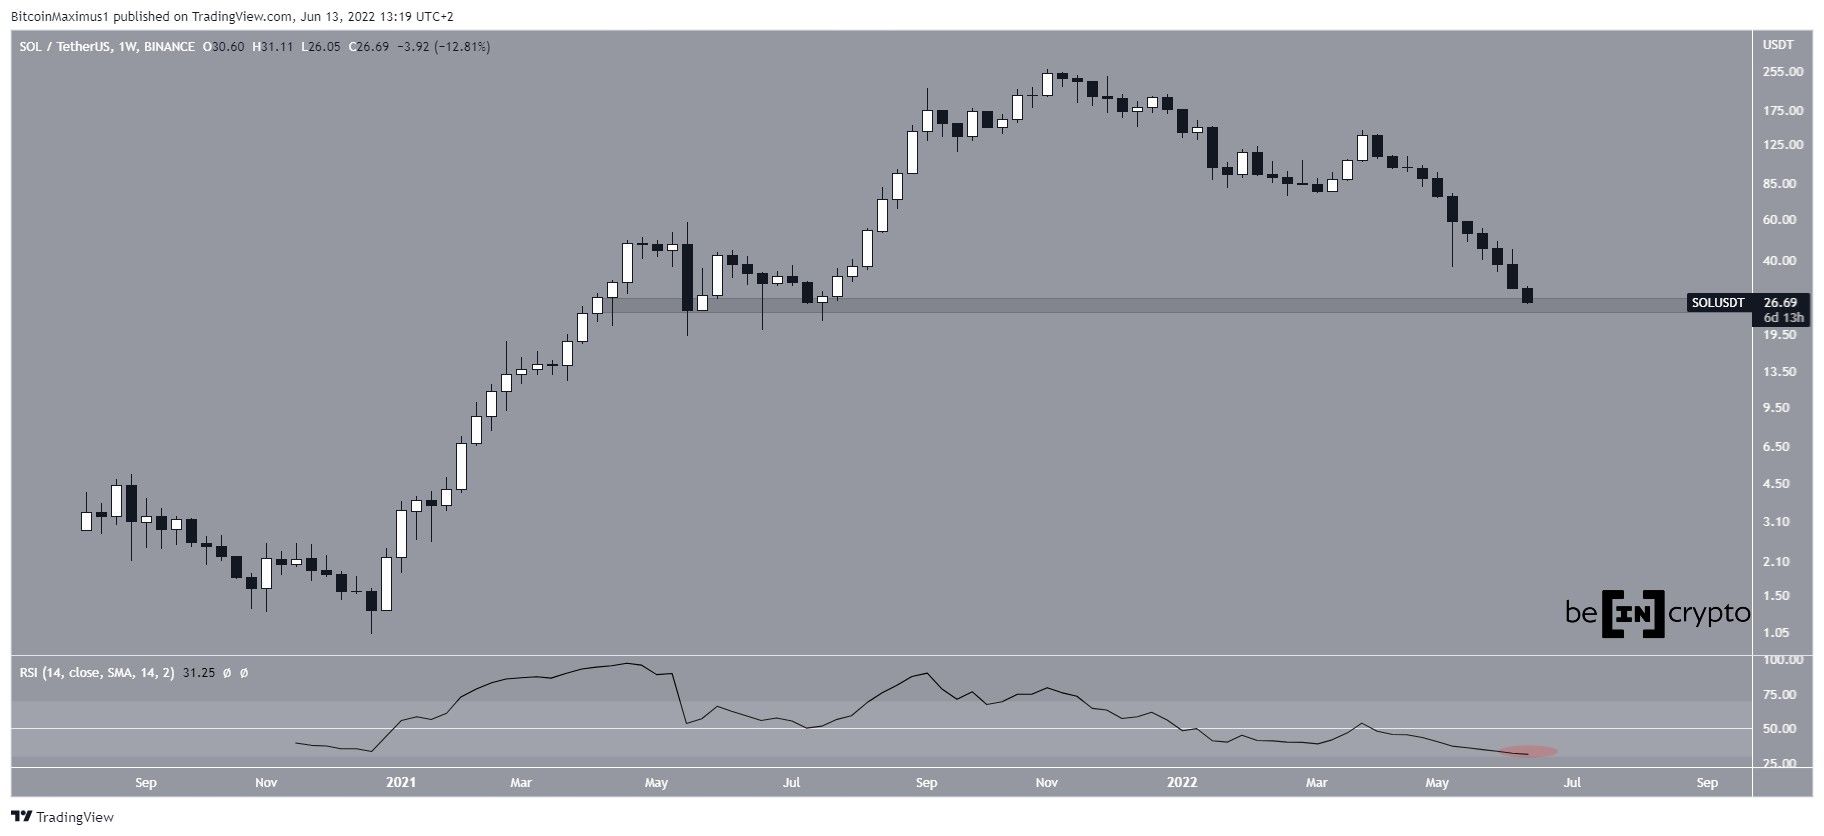
SOL has been falling since reaching an all-time high price of $259.90 in Nov. 2021. The downward movement has so far led to a low of $26.05 on June 13, 2022. Measuring from the all-time high, this is a decrease of 90%.
There is a long-term support level between $25-26. The area previously acted as support between May-Sept 2021, initiating the upward movement (green icons) towards the all-time high.
Even though there is no bullish divergence in place, the weekly RSI has fallen to an all-time low of 31 (red circle). Such low values are often reached close to the bottom of a long-term correction.
Short-term movement
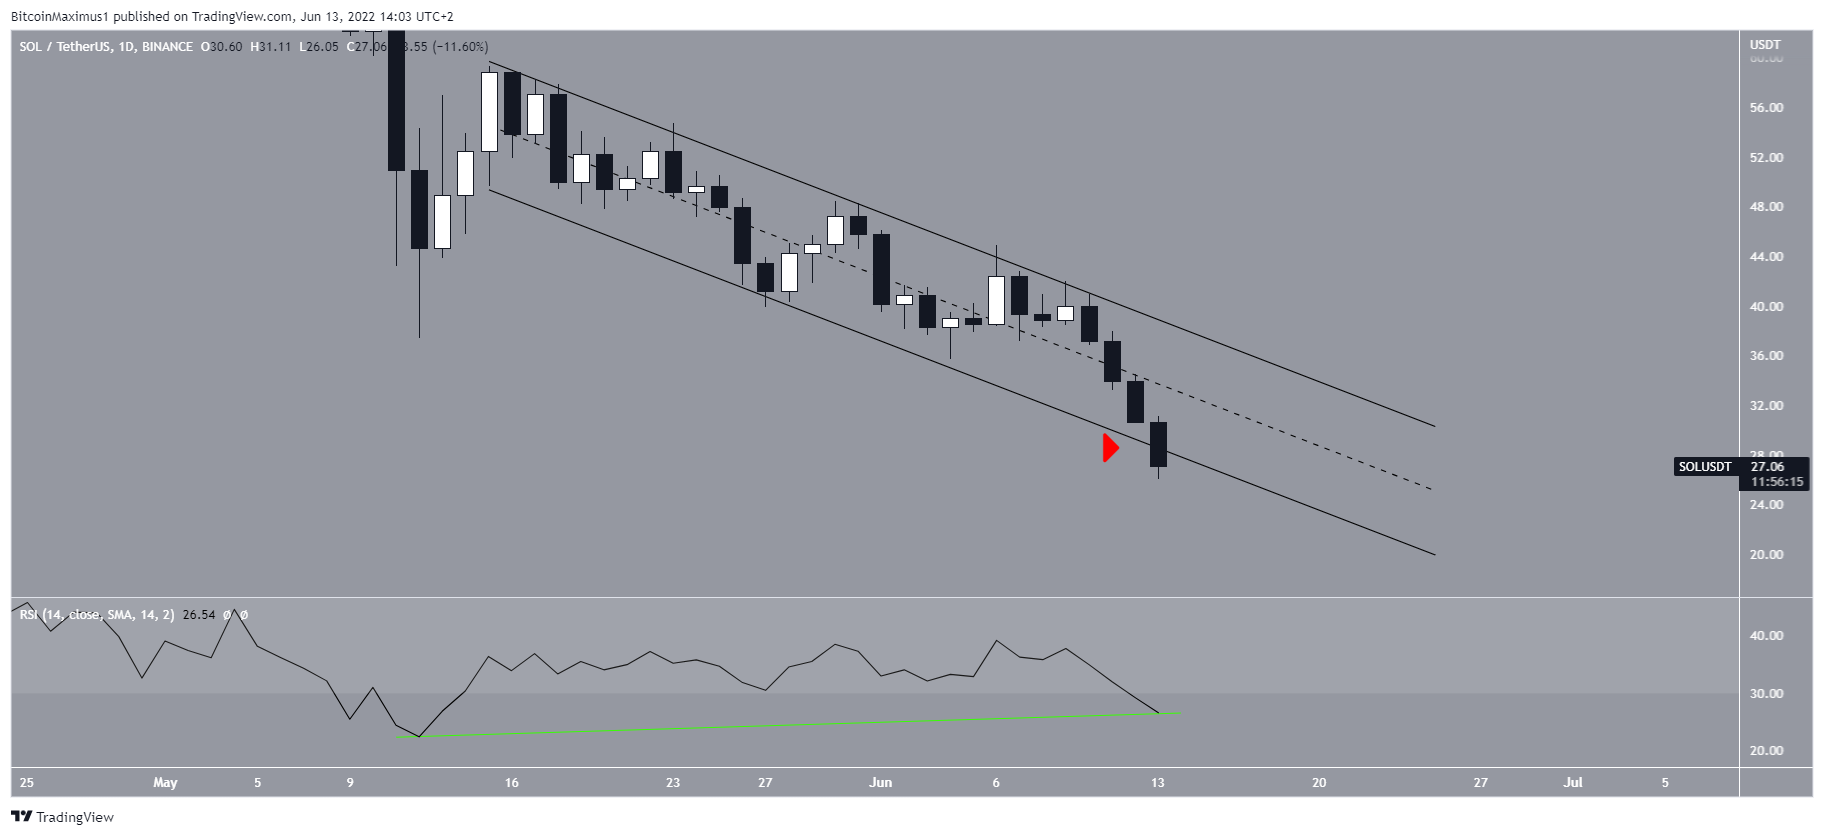
The daily chart shows that SOL has been falling inside a descending parallel channel since May 16. Such channels usually contain corrective movements, meaning that an eventual breakout from it would be likely.
However, the price is currently in the process of breaking down from the channel (red icon). This would be a bearish sign that would suggest lower prices are on the horizon.
On the other hand, a bounce and daily close above the channel would be a very bullish sign, since, besides the potential breakout, it would also validate a bullish divergence (green line) in the RSI.
SOL wave count analysis
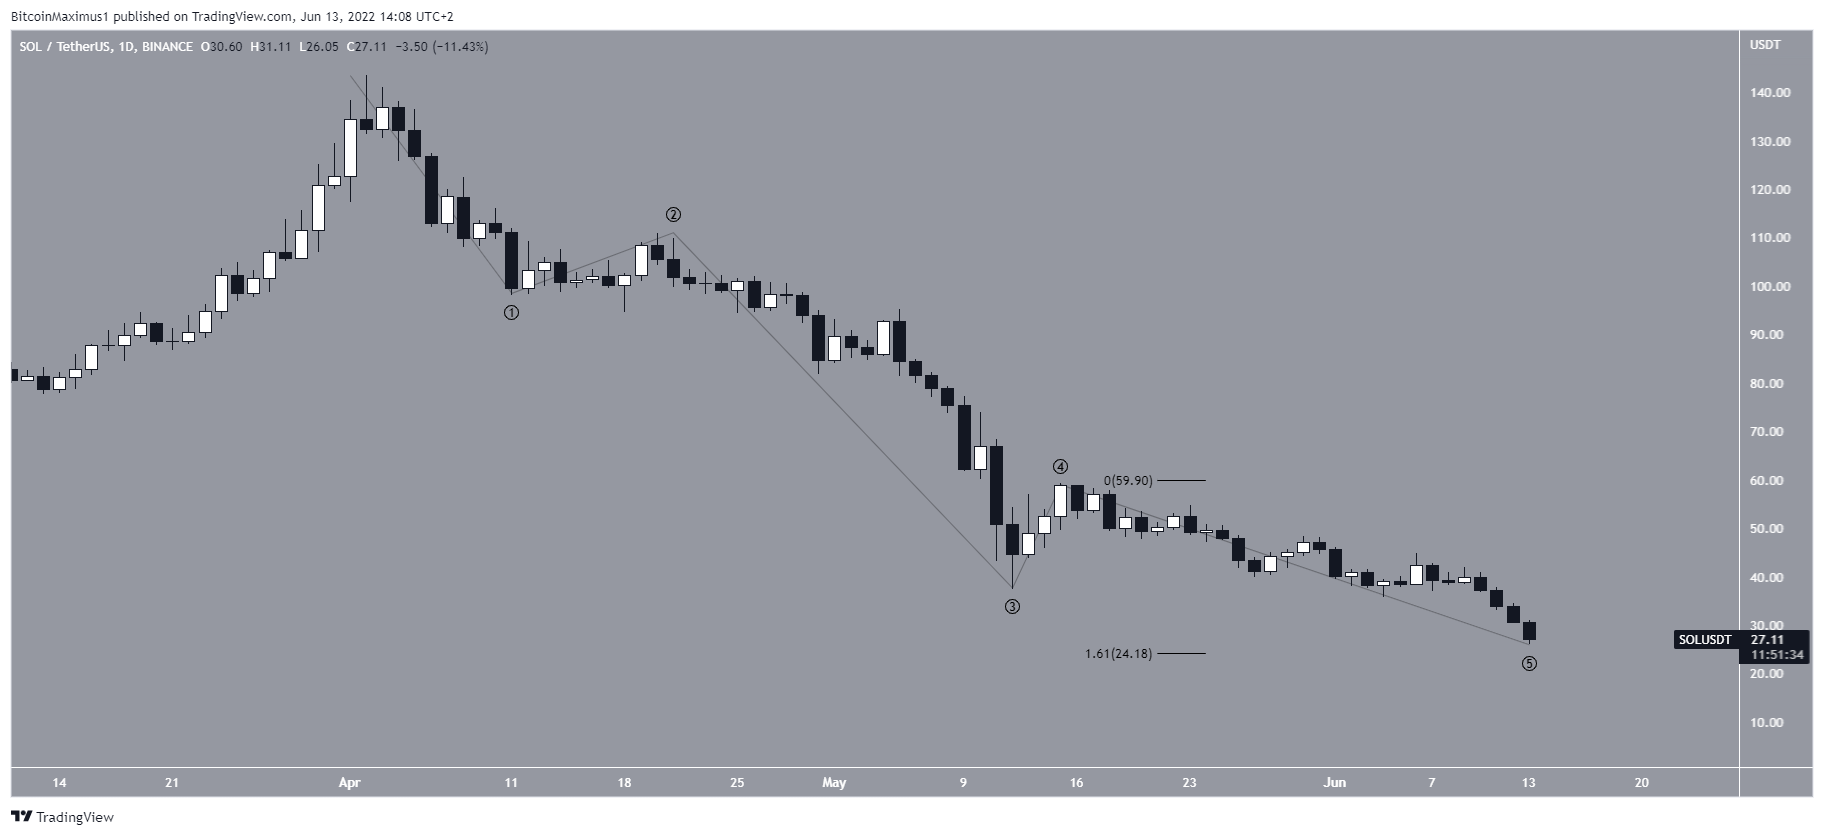
It seems that the decrease since April 2 is a five-wave downward movement. If so, the price is currently in the fifth and final wave.
A potential target for the bottom of this move is at $24. The target is found by using the 1.61 external retracement on wave four, and also coincides with the longer-term support area.
So, it is possible that a bottom will be reached close to this level.
For Be[in]Crypto’s latest bitcoin (BTC) analysis, click here


