

The Solana (SOL) price shows weakness by failing to break out from a long-term resistance line and losing a short-term support line. The continuation of the decrease is the most likely scenario.
SOL is the native token of the Solana blockchain, a smart contract platform created by Anatoly Yakovenko. In the news, the Solana-based lending protocol Everlend Finance announced that it is shutting down. The blockchain project failed due to a lack of liquidity. But Brave Software announced Solana decentralized application (DApp) support in a new partnership.
Solana Fails to Move Above Crucial Resistance
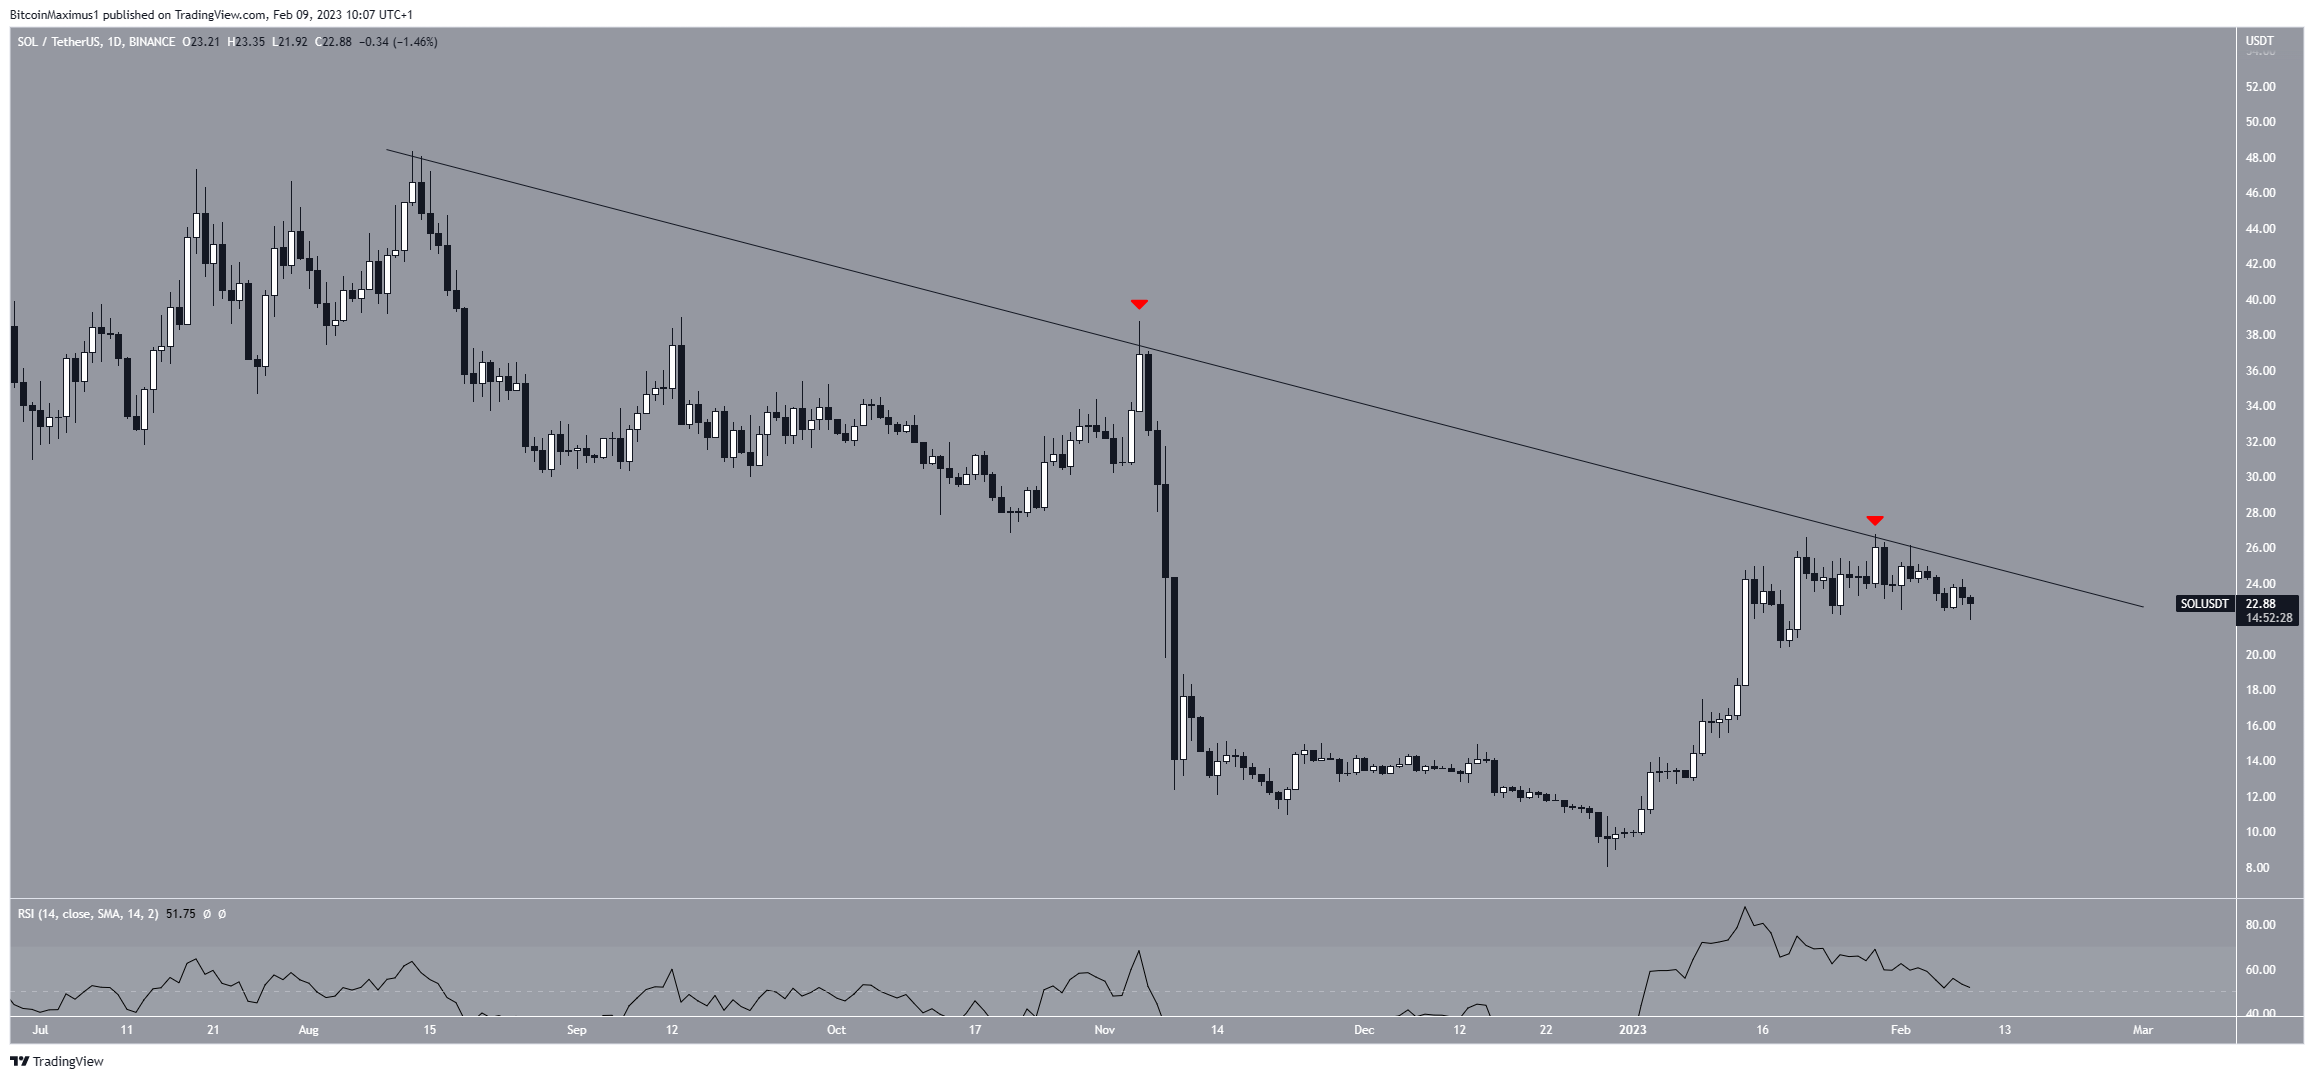
The technical analysis from the daily chart shows that the SOL token price has decreased under a descending resistance line since Aug. 2022. The line has caused numerous rejections (red icons), most recently on Jan. 29. The move initiated the ongoing drop.
The Solana trend is considered bearish unless the price breaks out from the resistance line. A daily RSI drop below 50 would confirm this bearish outlook.
On the other hand, a breakout from the line could lead to highs near $37.
Solana Price Breaks Down
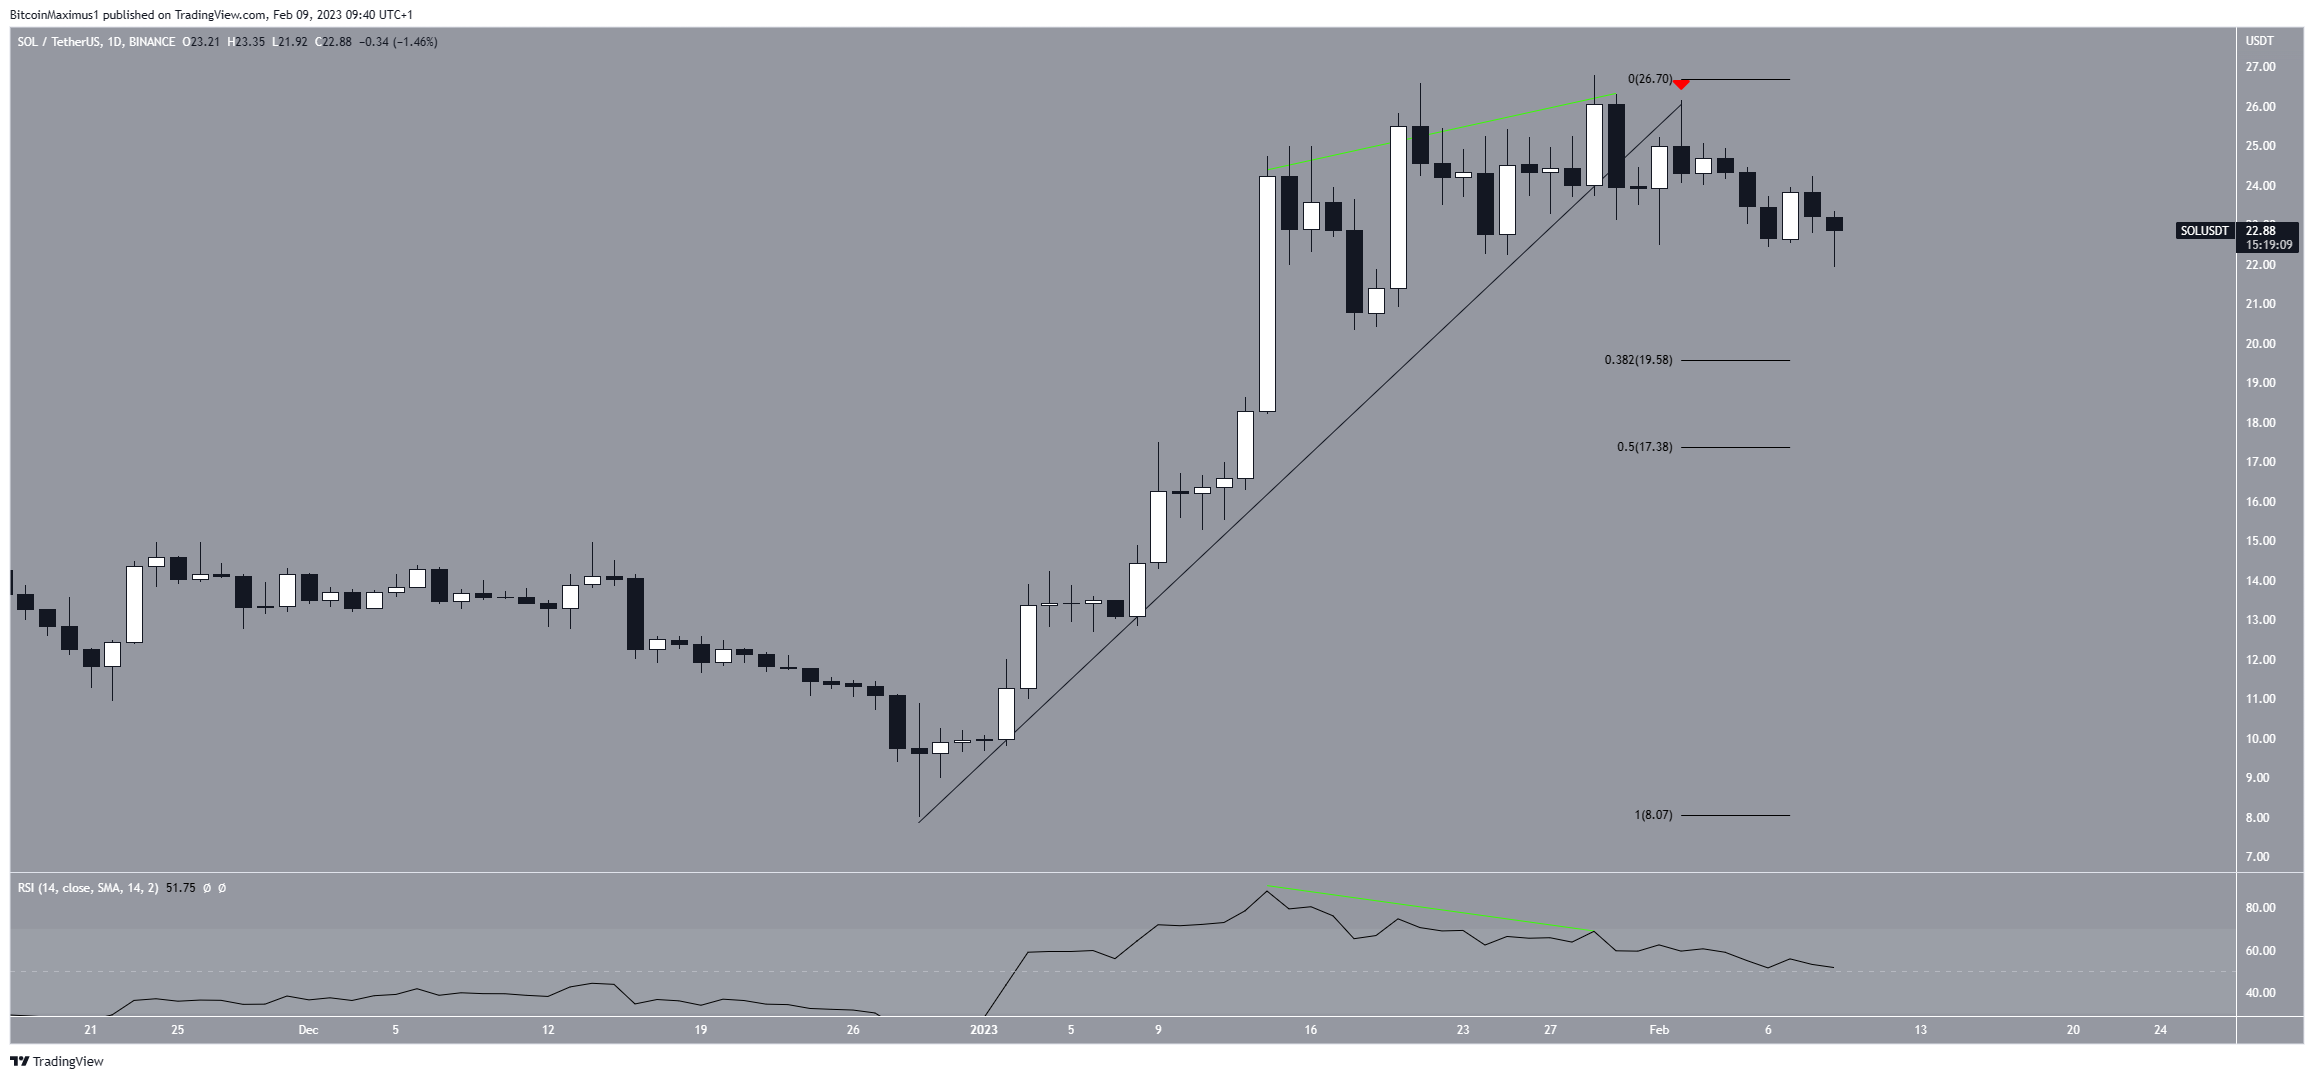
A closer look at the price history this year shows that the Solana price had increased alongside an ascending support line since the beginning of the year. The movement led to a high of $26.80 on Jan. 29.
However, the price broke down after the daily RSI generated bearish divergence (green line). Then, it validated the support line as resistance (red icon) before resuming its downward movement.
If the decrease continues, the closest support levels would be at $19.58 and $17.38, respectively. They are created by the 0.382 and 0.5 Fib retracement support levels, respectively.
On the other hand, an increase above the $26.80 high would invalidate this bearish forecast. In that case, the Solana price would also break out from the long-term descending resistance line. Therefore, it could increase to $37.
To conclude, the most likely Solana price forecast is bearish, leading to a drop toward $19.58. A breakout from the long-term descending resistance line would invalidate this bearish forecast, instead leading to highs near $37.
For BeInCrypto’s latest crypto market analysis, click here.
Disclaimer
In line with the Trust Project guidelines, this price analysis article is for informational purposes only and should not be considered financial or investment advice. BeInCrypto is committed to accurate, unbiased reporting, but market conditions are subject to change without notice. Always conduct your own research and consult with a professional before making any financial decisions. Please note that our Terms and Conditions, Privacy Policy, and Disclaimers have been updated.
