
Solana (SOL) is at risk of breaking down from a crucial long-term support level but is trading inside a short-term bullish pattern.
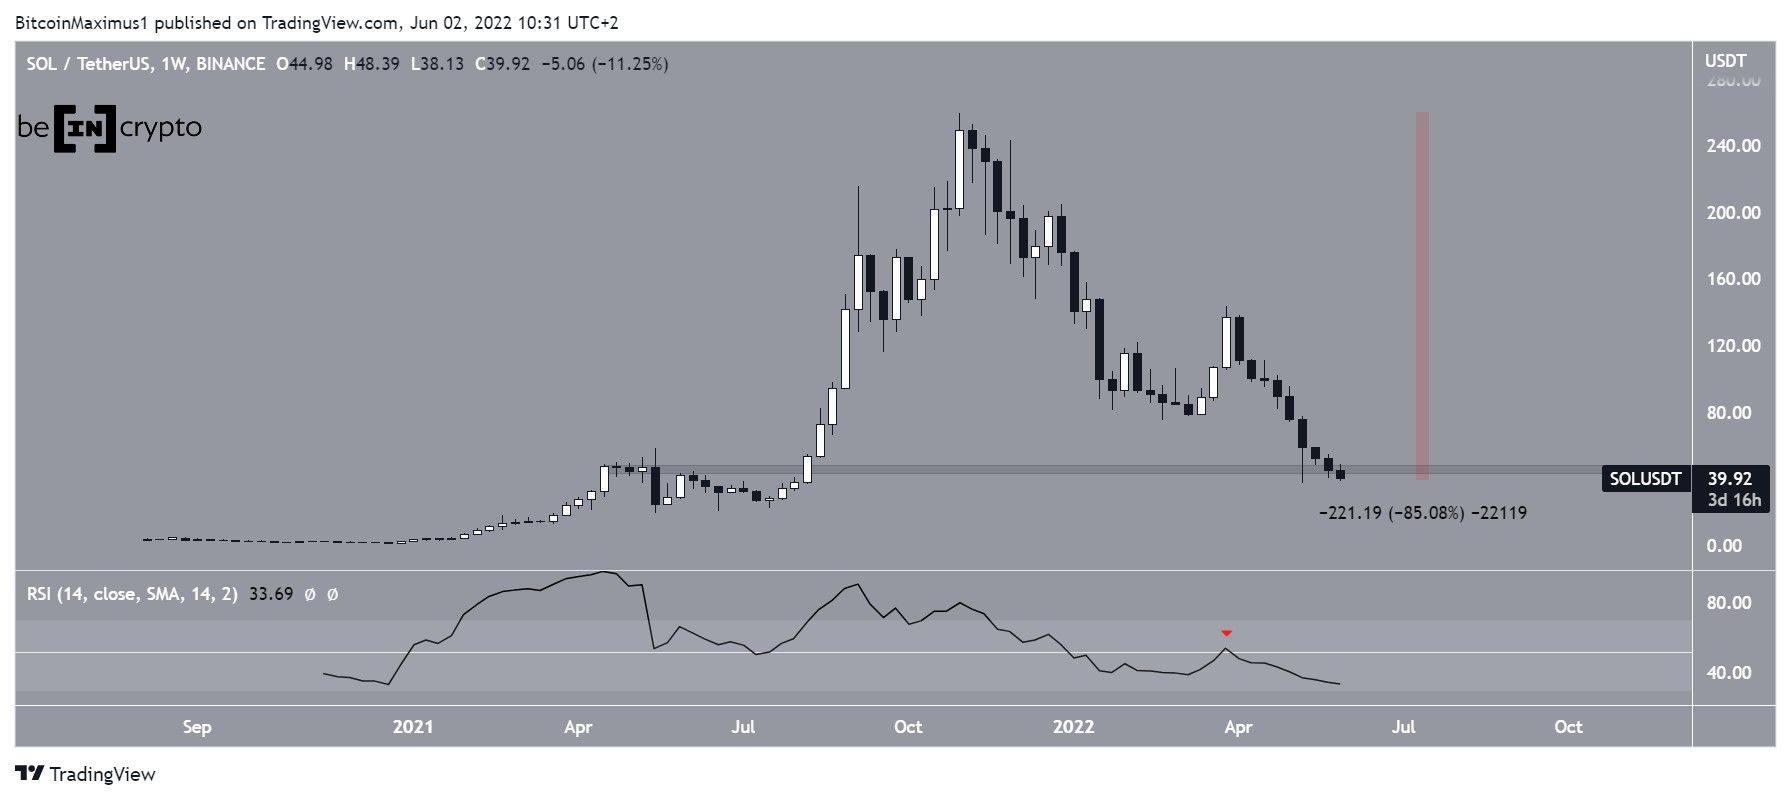
SOL has been falling since reaching an all-time high price of $258.6 on Nov 6. The price initially bounced in the beginning of March, but has been falling since April 2.
Currently it is in the process of breaking down from the $47 horizontal area, but has yet to reach a close below it. This is a crucial area since it previously acted as resistance during the May 2021 old all-time high.
Additionally, the RSI has now fallen below 50, which is considered a sign of a bearish trend. This interpretation supports the possibility that SOL will reach a weekly close below the $47 area.
Measuring from the all-time high, the price has fallen by 85%.
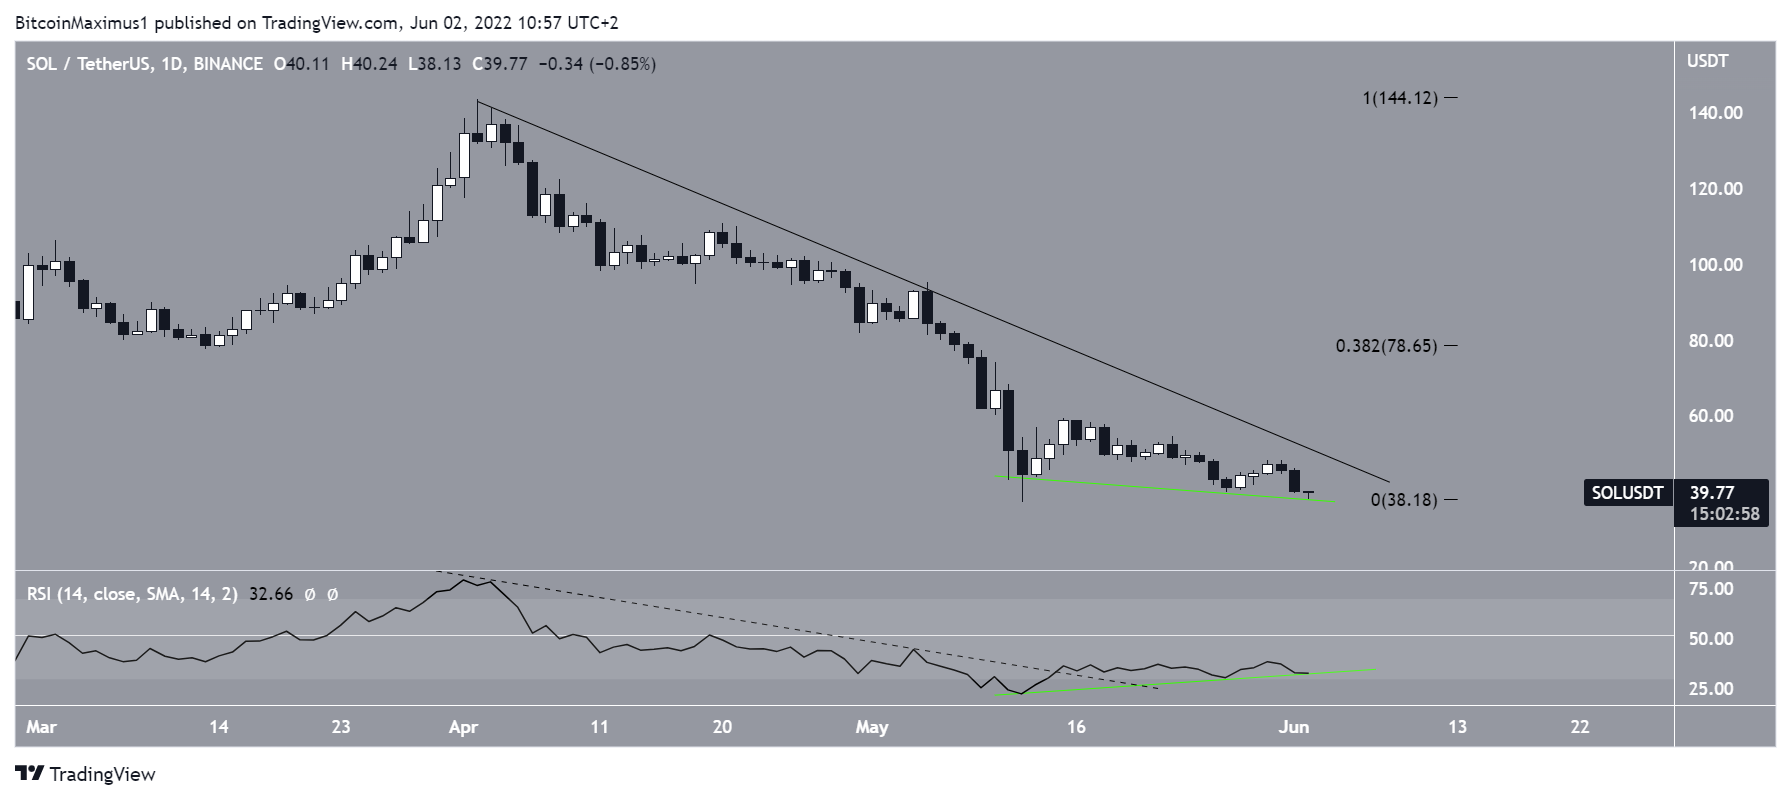
Daily bullish divergences
The daily chart is showing some bullish signs despite the bearishness from the weekly time frame. These are especially visible in the daily RSI, which has generated bullish divergence (green line). Furthermore, the RSI has already broken out from a descending resistance line, which had previously been in place since April (dashed).
However, SOL is still following a descending resistance line. It remains to be seen if it will follow the lead of the RSI and break out. In that case, the next closest resistance would be at $78.65. This is the 0.382 Fib retracement resistance level.
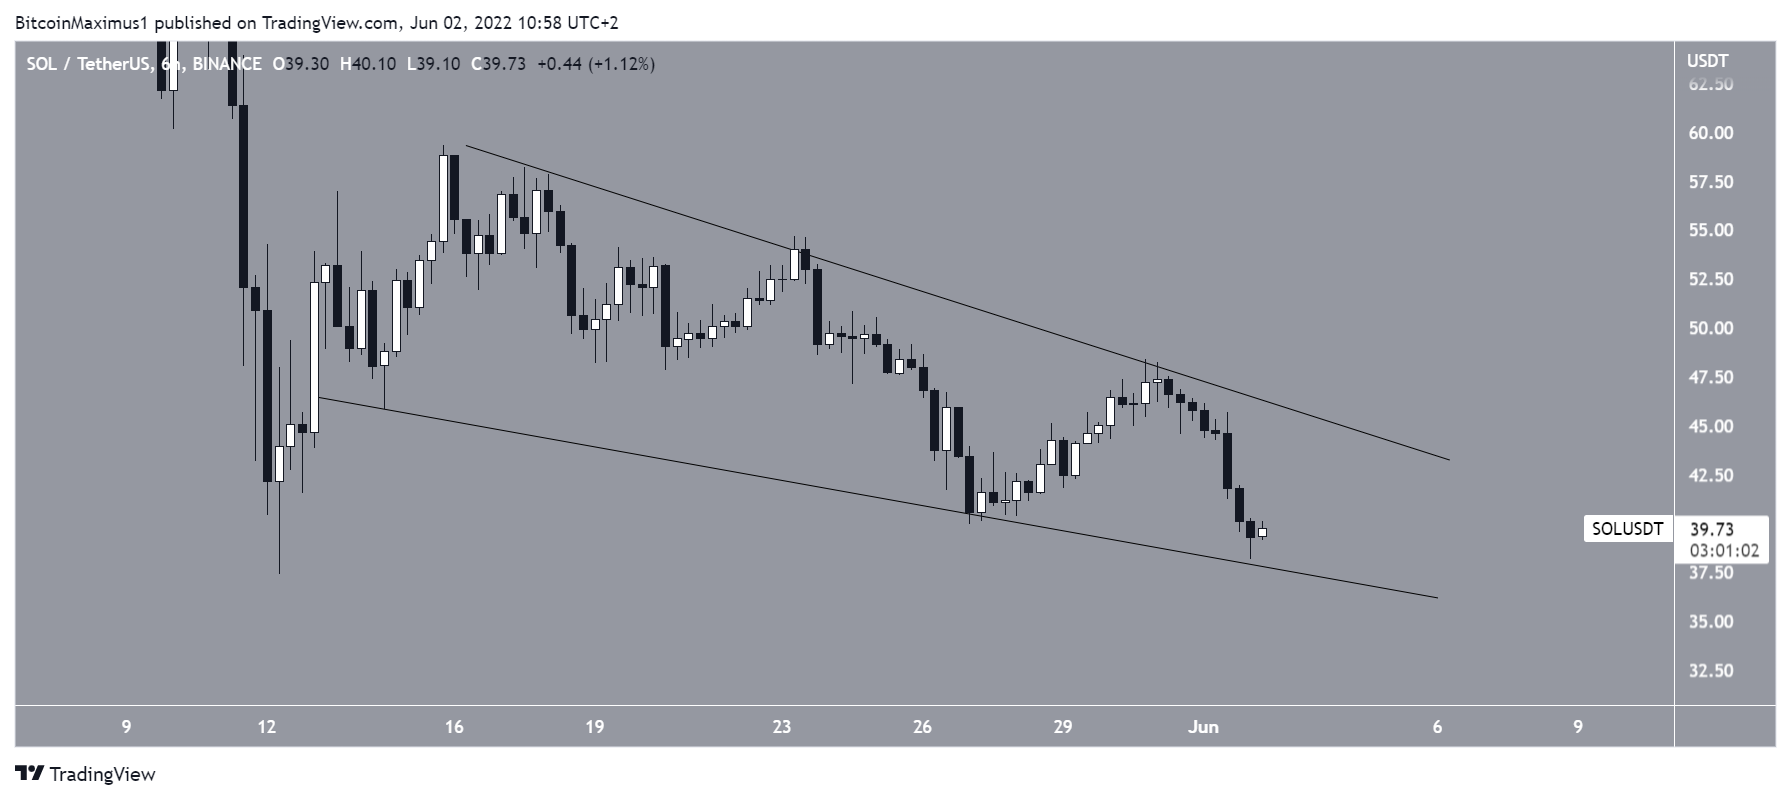
Short-term SOL wedge
Furthermore, the six-hour chart shows that SOL is trading inside a descending wedge. This is considered a bullish reversal pattern, indicating that a breakout from it would be expected.
So, this aligns with the daily time frame, suggesting that an eventual breakout is likely.
Despite this, the direction of the longer-term trend remains uncertain.
For Be[in]Crypto’s latest bitcoin (BTC) analysis, click here
