


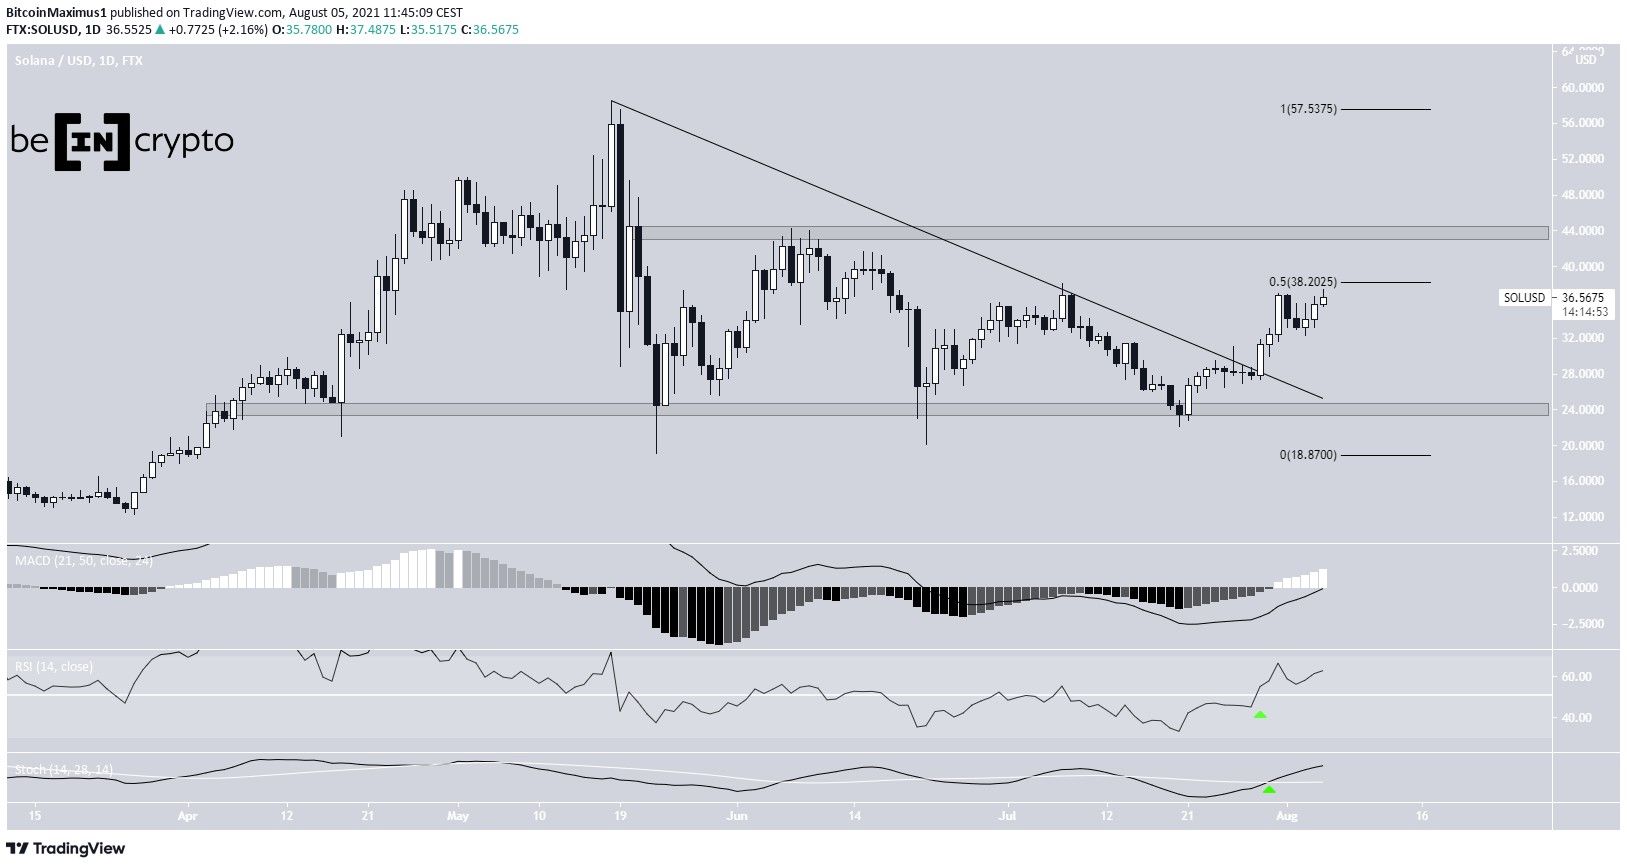
Solana (SOL) bounced at the $24 support area on July 20 and broke out from a descending resistance line nine days later.
It’s now approaching a crucial resistance level near $38.50 which could determine the direction of the longer-term trend.
SOL breaks out
SOL has been increasing since bouncing at the $24 horizontal support area on July 20. On July 29, it broke out from a descending resistance line that had been in place since the May 18 all-time high.
This led to a high of $37 on July 31, close to the $38.50 resistance area, which is also the 0.5 Fib retracement resistance level. After the rejection, SOL is making another attempt at breaking out.
Technical indicators are bullish. The RSI has just moved above 50 and the MACD has almost crossed into positive territory. Furthermore, the Stochastic oscillator has made a bullish cross (green icon).
The next closest resistance area is found at $43.50.
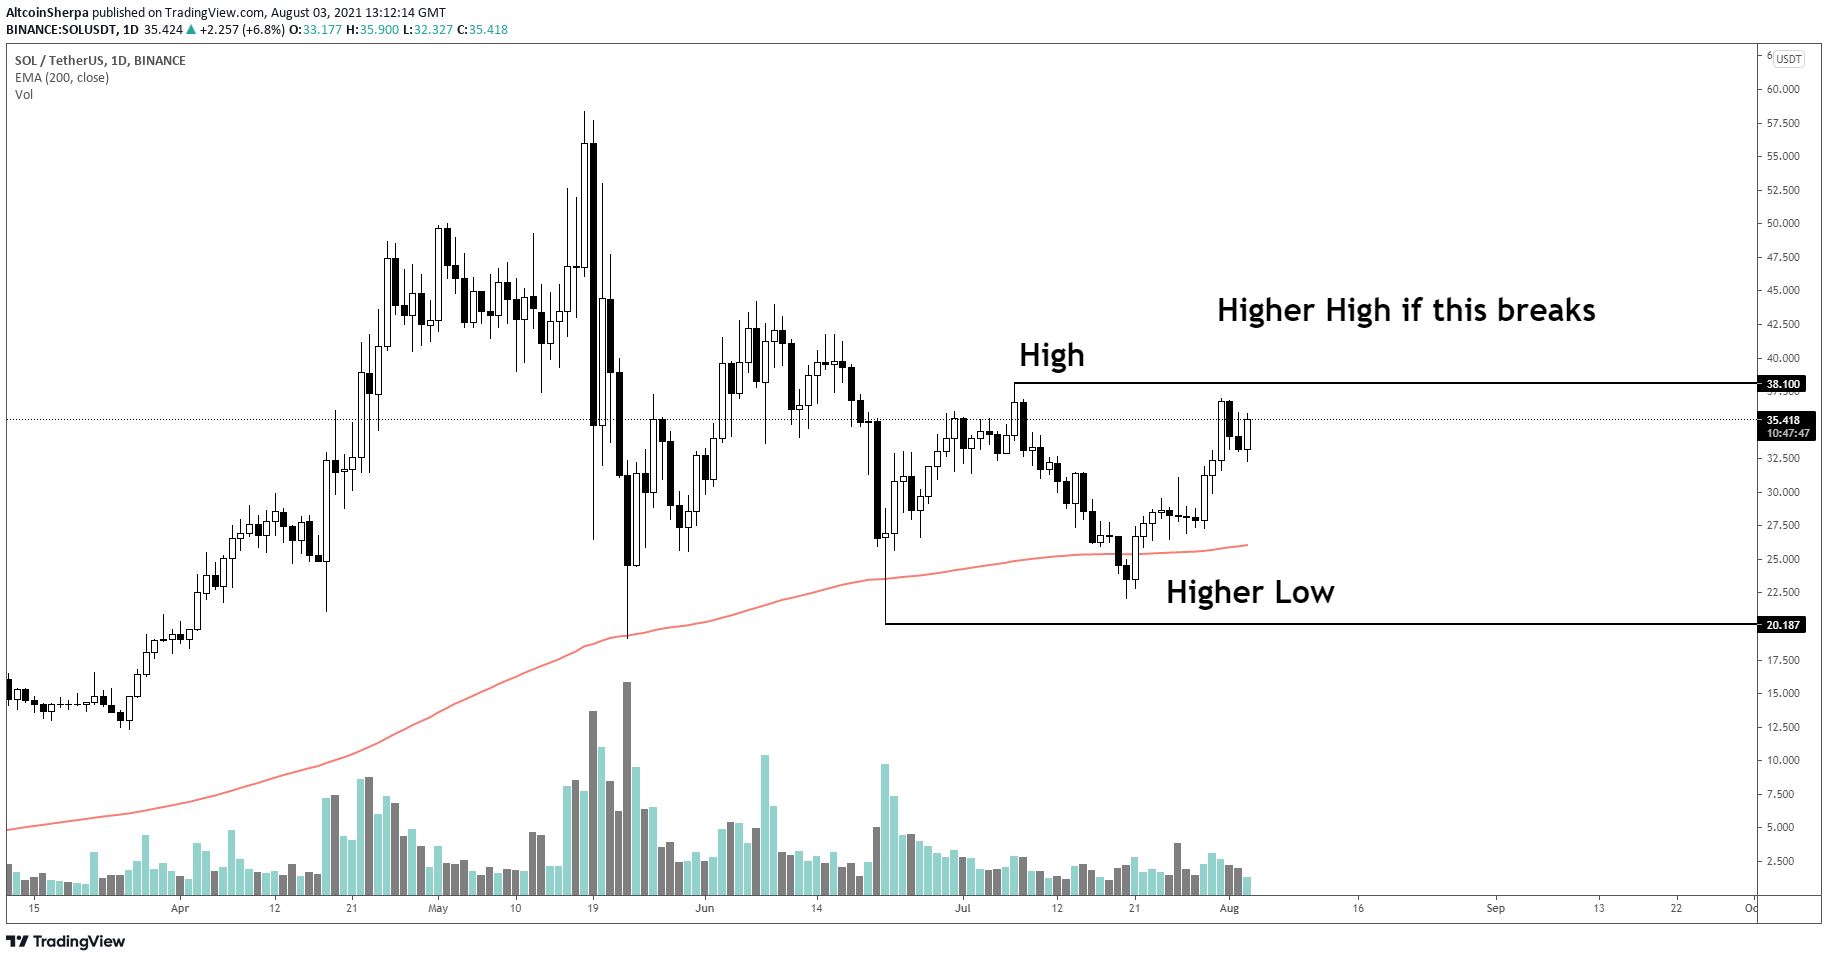
Cryptocurrency trader @Altcoinsherpa outlined a SOL chart, stating that if a higher high is created, it would mark a change in structure from bearish to bullish. The previous high was made at $38.10, and it has yet to move above it.
Future movement
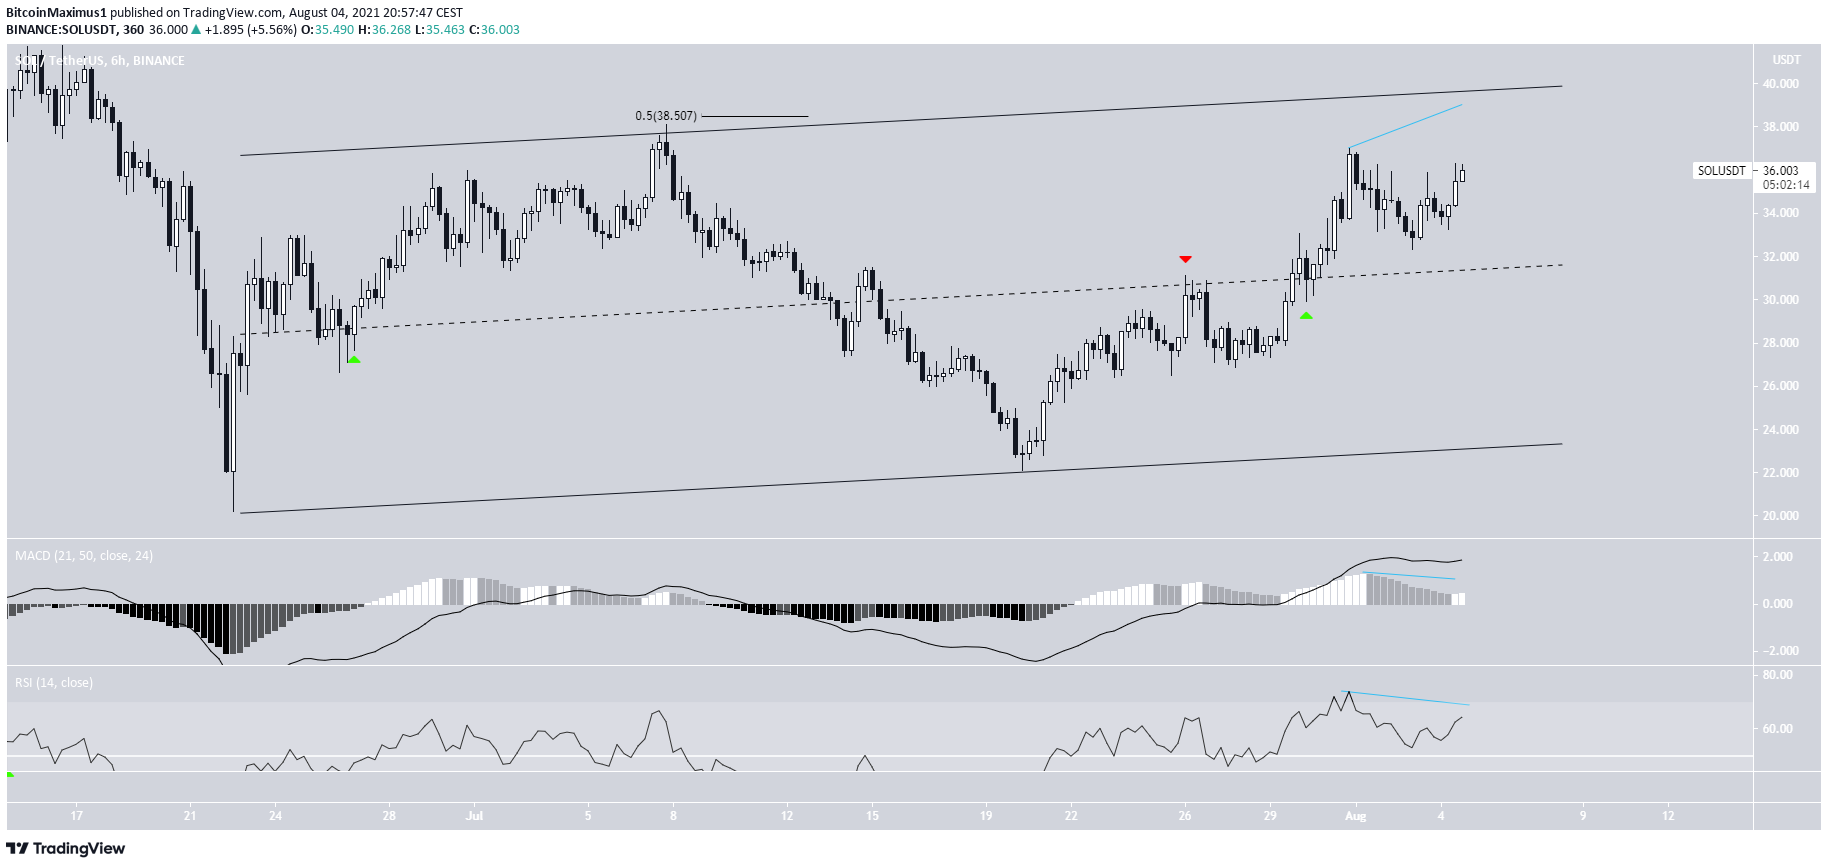
The six-hour chart shows a potential ascending support line in place. While neither the resistance nor support lines have been validated enough times, the midline of the channel has intermittently acted as both resistance and support (red and green icons), giving some legitimacy to the potential pattern.
Currently, SOL is in the upper portion of the channel and approaching the resistance line, which is currently at $38.50. It also coincides with the 0.5 Fib retracement resistance level, as outlined in the previous section.
While there are potential bearish divergences in place, they have not been confirmed yet.
Whether SOL manages to break out over this resistance or gets rejected will go a long way in determining the direction of the future trend.
SOL/BTC
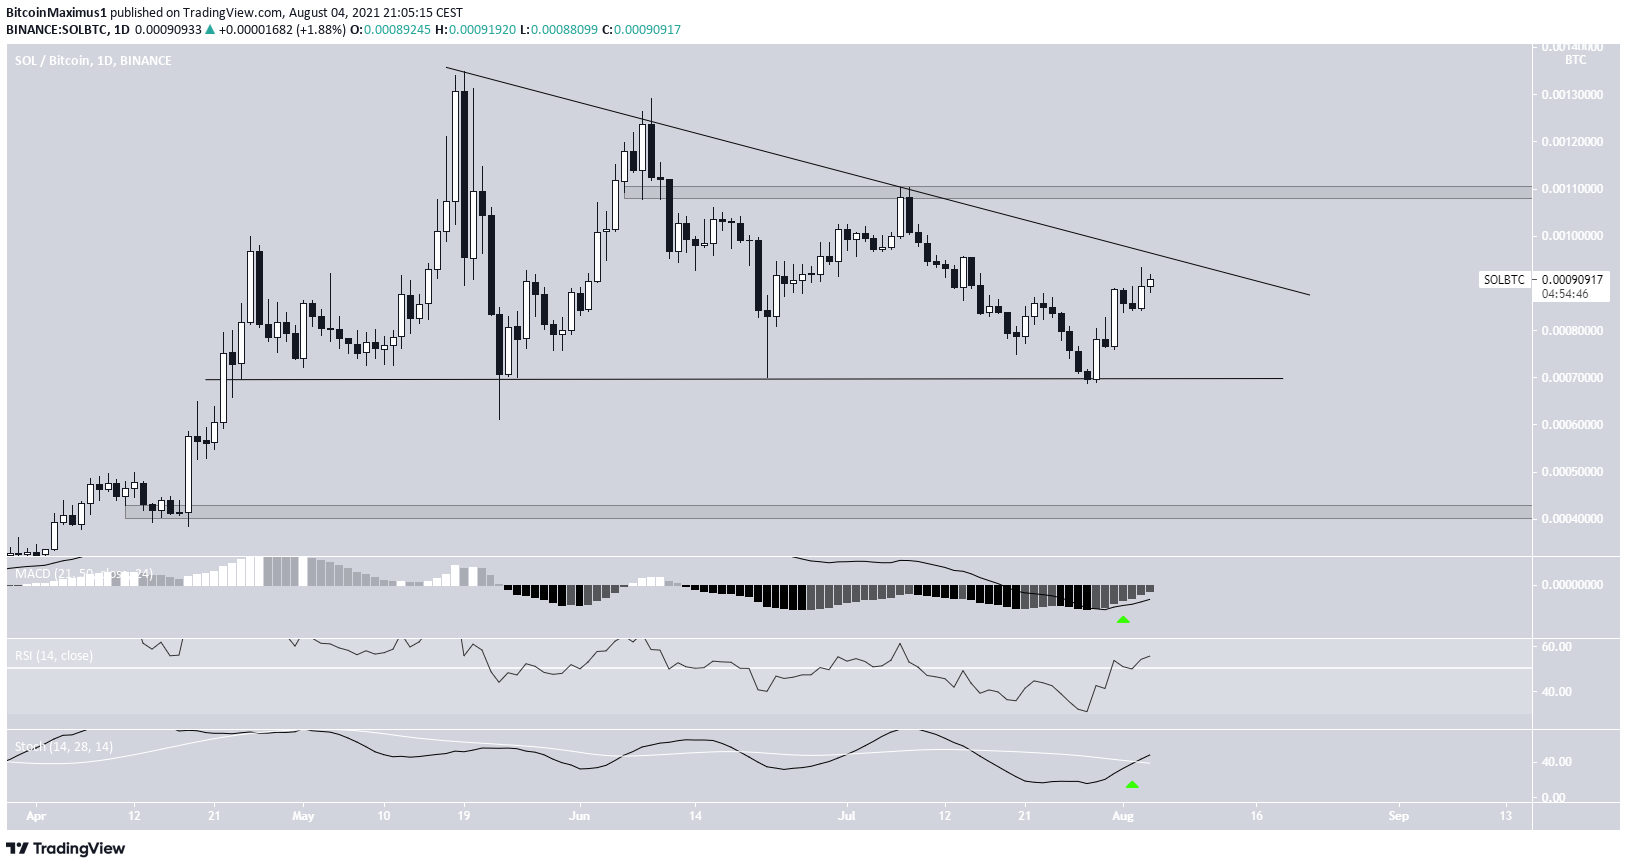
The SOL/BTC chart shows a descending triangle that has been in place since May 19. The descending triangle is normally considered a bearish pattern.
Its support line is found at 70,000 satoshis, which has been validated four times so far, most recently on July 29.
Technical indicators are providing bullish signs, such as the RSI cross above 50 and the bullish cross in the Stochastic oscillator.
However, the trend cannot be considered bullish until a breakout from the triangle transpires. Conversely, a rejection from the line and a return to the 70,000 satoshi support area once more would likely confirm that a breakdown is in the cards.
Outside of the pattern, the closest resistance and support levels are found at 110,000 and 41,500 satoshis.
For BeInCrypto’s latest bitcoin (BTC) analysis, click here.



