


Bitcoin (BTC) reached a high of $42,599 on Aug 1 but fell below the $40,550 range high shortly after.
It regained its footing by creating a bullish engulfing candlestick on Aug 4 and is now making another attempt at reclaiming the level.
BTC approaches range high
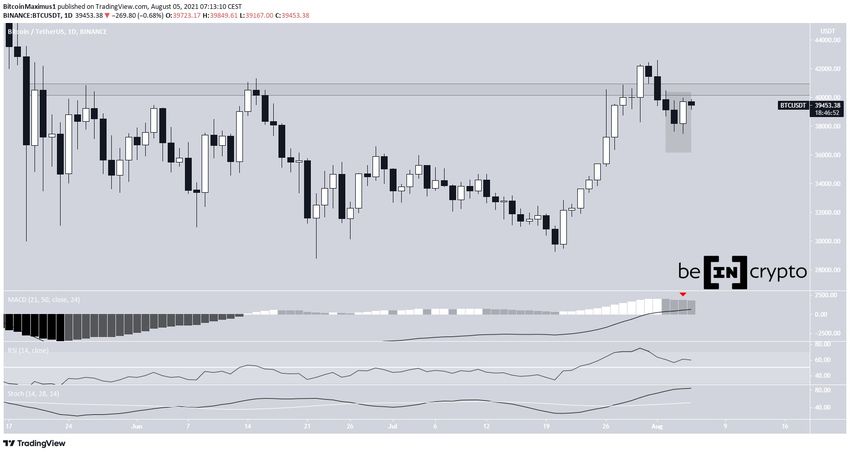
BTC has been decreasing since reaching a high of $42,599 on Aug 1. The downward movement led to a low of $37,481 being reached on Aug 4.
However, BTC immediately reversed and created a bullish engulfing candlestick, leading to a high of $39,973 the same day.
It’s still trading below the $40,550 area, which is now likely to act as resistance again. Furthermore, technical indicators have begun to show bearish signs, such as the decreasing momentum in the MACD and RSI cross below 70.
Ongoing bounce
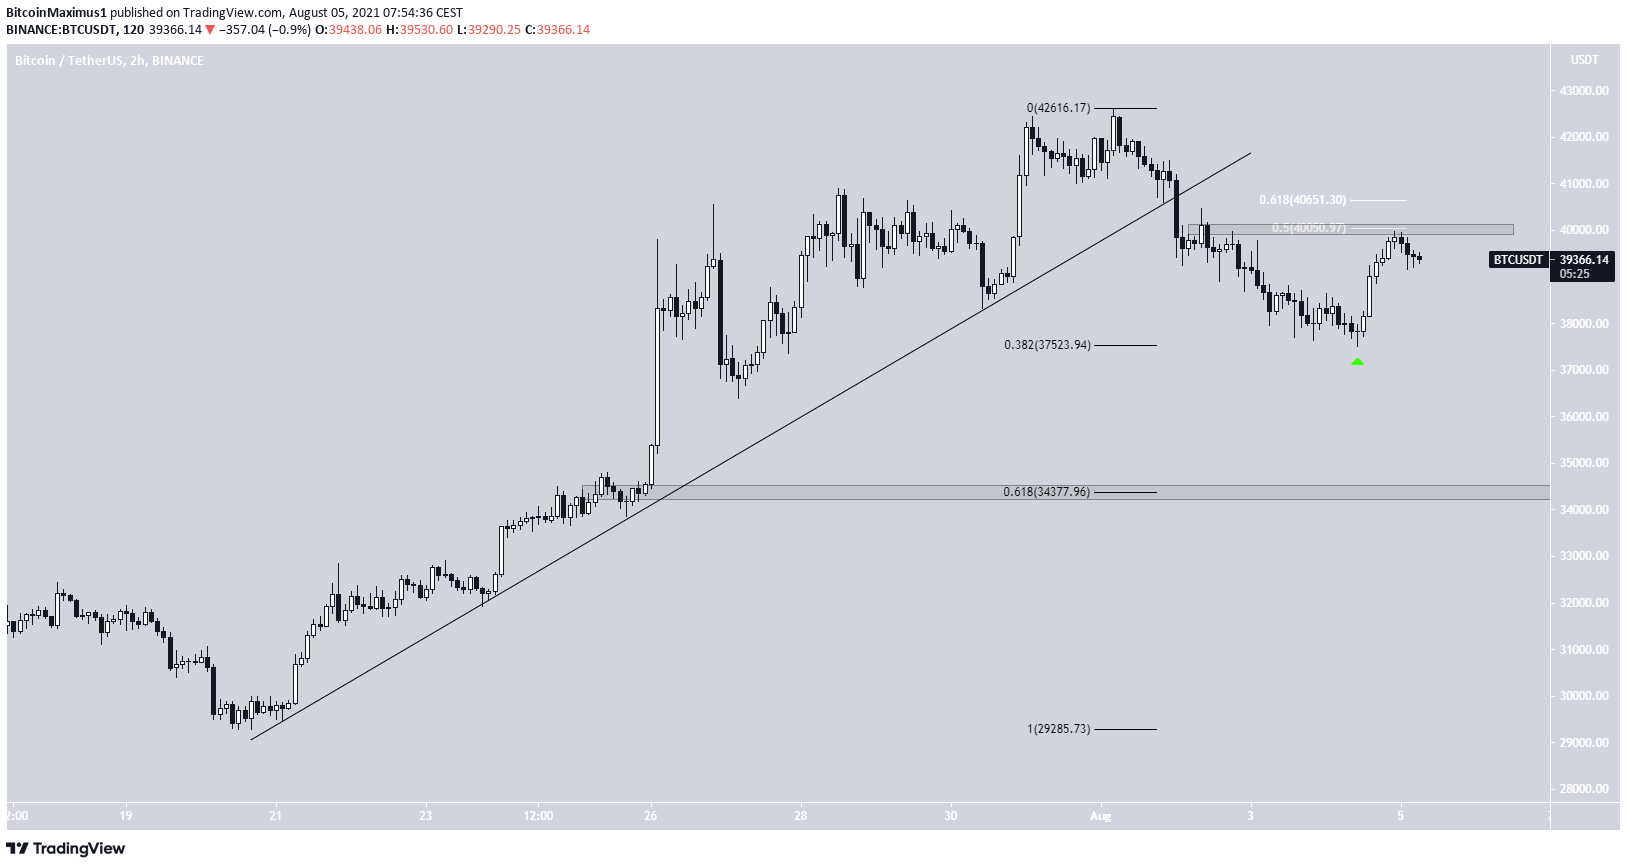
The six-hour chart shows that the decrease accelerated as soon as BTC broke down from an ascending support line.
However, it bounced after reaching the 0.382 Fib retracement support level at $37,520.
Currently, it’s trading slightly below the $40,050 resistance area, which is the 0.5 Fib retracement resistance level. The 0.618 Fib level is found at $40,650, coinciding with the range high.
The next closest support area is at $34,480. This is both a horizontal support area and the 0.618 Fib retracement support level.
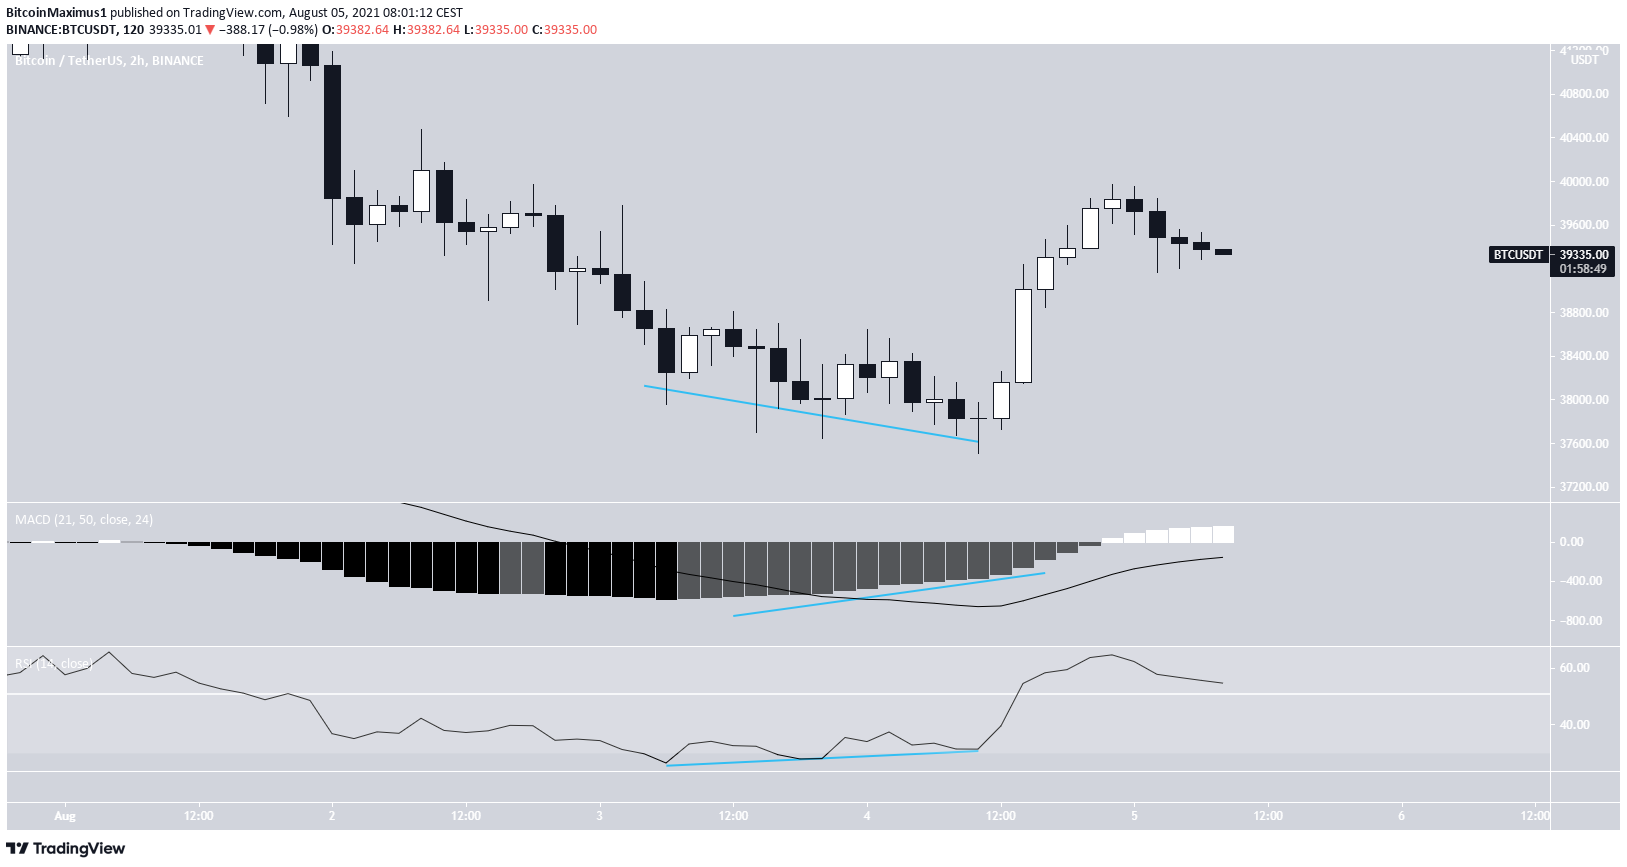
A closer look shows that the bounce was preceded by significant bullish divergences in both the RSI and MACD.
Neither indicator is showing any signs of weakness in the short-term.
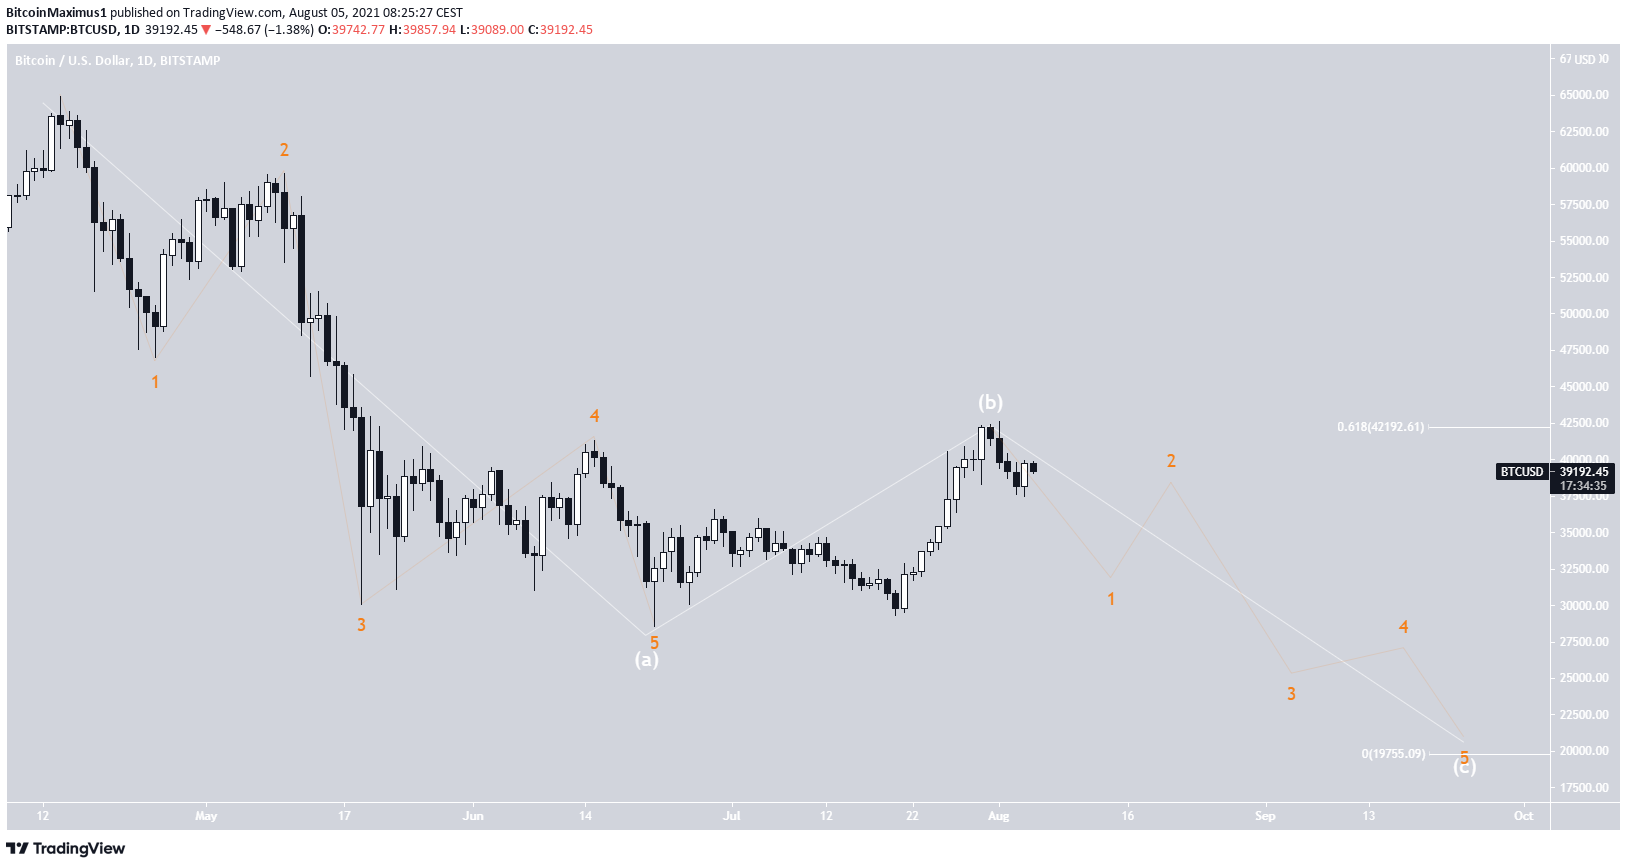
Wave count
The most likely wave count suggests that BTC is in the process of completing sub-wave 2 (black), which will likely be done at either the 0.5 or 0.618 Fib retracement resistance levels.
Afterwards, it would be expected to decrease once again. The entire sub-wave formation would complete a longer-term wave 1 (orange).
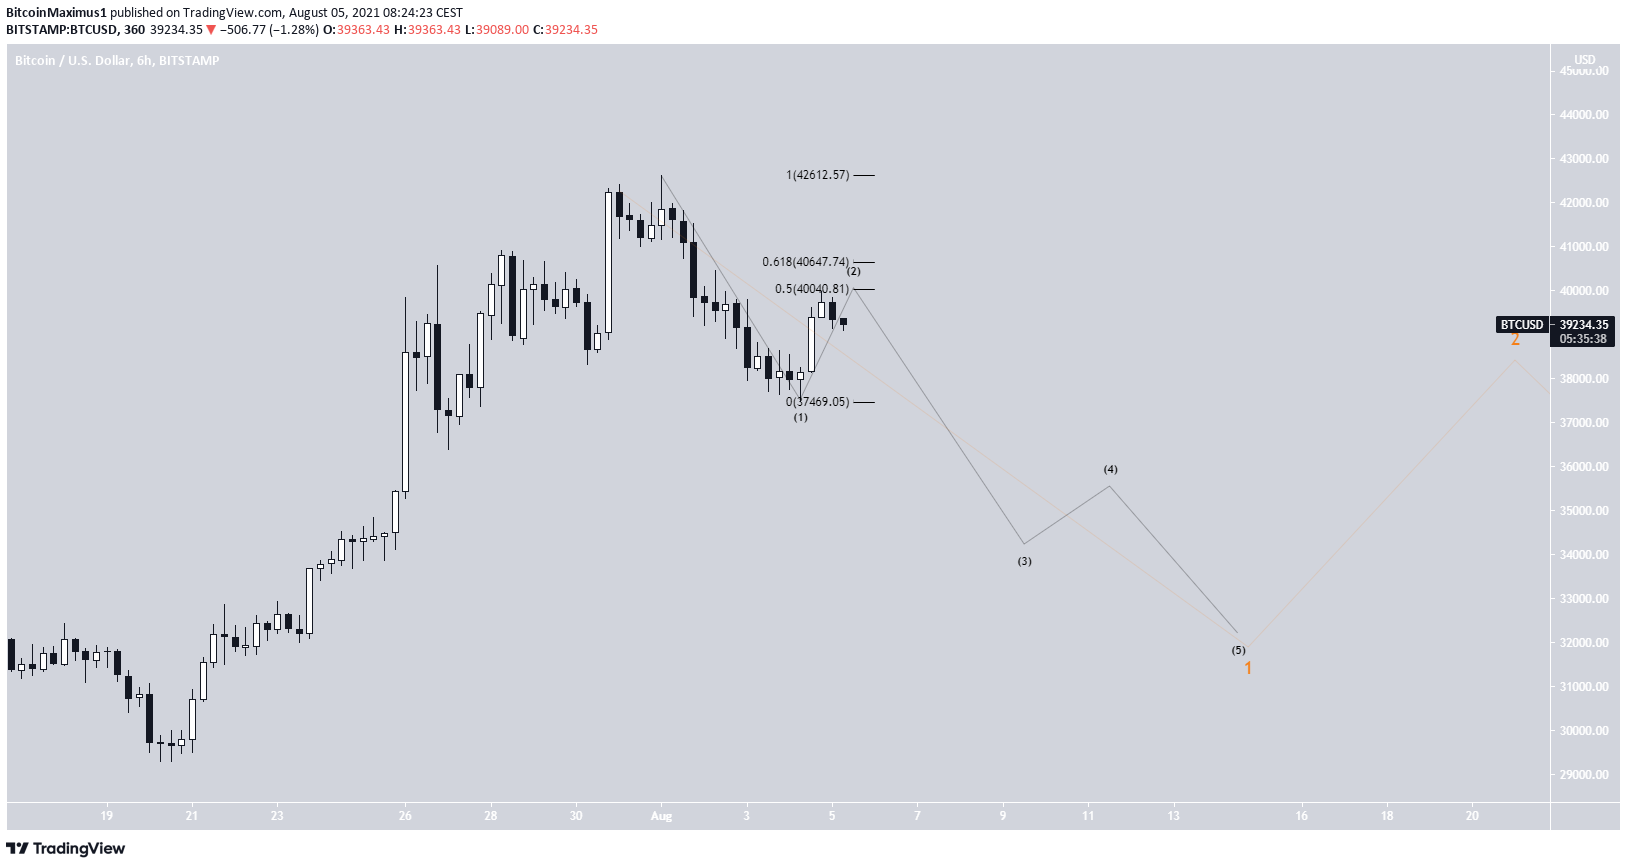
Afterwards, the long-term count could have BTC going as low as $20,000. This target is found when considering that waves A:C normally form a 1:0.618 ratio.
For BeInCrypto’s previous bitcoin (BTC) analysis, click here.


