
Solana’s (SOL) price has dropped by 5% in the past 24 hours, leaving holders hoping for a recovery. However, several indicators suggest that a significant rebound may not occur for several days or weeks.
Currently trading at $146.96, this analysis outlines why SOL could face further declines in the short term.
Solana Still Unable to Bid Downtrend Goodbye
On August 25, Solana (SOL) printed a red candlestick on the daily chart, followed by another the next day. Currently, bulls are trying to push the token toward $150. However, the formation of a rounding top during this timeframe suggests that reaching such levels might be difficult in the short term.
A rounding top is an upside-down U-shaped pattern that signals the reversal of a bullish trend into a bearish one. In this pattern, a break below the neckline confirms the bearish continuation, while a break above it could invalidate this outlook. For SOL, the price is nearing the neckline at around $142.87.
Additionally, the Bull Bear Power (BBP) indicator, which measures the strength of buyers (bulls) versus sellers (bears), is currently in negative territory. This decline suggests that selling pressure is outpacing buying interest, indicating a potential acceleration of the downtrend.
Read more: Solana vs. Ethereum: An Ultimate Comparison
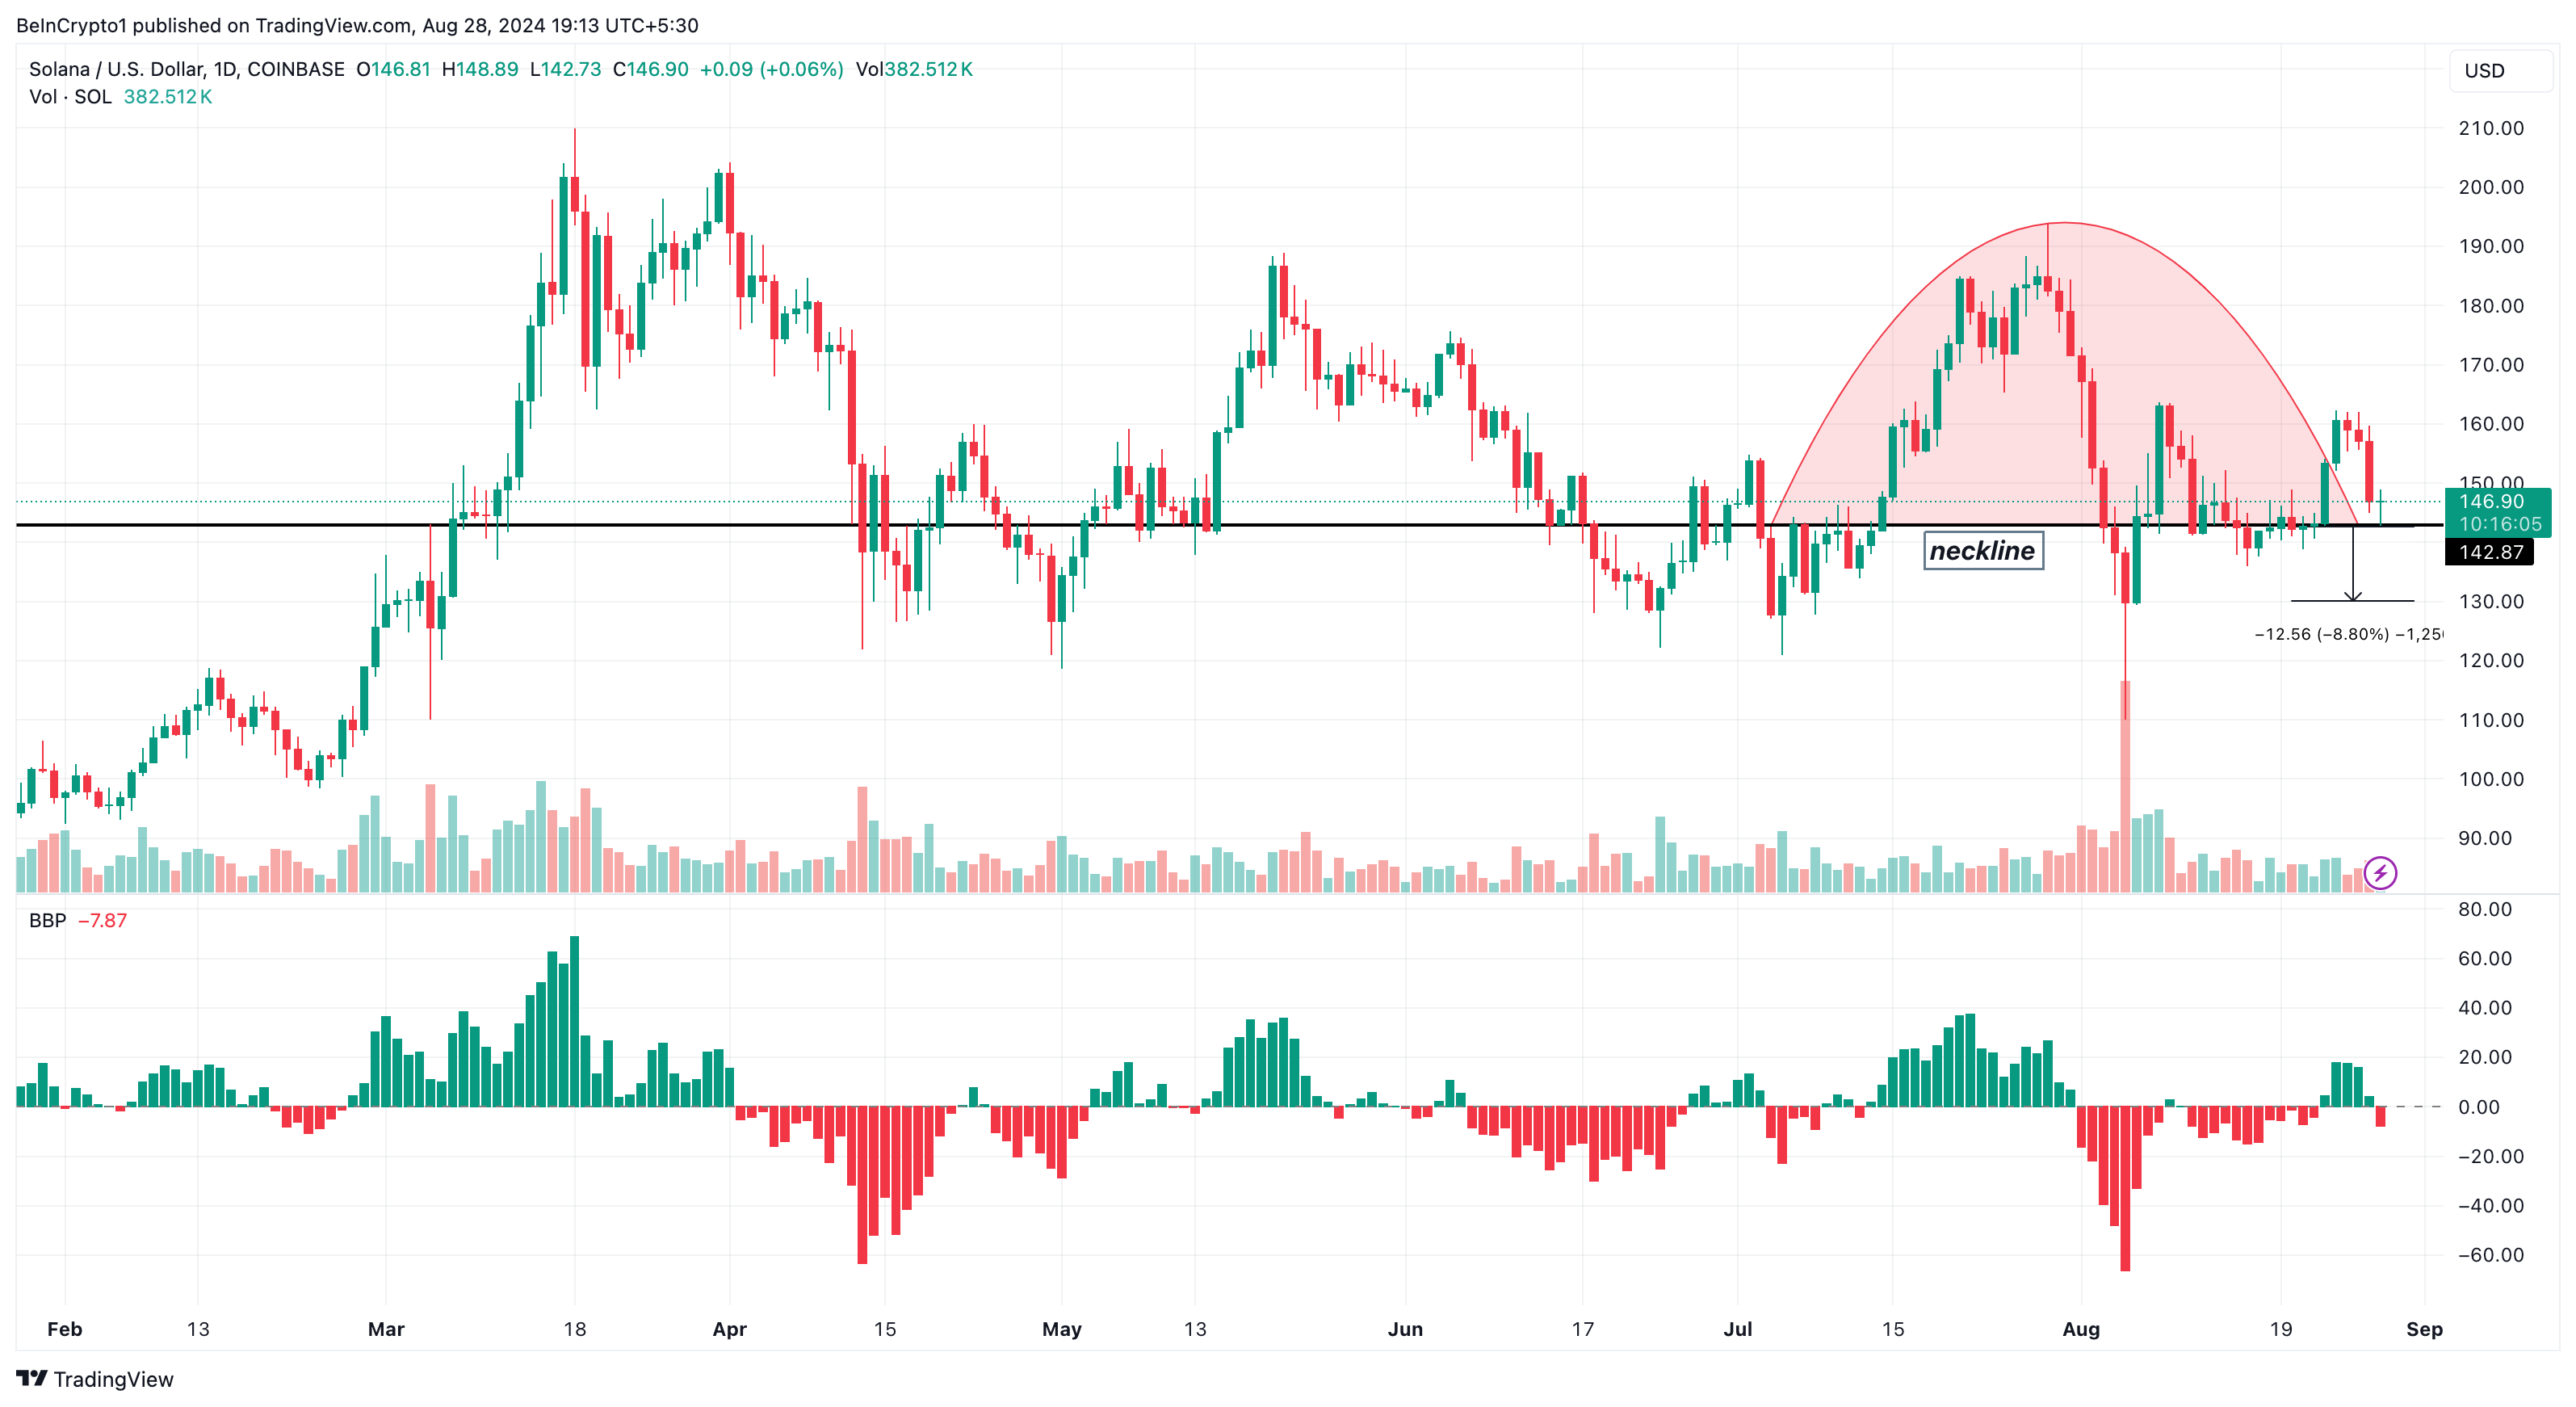
If the bearish outlook is validated, Solana’s (SOL) price could drop by approximately 8.80%, reaching around $130.09. Additionally, the liquidation heatmap from the past 30 days reveals a significant concentration of liquidity between $130 and $138.
The liquidation heatmap highlights price levels where large-scale liquidations are likely to occur, making it a crucial tool for identifying support and resistance areas that could influence price movement. In essence, the greater the liquidity at a specific price range, the higher the likelihood that the price will move in that direction.
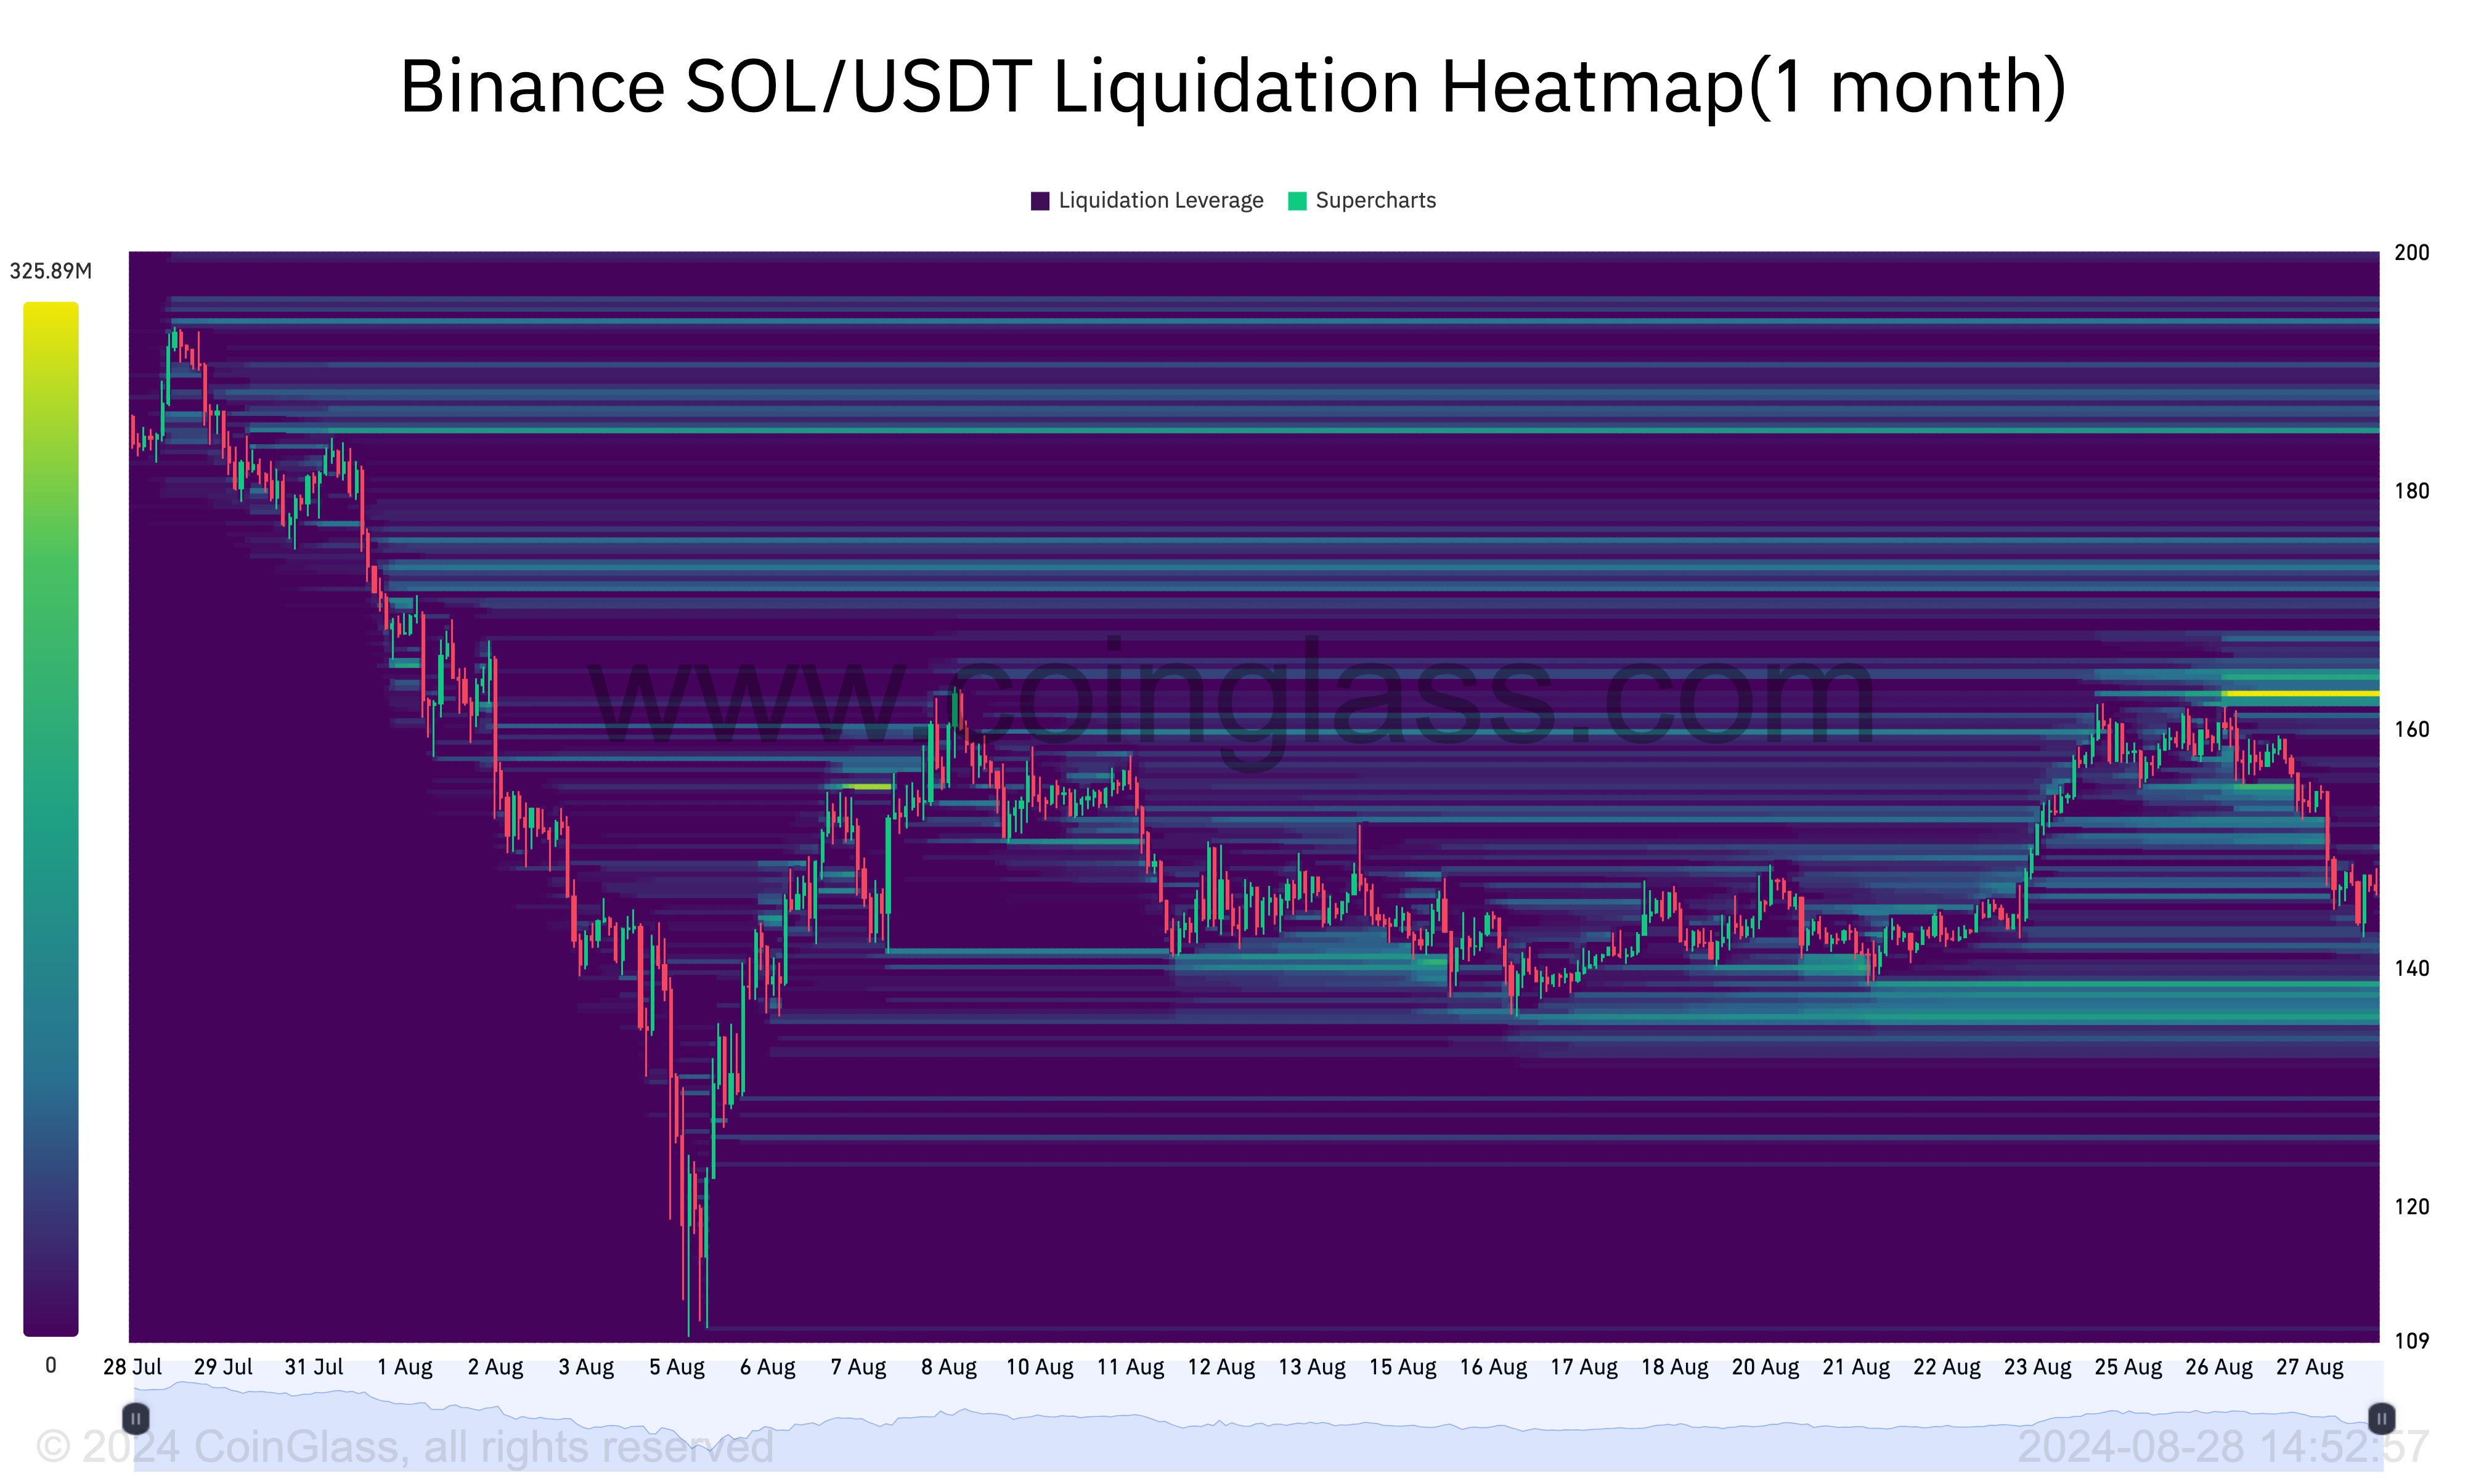
In Solana’s (SOL) case, insufficient buying pressure could drive the price down to the $130 to $138 range. However, the image above also highlights a significant liquidity concentration near $162. If broader market conditions improve, SOL’s price could potentially move toward this higher level.
SOL Price Prediction: Bears Keep Control
An additional look at the daily chart presents SOL’s potential price targets according to the Fibonacci retracement indicator. The Fib levels, as it is commonly called, identify support and resistance using a series of ratios or sequences.
The most important ratios in this indicator include 23.6%, 38.2%, 50%, 61.8%, and 78.6% levels. For a cryptocurrency’s price to have a chance at hitting the next ratio, it must first surpass the preceding one.
According to the chart below, SOL appears to be on the verge of sliding below the 38.2% Fib, which is located at $142.09.
Read more: Solana (SOL) Price Prediction 2024/2025/2030
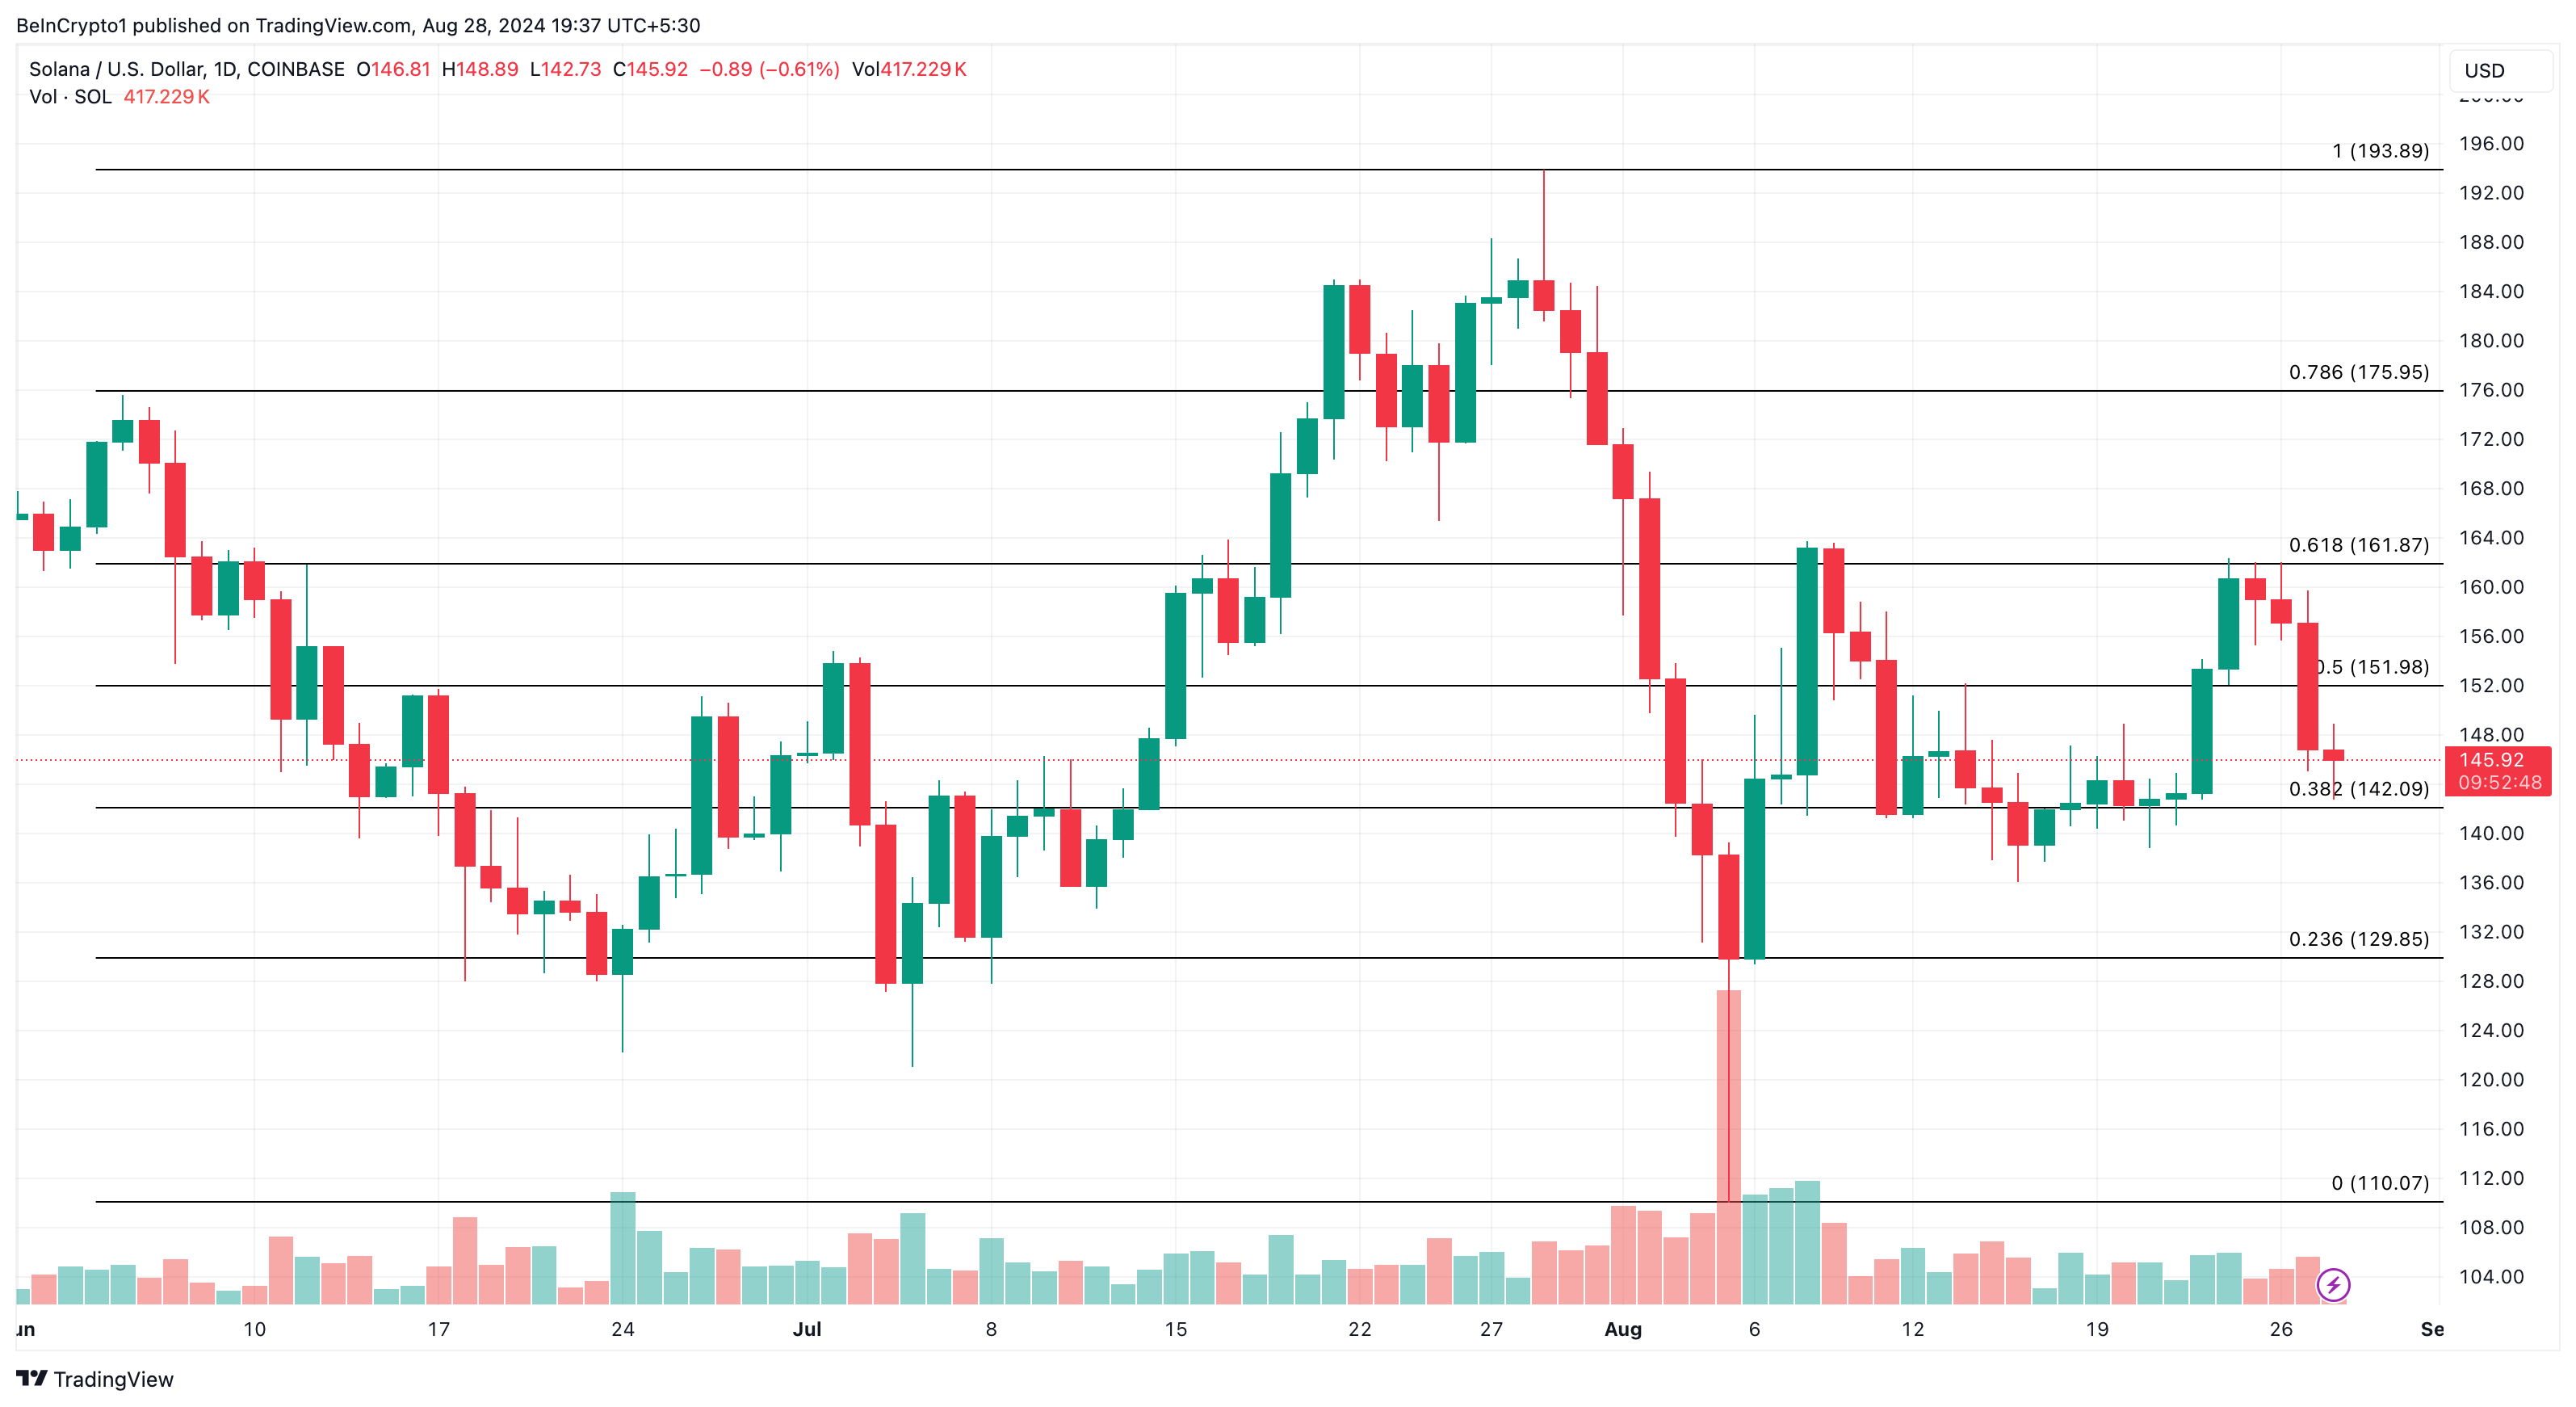
If selling pressure intensifies, Solana’s (SOL) value could drop below $130, reaching the 23.6% nominal pullback level at $129.85. Conversely, if buying pressure strengthens, a rebound toward $161.87 becomes a viable possibility.
