


The Solana (SOL) price has decreased since a horizontal resistance area rejected it on February 14.
SOL has traded without any volatility since the end of December 2023, creating a symmetrical triangle pattern.
Solana Breaks Out but Gets Rejected
The technical analysis of the daily time frame shows the SOL price broke out from a descending resistance trend line on January 28, 2024. The upward movement culminated with a high of $119 on February 14.
However, the SOL price was rejected by the $115 horizontal resistance area on February 14 (red icon) and has fallen since. Currently, SOL trades slightly above $100.
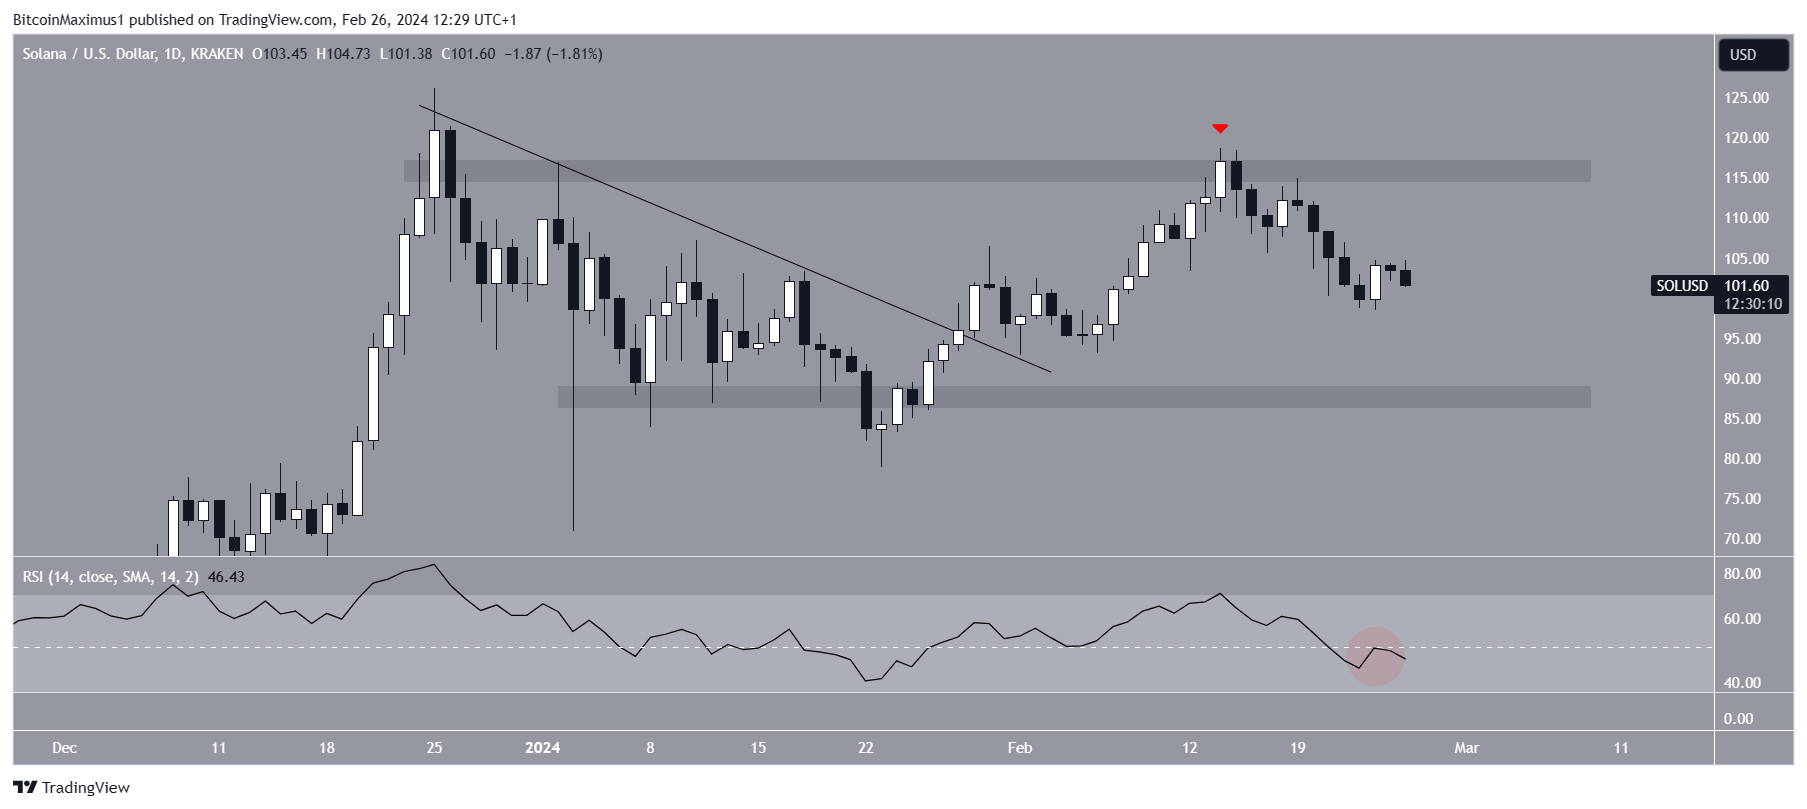
The daily time frame Relative Strength Index (RSI) is bearish. Traders utilize the RSI as a momentum indicator to assess whether a market is overbought or oversold and whether to accumulate or sell an asset.
Read More: Solana (SOL) Price Prediction 2024/2025/2030
Bulls still have an advantage if the RSI reading is above 50 and the trend is upward. But if the reading is below 50, the opposite is true. The indicator is below 50 (red circle) and on a downward trend, both considered signs of a bearish trend.
SOL Price Prediction: Will the $100 Level Hold?
Sticking with the daily time frame, the wave count since June suggests the SOL price is in wave four in a five-wave upward movement.
Technical analysts utilize the Elliott Wave theory to ascertain the trend’s direction by studying recurring long-term price patterns and investor psychology. If the count is correct, wave four has taken the shape of a symmetrical triangle, the most common pattern for wave four.
Read More: What is Solana (SOL)?
Altcoin Sherpa gives a similar outlook. While still determining its short-term movement, Altcoin Sherpa predicts the SOL price will increase significantly in 2024.
A SOL breakout from the triangle will confirm that wave five has started. If so, SOL can increase by 45% to the next resistance at $145.
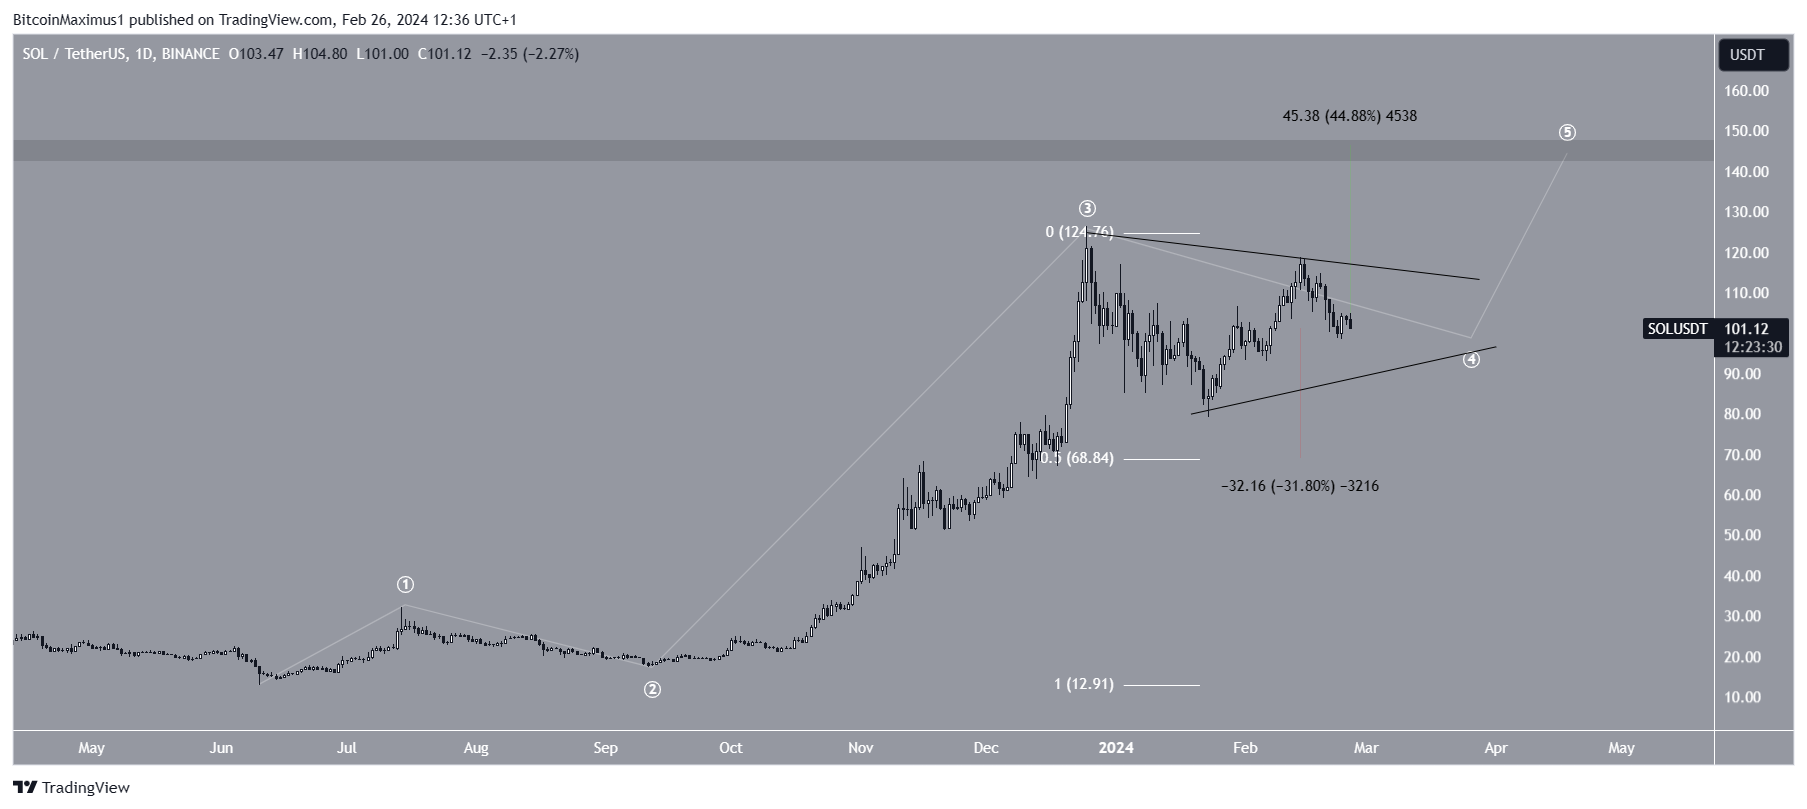
Despite this bullish SOL price prediction, a breakdown from the triangle can trigger a more than 30% decrease to the closest long-term support at $69.
For BeInCrypto‘s latest crypto market analysis, click here.



