


The Solana (SOL) price could break out from a short-term descending resistance line, confirming a long-term double-bottom pattern in the process.
Avalanche (AVAX) has already broken out from a short-term descending resistance line, fending off a fall toward a new yearly low.
Solana (SOL) Price to Confirm Its Bullish Pattern?
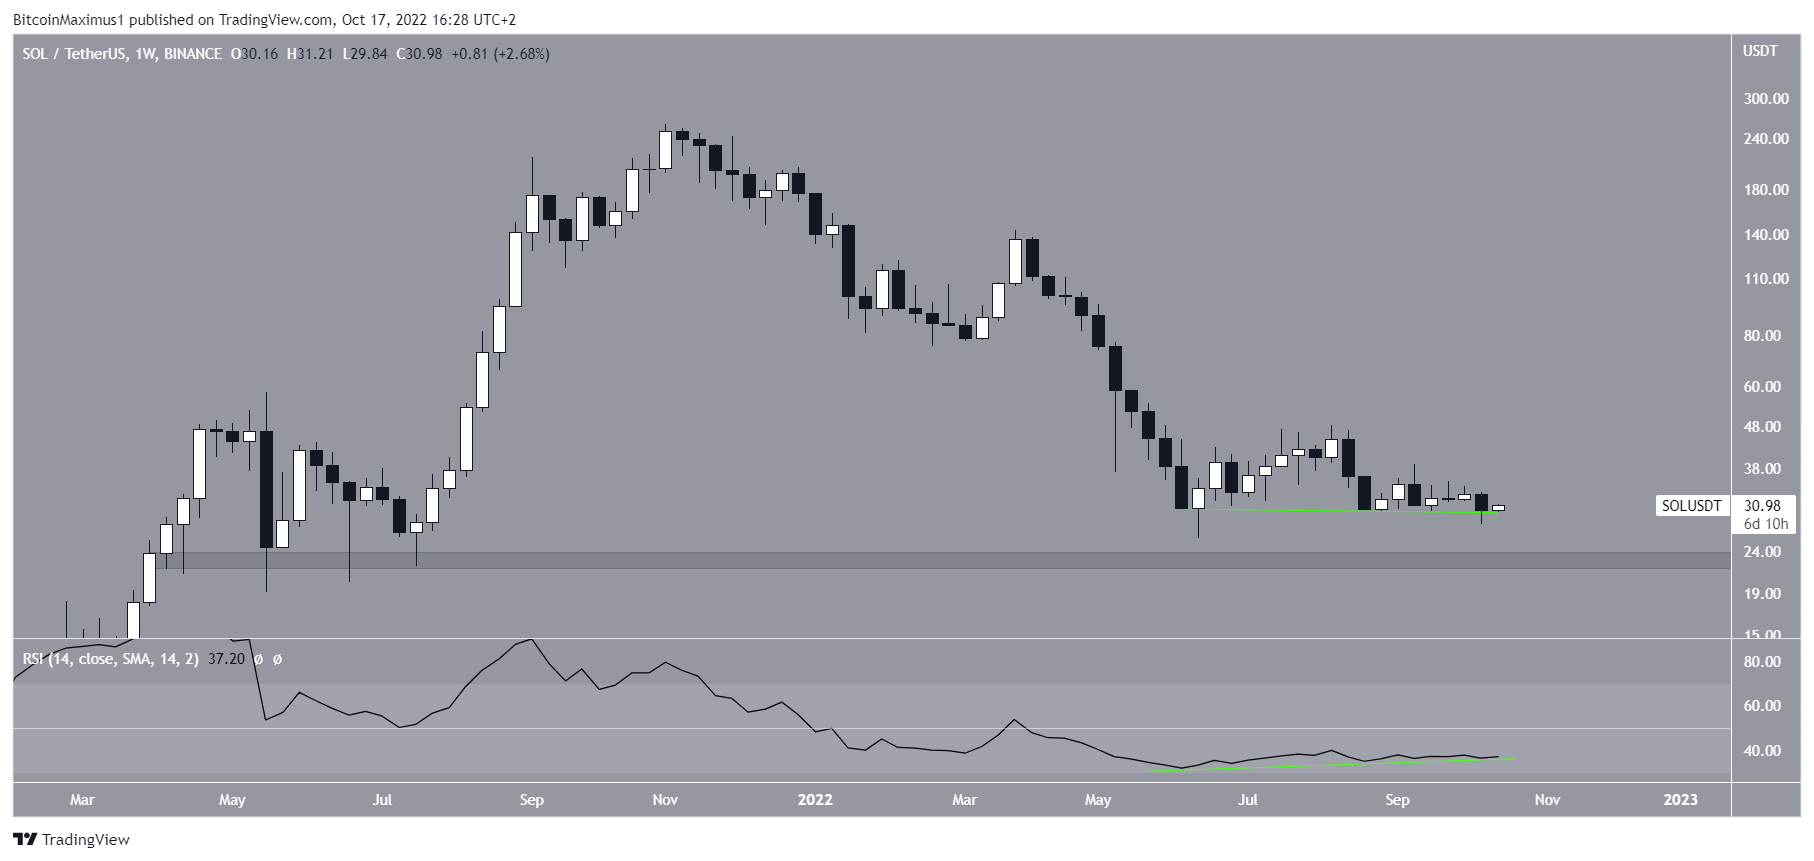
SOL has been falling since reaching an all-time high price of $259.9 in Nov. 2021. The downward movement led to a low of $25.9 in June 2022.
After a bounce, the SOL price returned to its yearly lows. It is possible that it has created a double bottom pattern, which has also been combined with a bullish divergence in the weekly RSI (green line).
The double bottom is also considered a bullish pattern. As a result of the creation of a bullish pattern and the bullish divergence, a bullish reversal could follow.
However, it is worth mentioning that the price has yet to reach any important support levels. Rather, the closest support area is at $23 and has not been reached since July 2021.
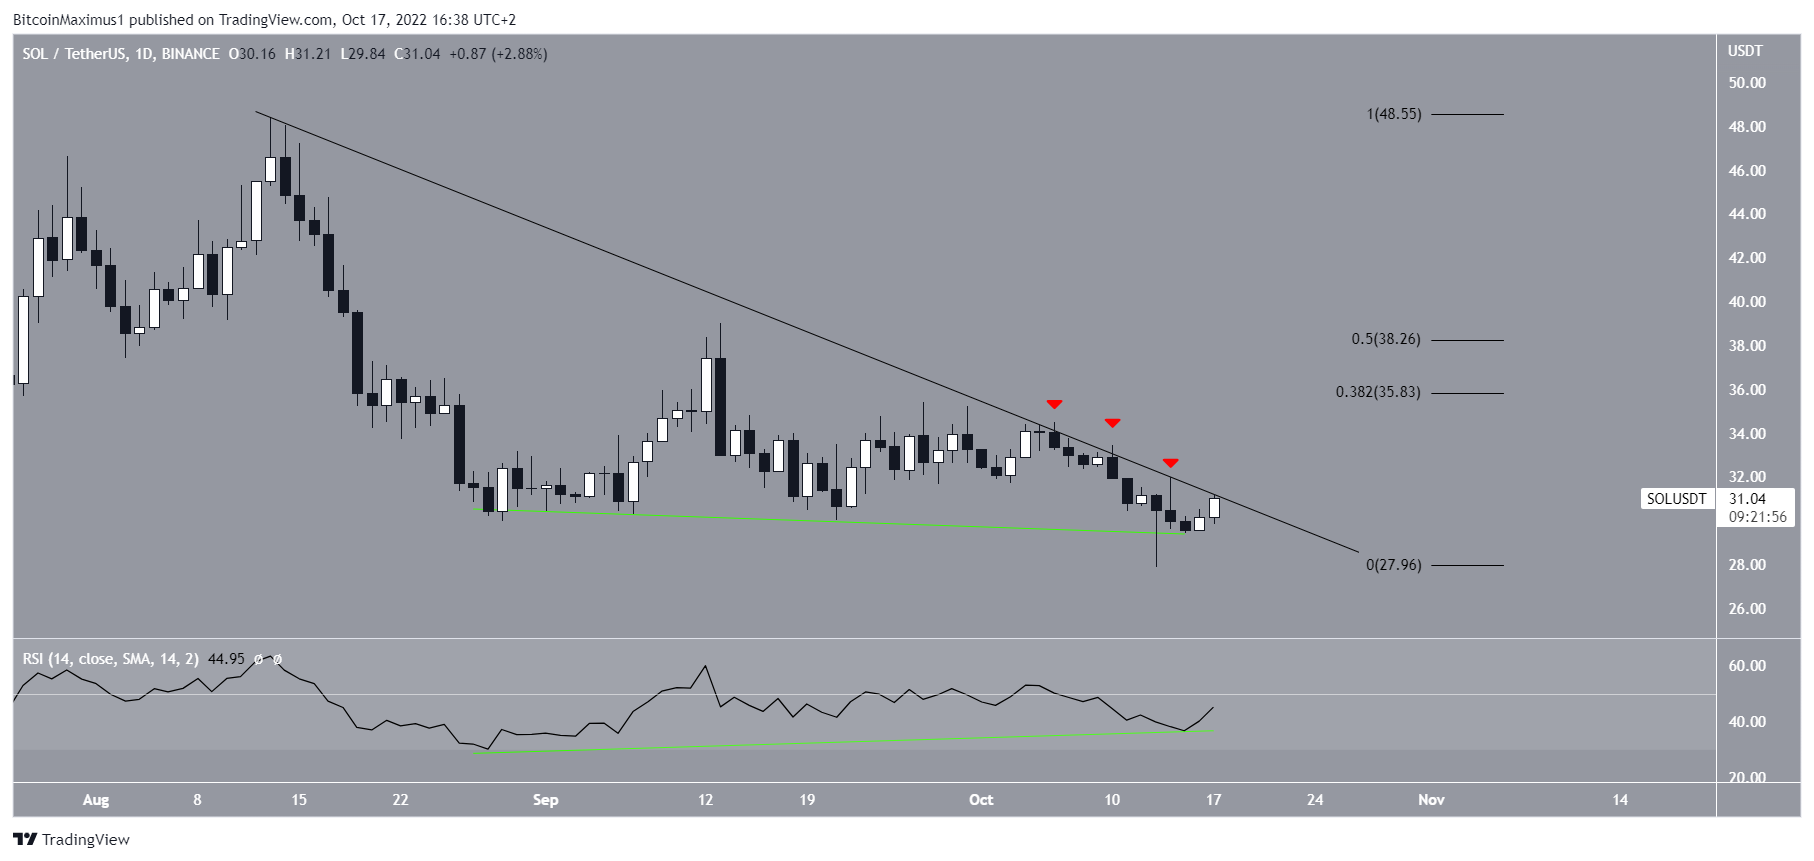
The daily chart shows that SOL has been falling underneath a descending resistance line since Aug. 15. However, it has made three recent attempts at breaking out (red icons) since the beginning of Oct.
Moreover, the daily RSI has generated a bullish divergence, supporting the possibility of a breakout.
As a result, if SOL validates its bullish divergence and breaks out from the resistance line, it will go a long way in confirming its long-term reversal.
Finally, a movement above the 0.382 – 0.5 Fib retracement resistance area between $35.8 and $38.3 would confirm the reversal.
Avalanche (AVAX) Breakout Saves Yearly Lows
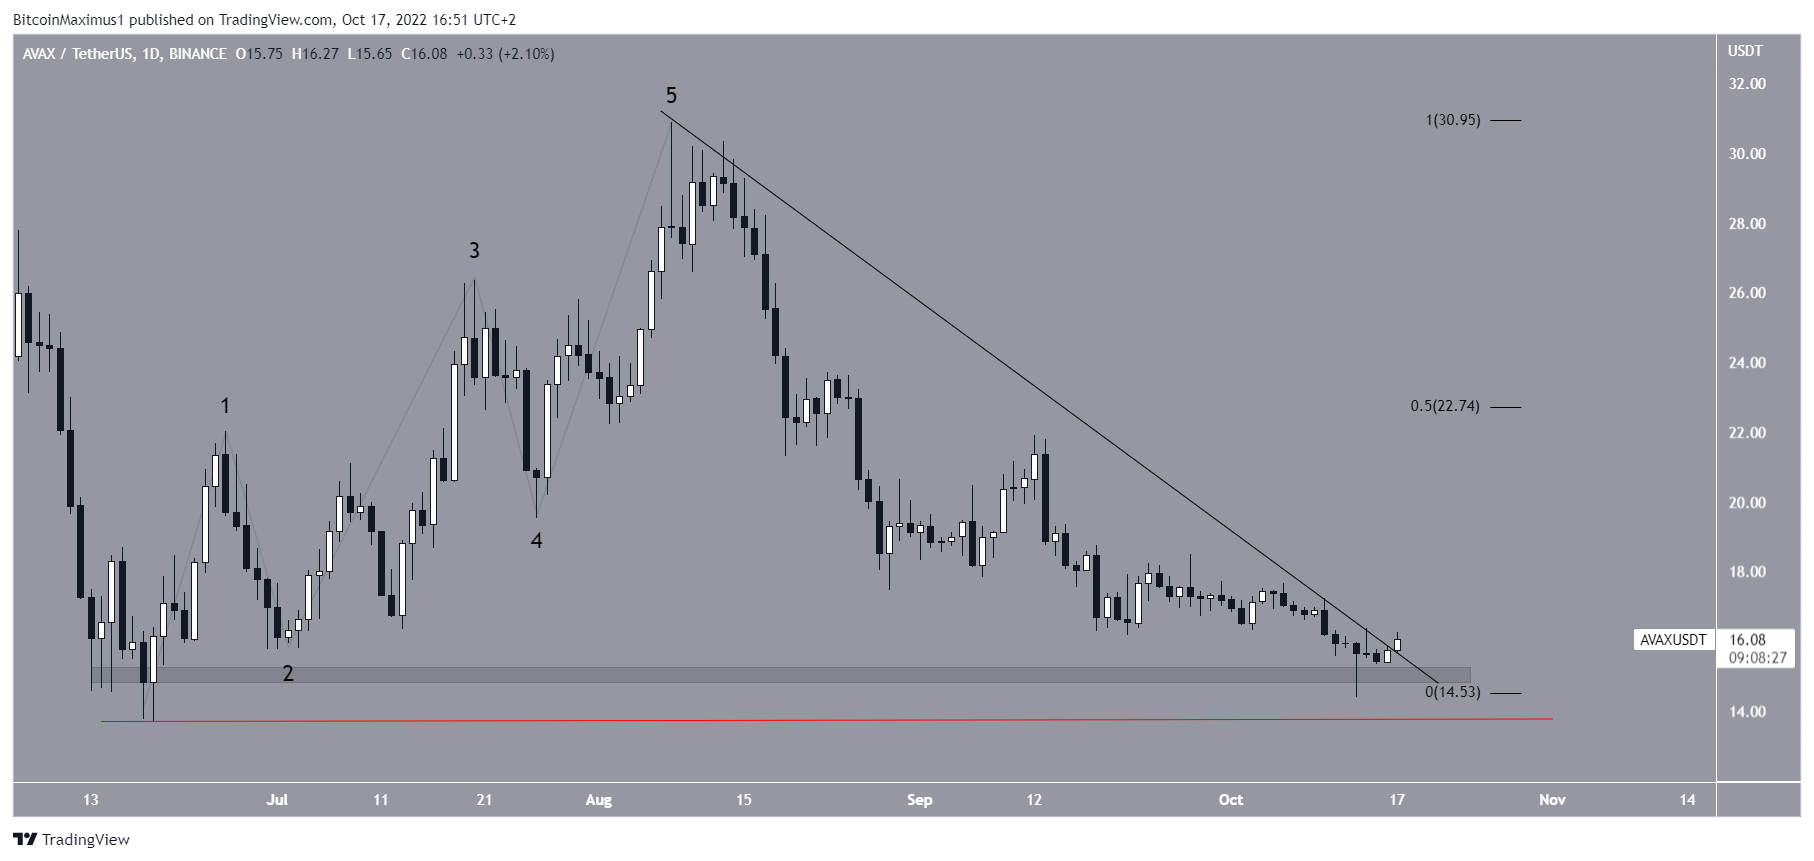
AVAX has been falling underneath a descending resistance line since reaching a high of $30.9 on Aug. 8. The decrease has led to a low of $14.4 on Oct. 13. This created a long lower wick and validated the $15 area as support. The $15 area is the final support area prior to a new yearly low.
Since then, the AVAX price has been moving upwards and is in the process of breaking out from the descending resistance line. Due to the presence of several wicks, it is not yet clear if the price has broken out from the resistance line or if it is still following it.
If the breakout is confirmed, the closest resistance area would be at $22.7, created by the 0.5 Fib retracement resistance level. This is the final resistance area prior to the aforementioned $30.9 high.
Since the AVAX price has not fallen below the yearly lows of $13.7 (red line), it is still possible that the upward movement (black) was impulsive and new highs will follow. A decrease below $13.7 would invalidate this possibility.
SOL & AVAX Potential bullish reversals
To conclude, it is possible that both the SOL price and that of AVAX are in the process of confirming their bullish reversals. In the case of SOL, a short-term breakout would also confirm a long-term double-bottom pattern.
For BeInCrypto latest Bitcoin (BTC) analysis and crypto market analysis, click here
Disclaimer: BeInCrypto strives to provide accurate and up-to-date information, but it will not be responsible for any missing facts or inaccurate information. You comply and understand that you should use any of this information at your own risk. Cryptocurrencies are highly volatile financial assets, so research and make your own financial decisions.


