


The SingularityNET (AGIX) price could break down from its short-term structure and fall to the next closest support area.
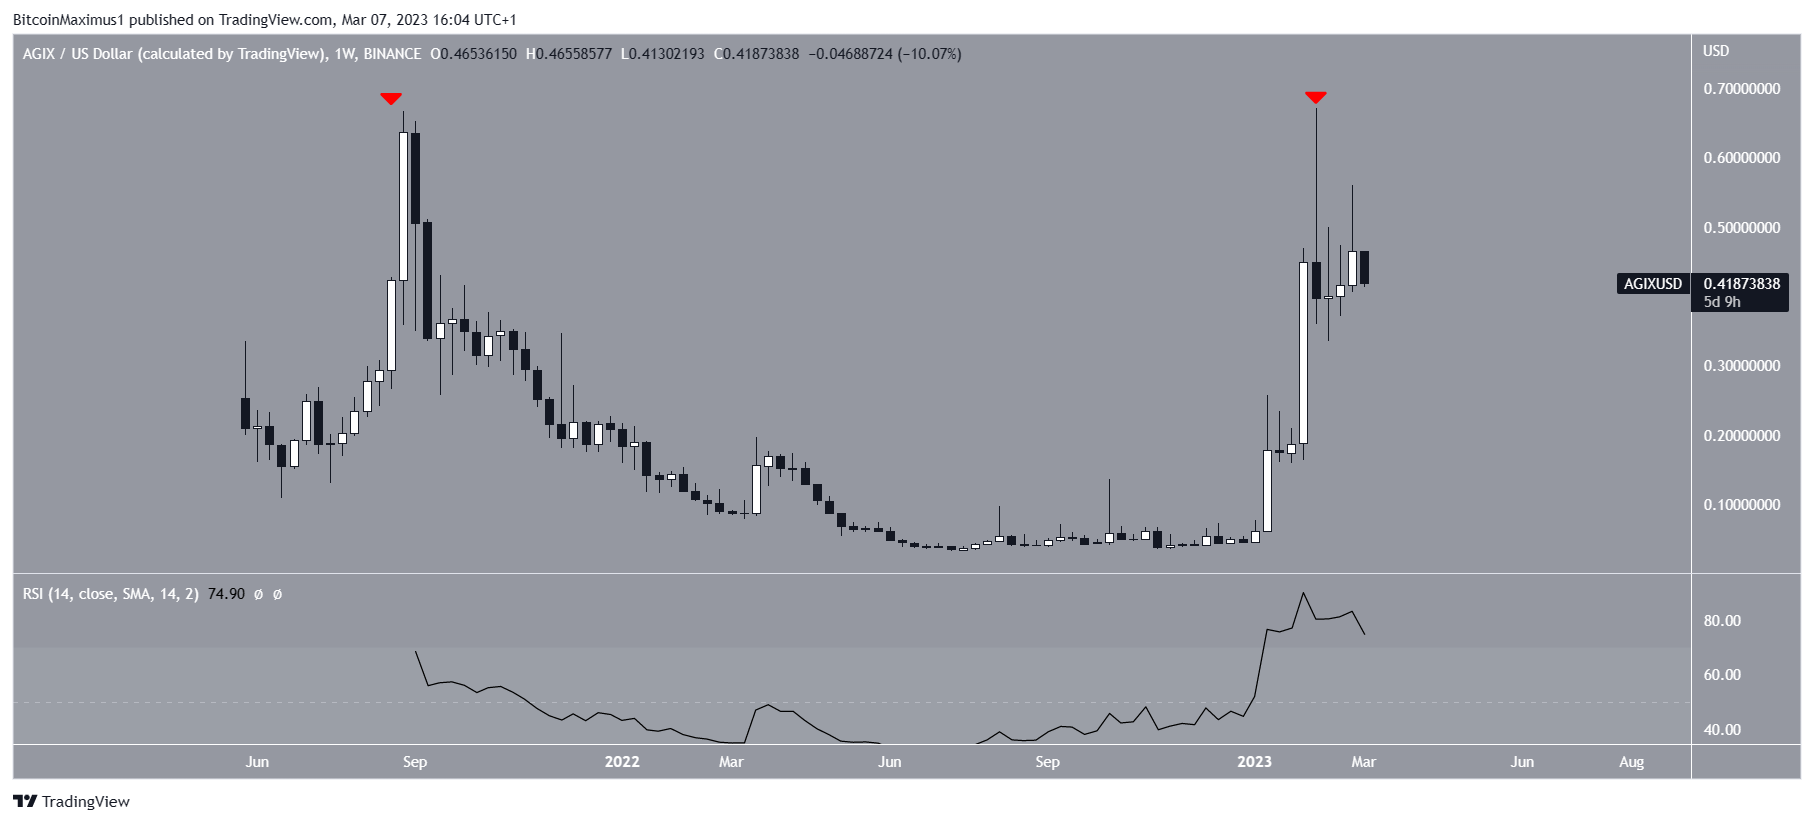
AGIX is the native token of SingularityNET, a blockchain platform that provides artificial intelligence services and an AI marketplace. AGIX price has fallen since reaching a high of $0.67 on Feb. 8. This was the highest price since its listing in 2018. In relation to the 2021 high, this created a double top (red icons), which is considered a bearish pattern.
Selling Pressure Mounts for SingularityNET (AGIX)
Moreover, the price created a bearish weekly candlestick characterized by a very long upper wick. Furthermore, the price created another long upper wick three weeks later. Such wicks are considered signs of selling pressure.
Due to these signs, a downward movement could occur. However, the RSI does not confirm this, since the indicator is overbought but has not generated any bearish divergence.
More Pain Ahead for SingularityNET (AGIX) Price
As outlined before, the AGIX price has decreased since Feb. 8. While it bounced five days later, the increase was contained inside an ascending parallel channel, which usually contains corrective structures.
More importantly, AGIX created a lower high on March 1 (red icon), validating both the 0.618 Fib retracement resistance level and the channel’s resistance line. Therefore, a breakdown from the channel is the most likely scenario.
The price today is in the process of breaking down. Combined with the fact that channels usually contain corrections suggests that the AGIX token price is currently in wave C of an A-B-C corrective structure (red). Giving waves A:C a 1:1 ratio would lead to a low of $0.22. Since this coincides with a horizontal support area, it is a very suitable level for a bottom.
On the other hand, a movement above the March 1 high of $0.54 would invalidate this bearish forecast. In that case, AGIX could increase toward $0.80.
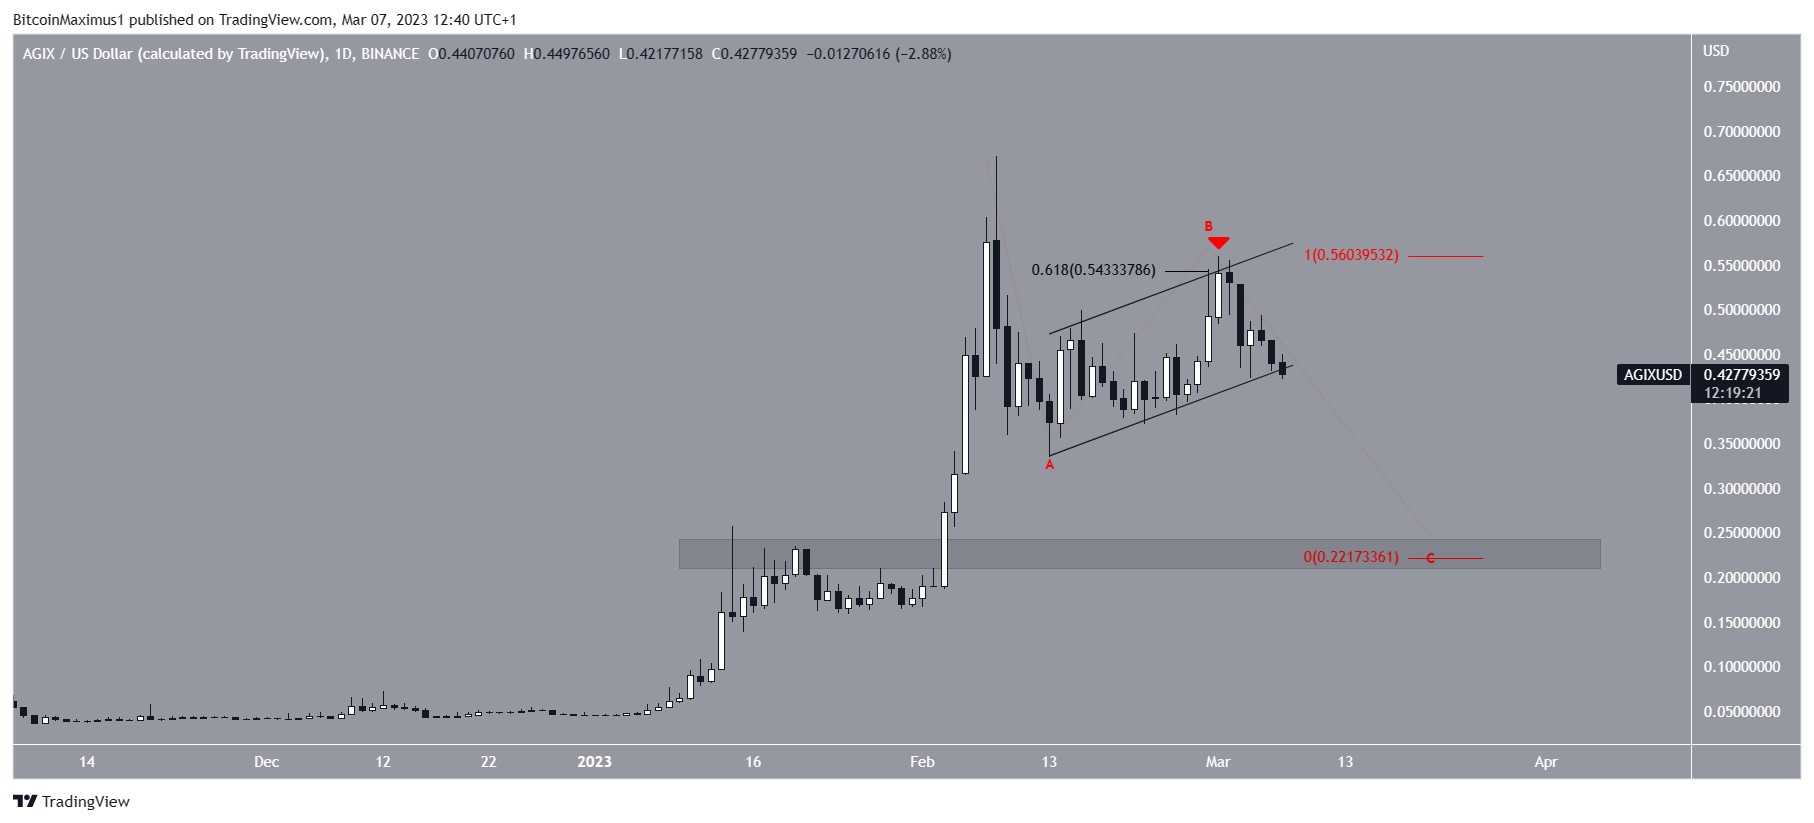
To conclude, the most likely AGIX price forecast is a breakdown from the current structure and a fall to $0.22. An increase above $0.54 would invalidate this. In that case, the price could move to $0.85.
For BeInCrypto’s latest crypto market analysis, click here.



