


The Shiba Inu (SHIB) price broke out from a resistance line but has struggled to sustain its increase.
At the beginning of January, the Shiba Inu price broke out from a descending resistance line and reached a new yearly high of $0.0000157 by the end of the month. This also caused the weekly RSI to increase above 50.
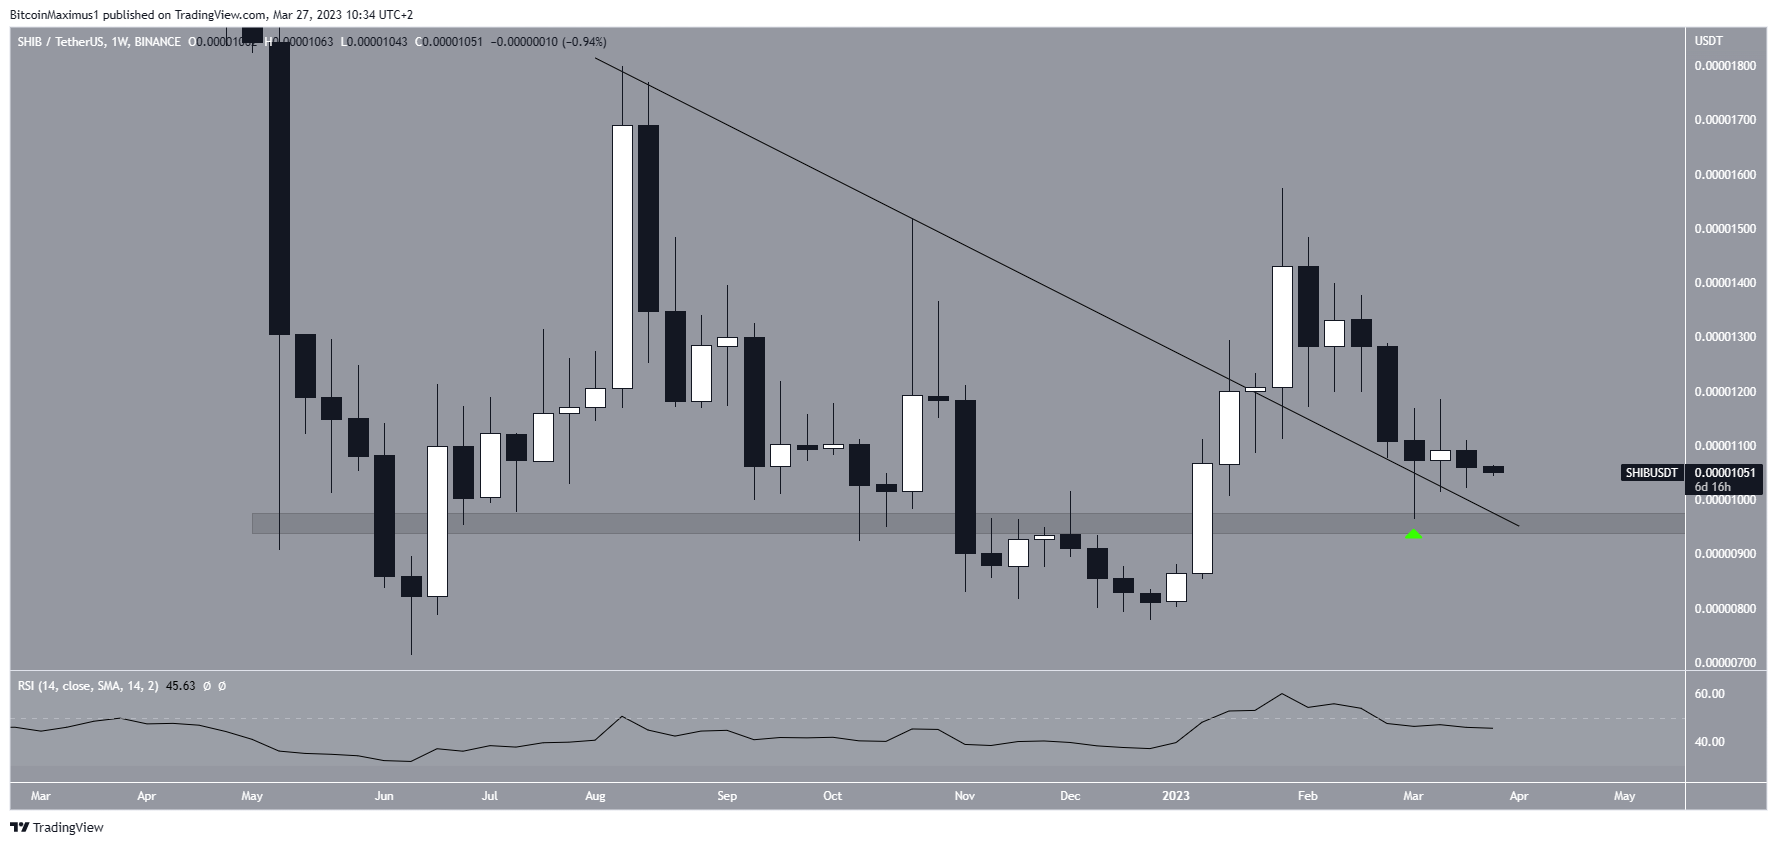
However, the price failed to sustain the rally and returned to the resistance line once more in February, validating it as support (green icon).
In the weekly time frame, the most important support is at $0.0000096. The area has intermittently acted as both support and resistance since May 2022. Currently, it coincides with the descending resistance line.
As a result, any decreases to it are considered retests after a breakout. However, if the SHIB price closes below it, it would invalidate the bullish outlook and could cause a drop to $0.0000070.
Shiba Inu (SHIB) Price Completes Correction
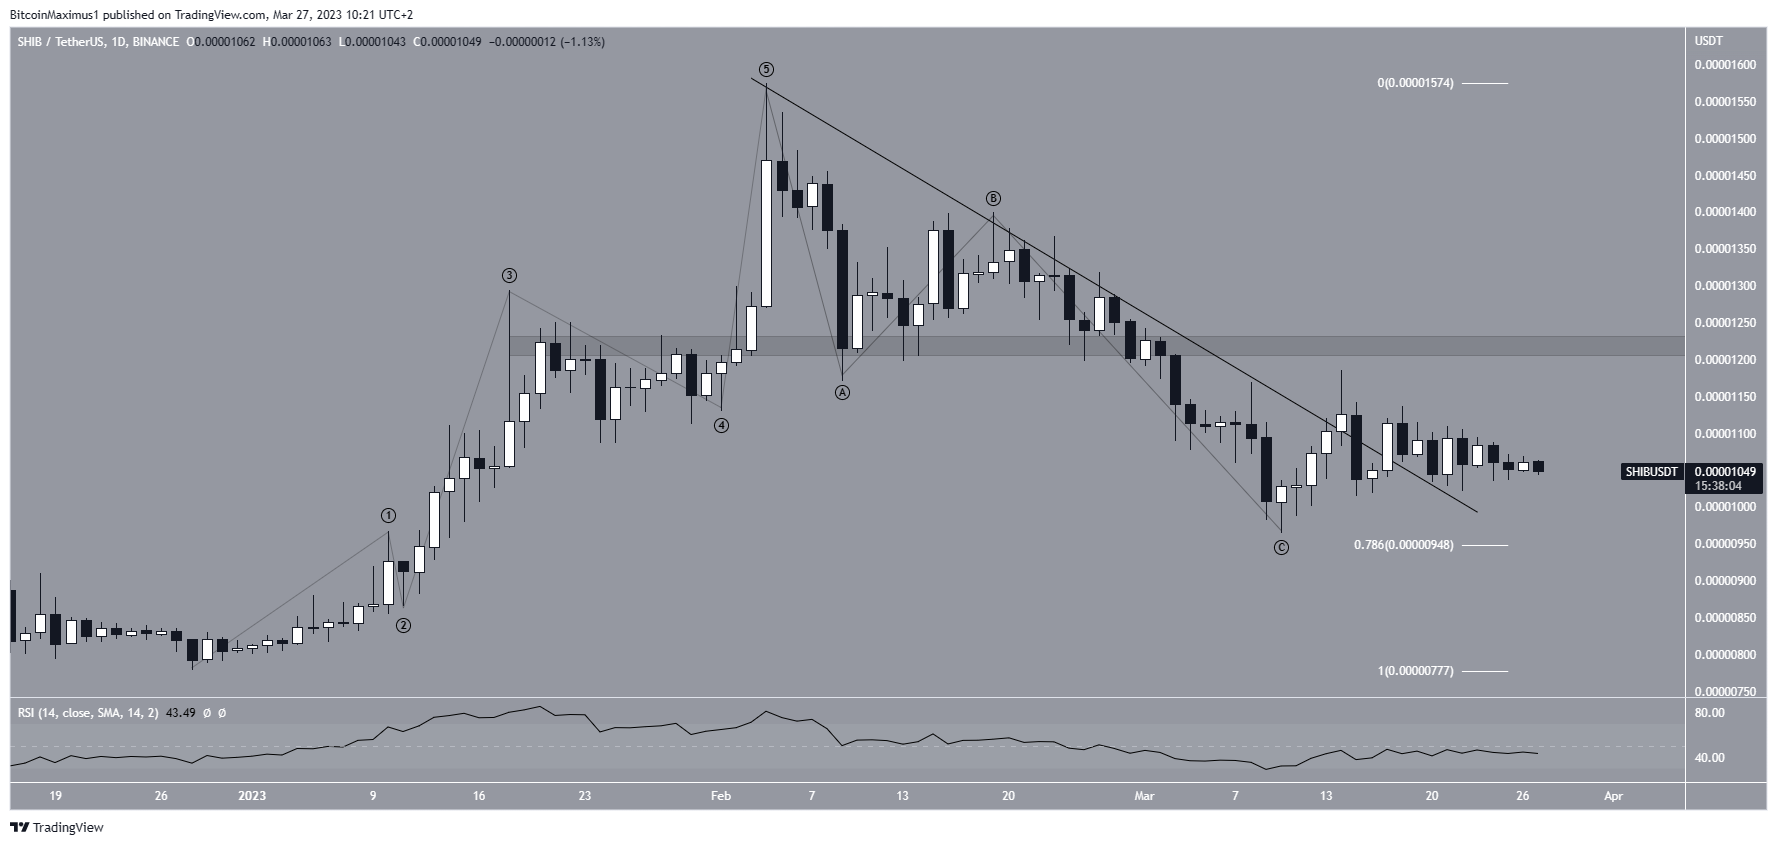
The technical analysis from the daily time frame shows that the SHIB price had fallen under a descending resistance line since Feb. 4. The decrease led to a low of $0.0000096 on March 10. The price has increased since.
The increase was crucial for several reasons:
- The price validated the 0.786 Fib retracement support level at $0.0000095.
- The bounce potentially completed an A-B-C corrective structure.
- The SHIB price broke out from a descending resistance line on March 14, suggesting that it has completed the correction.
However, the ERC-20 token fell during the next 24 hours, decreasing below its breakout level. Moreover, the daily RSI is still below 50, failing to confirm the bullish trend reversal.
The Ethereum-based meme coin is currently trading slightly below its breakout level. If it fails to initiate an increase, the price could fall back to the 0.786 Fib retracement support level. However, if the breakout materializes, SHIB could move to the closest resistance at $0.0000123.
To conclude, the failure to sustain its breakout is a sign of weakness for the Shiba Inu (SHIB) price. Whether it bounces at the previous resistance line or breaks down could determine the future trend. A bounce could lead to an increase toward $0.0000123, while a breakdown could lead to a fall toward $0.0000077.
For BeInCrypto’s latest crypto market analysis, click here.


