


SHIBA INU (SHIB) could break out from a short-term diagonal resistance, but the longer-term outlook still seems to be bearish.
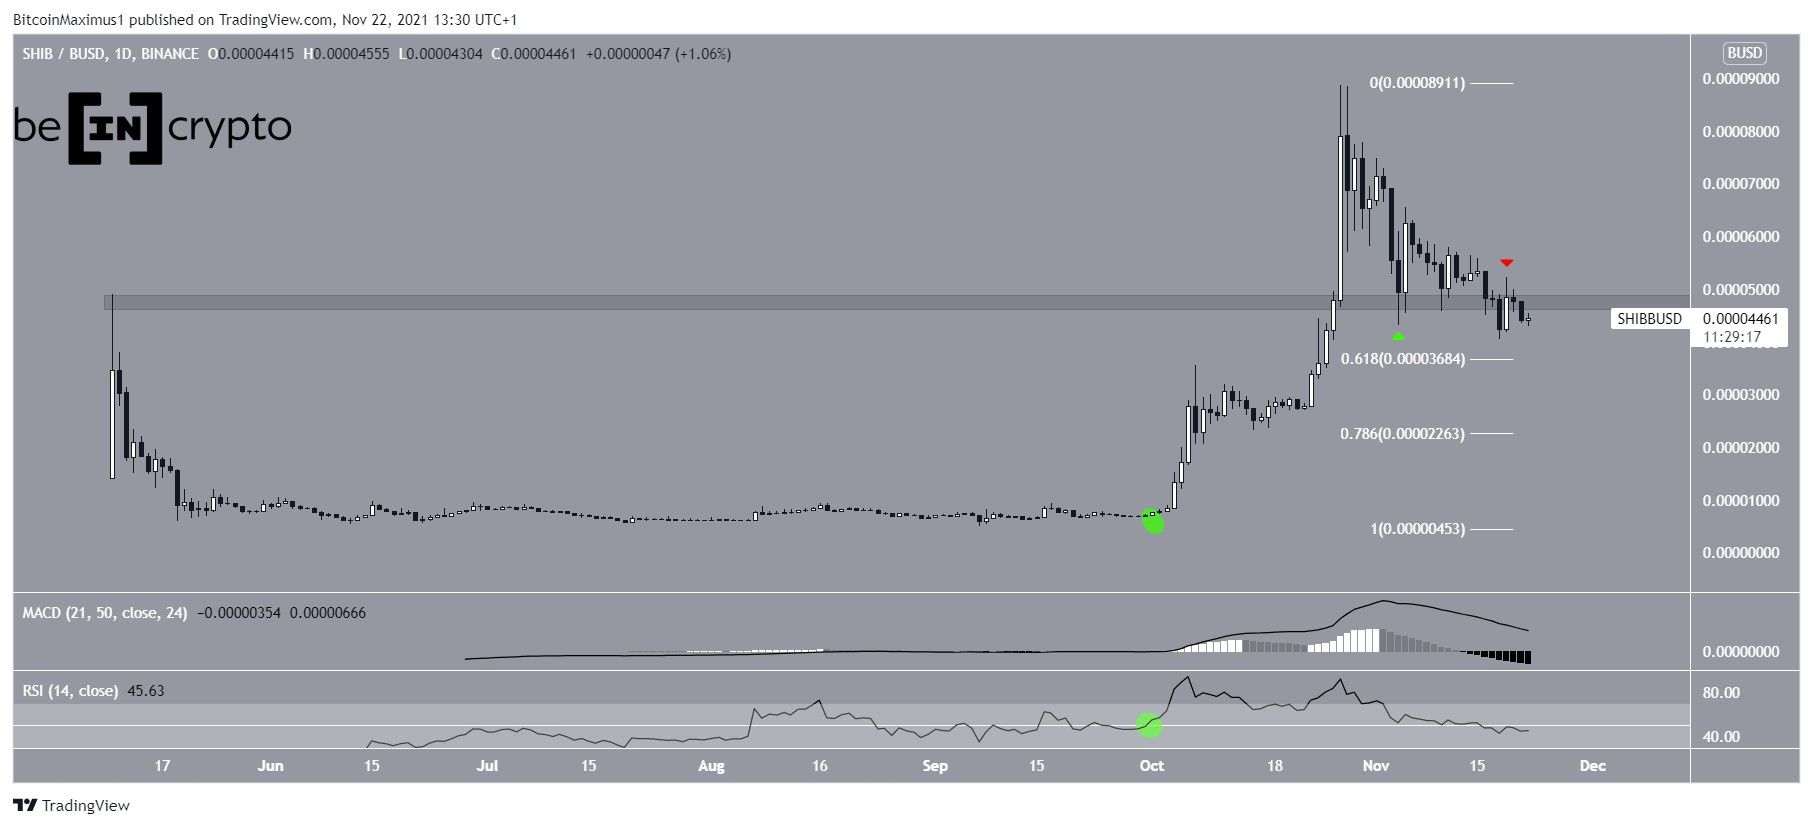
SHIB has been decreasing since Oct 28, when it reached an all-time high of $0.000088. So far, it has reached a low of $0.0000405, doing so on Nov 18.
More importantly, the decreased caused a breakdown below the $0.000048 horizontal area. Previously, SHIB had bounced above it on Nov 4 (green icon). After breaking down, SHIB validated it as resistance on Nov 19 (red icon).
Technical indicators are also bearish. The MACD, which is created by short and long-term moving average (MA) is decreasing and is nearly negative. This means that the short-term MA is moving slower than the long-term MA. It usually occurs during downward trends.
The RSI, which is a momentum indicator, has fallen below 50. This is also considered a sign of a bearish trend, since movements above and below the 50 line can be used to determine the direction of the trend. Previously, the RSI cross above 50 (green circle) preceded the entire upward movement that led to the all-time high.
The next closest support levels are at $0.000037 and $0.000023. These are the 0.618 and 0.786 Fib retracement support levels, respectively.
Future SHIB movement
Cryptocurrency trader @ewforecast outlined a SHIB chart, stating that the token will complete its correction between 0.000024 – 0.000035. This coincides with the previously outlined Fib support area.
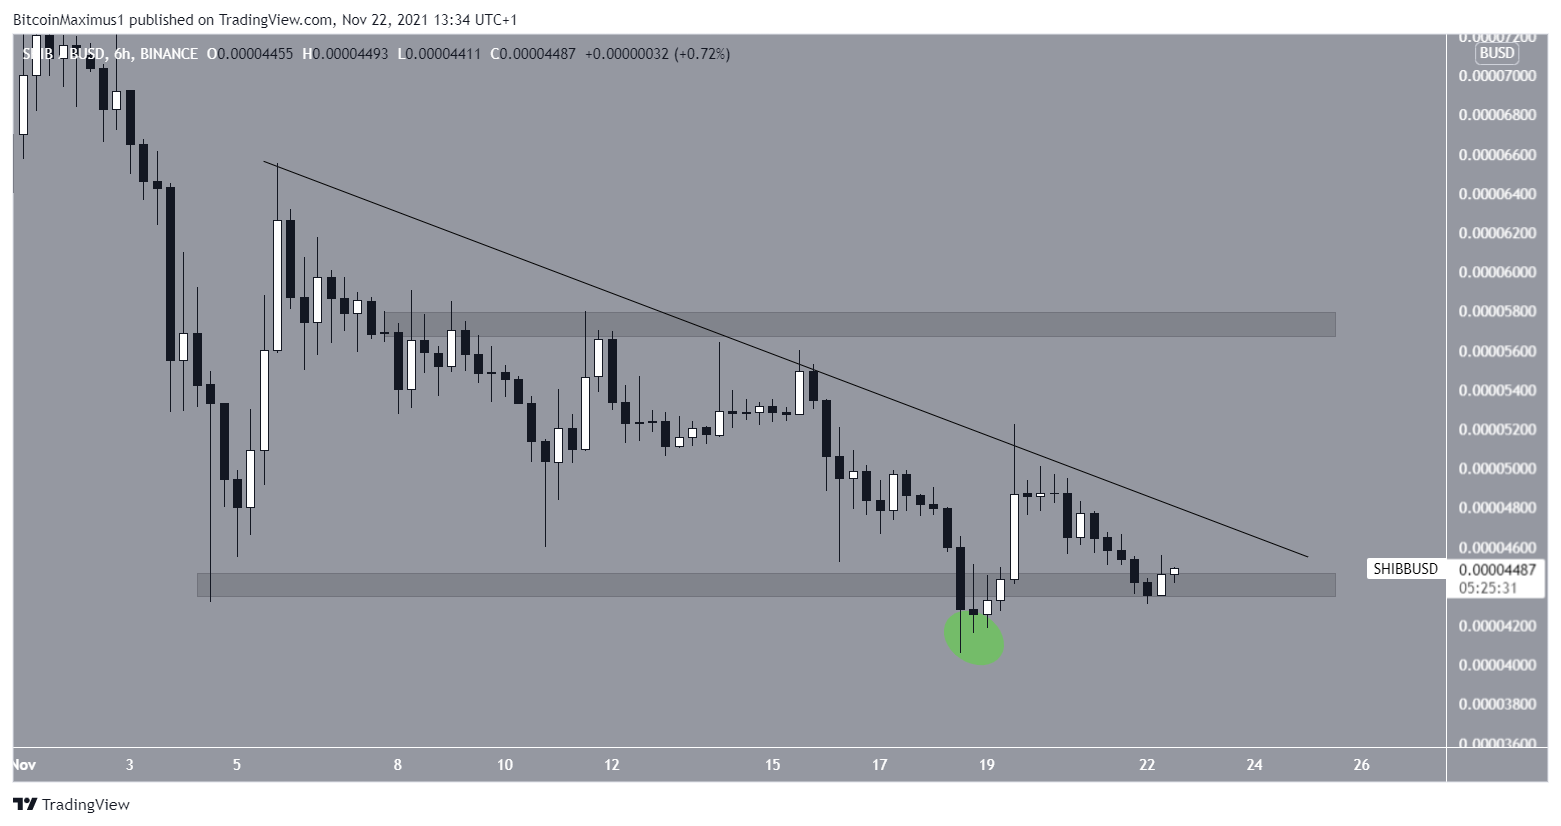
However, the shorter-term six-hour chart offers the opportunity for relief.
While SHIB initially broke down below the minor $0.000043 horizontal support area, it has reclaimed it since (green icon). This renders the previous breakout as a deviation only. Such occurrences are usually followed by upward movements in the other direction.
If a breakout occurs, the next resistance would be at $0.00057.
Despite this possibility being visible in short-term time-frames, the daily time-frame outlook remains bearish.
For BeInCrypto’s latest Bitcoin (BTC) analysis, click here.
What do you think about this subject? Write to us and tell us!


