


The Shiba Inu (SHIB) long-term pattern is still intact, but the price broke down from its short-term one on April 19.
The SHIB price is attempting to find support at its closest horizontal support level. Will it be able to do so, or will the downward movement accelerate even further?
Shiba Inu Price Consolidates in the Middle of Pattern
The daily time frame shows that the Shiba Inu price has traded inside a symmetrical triangle since June 2022. The symmetrical triangle is considered a neutral pattern. This means that both a breakout and breakdown are possible.
Currently, the price trades in the middle of the triangle, stuck in a downward movement that began after a rejection from the resistance line on Feb. 4 (red icon).
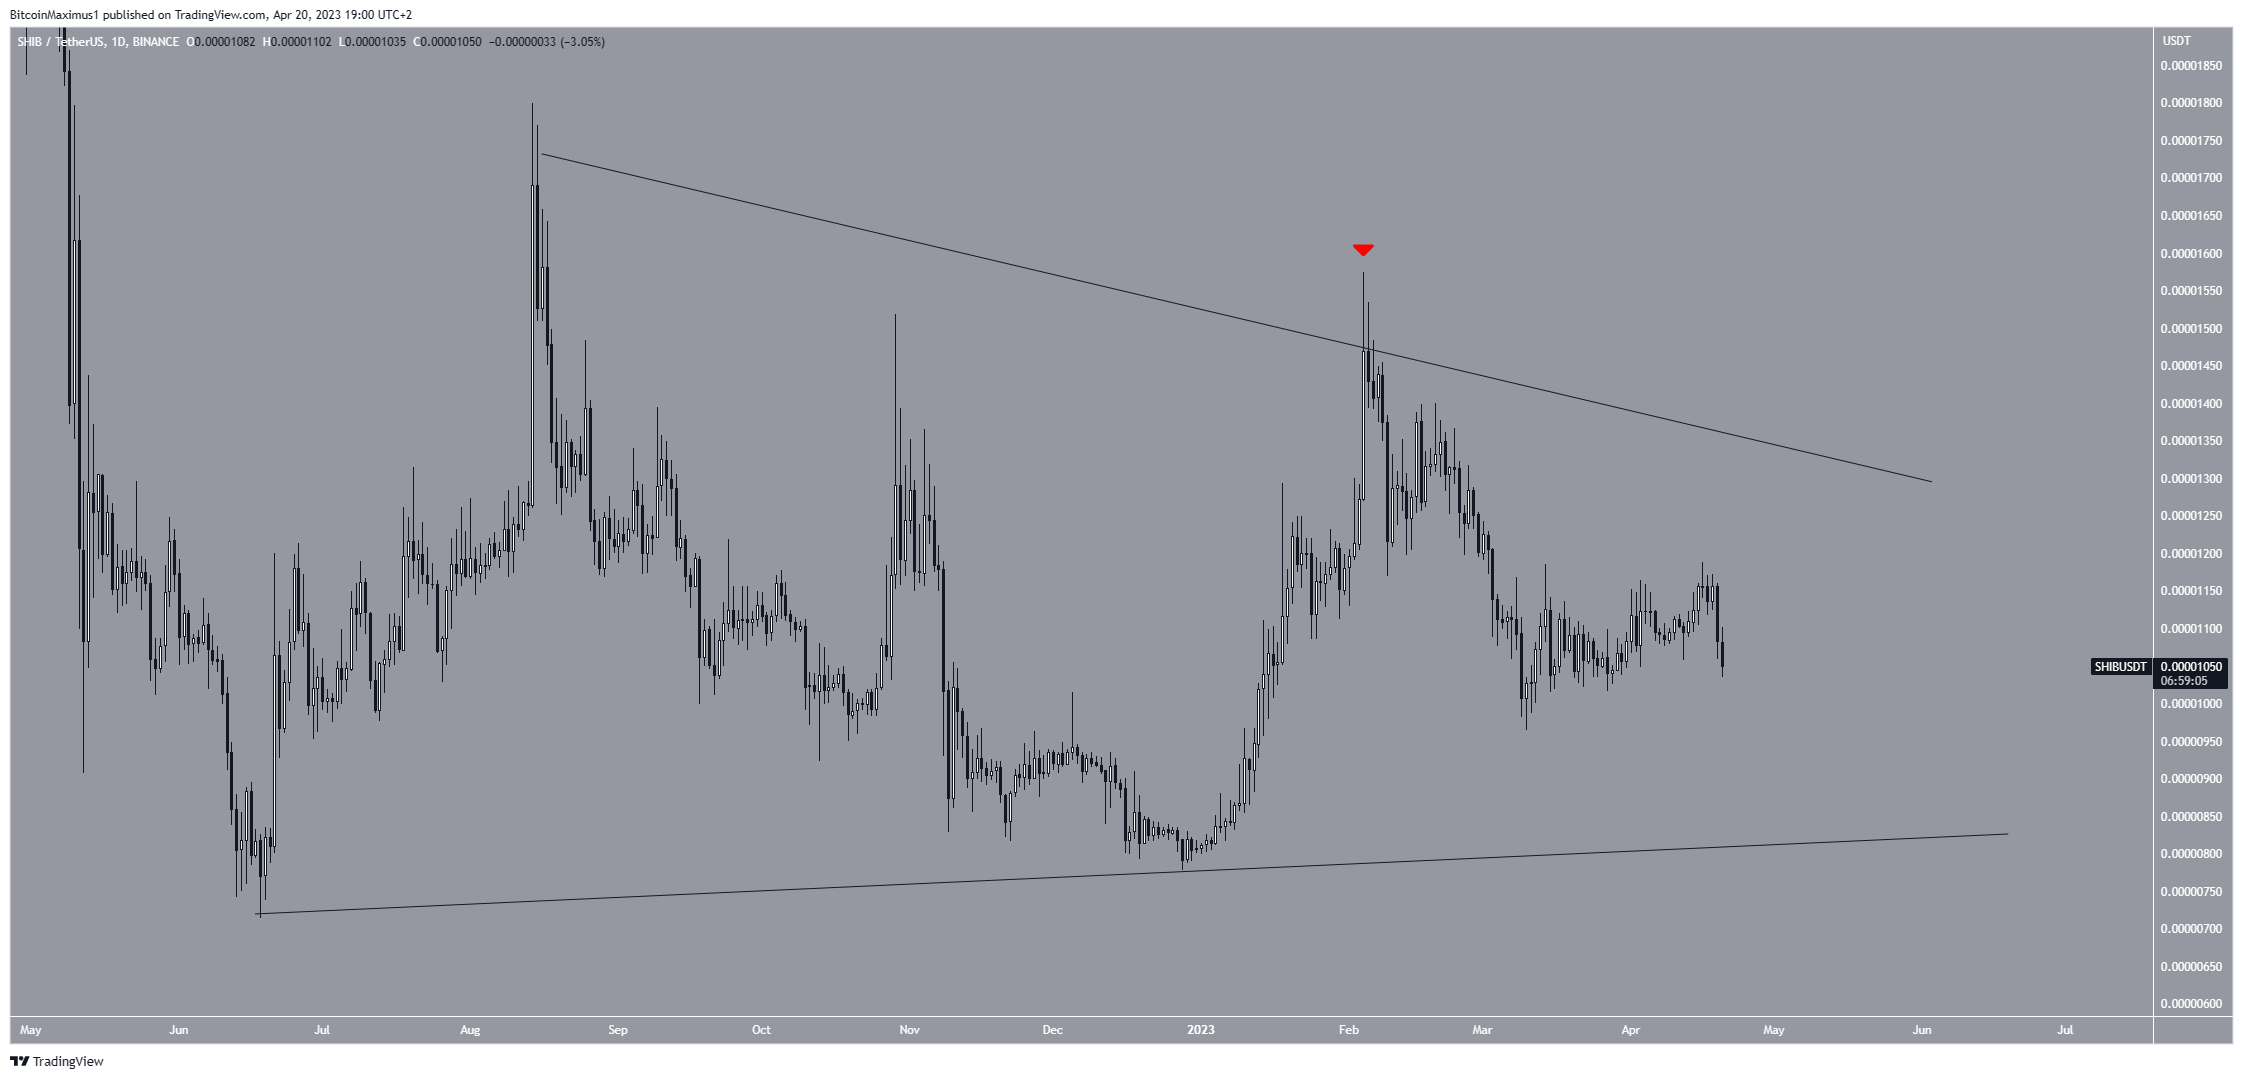
During the price action inside the triangle, the price bounces at both the resistance and support lines before an eventual decisive movement outside the pattern. If this remains true, SHIB will fall to the triangles support line at $0.0000085.
SHIB Price Prediction: More Downside Likely?
The technical analysis from the short-term six-hour time frame provides a bearish Shiba Inu coin price prediction. There are two reasons for this.
Firstly, the price broke down from an ascending parallel channel. The channel had contained the price action since March 12. Therefore, its breakdown indicates that the previous bullish structure is not in place anymore. Since the price broke down, the trend is likely bearish. Furthermore, the failure to reach the resistance line of the pattern (red icons) also suggests that the trend was weakening.
Secondly, the six-hour RSI is below 50 and decreasing. The RSI is a momentum indicator traders use to evaluate whether a market is overbought or oversold and to determine whether to accumulate or sell an asset. Readings above 50 and an upward trend suggest that bulls still have an advantage, while readings below 50 indicate the opposite. The current bearish reading supports the pattern breakdown, meaning that a drop to the $0.0000098 support area is likely. If it breaks down from there, the meme coin could fall to the long-term triangle’s support line.
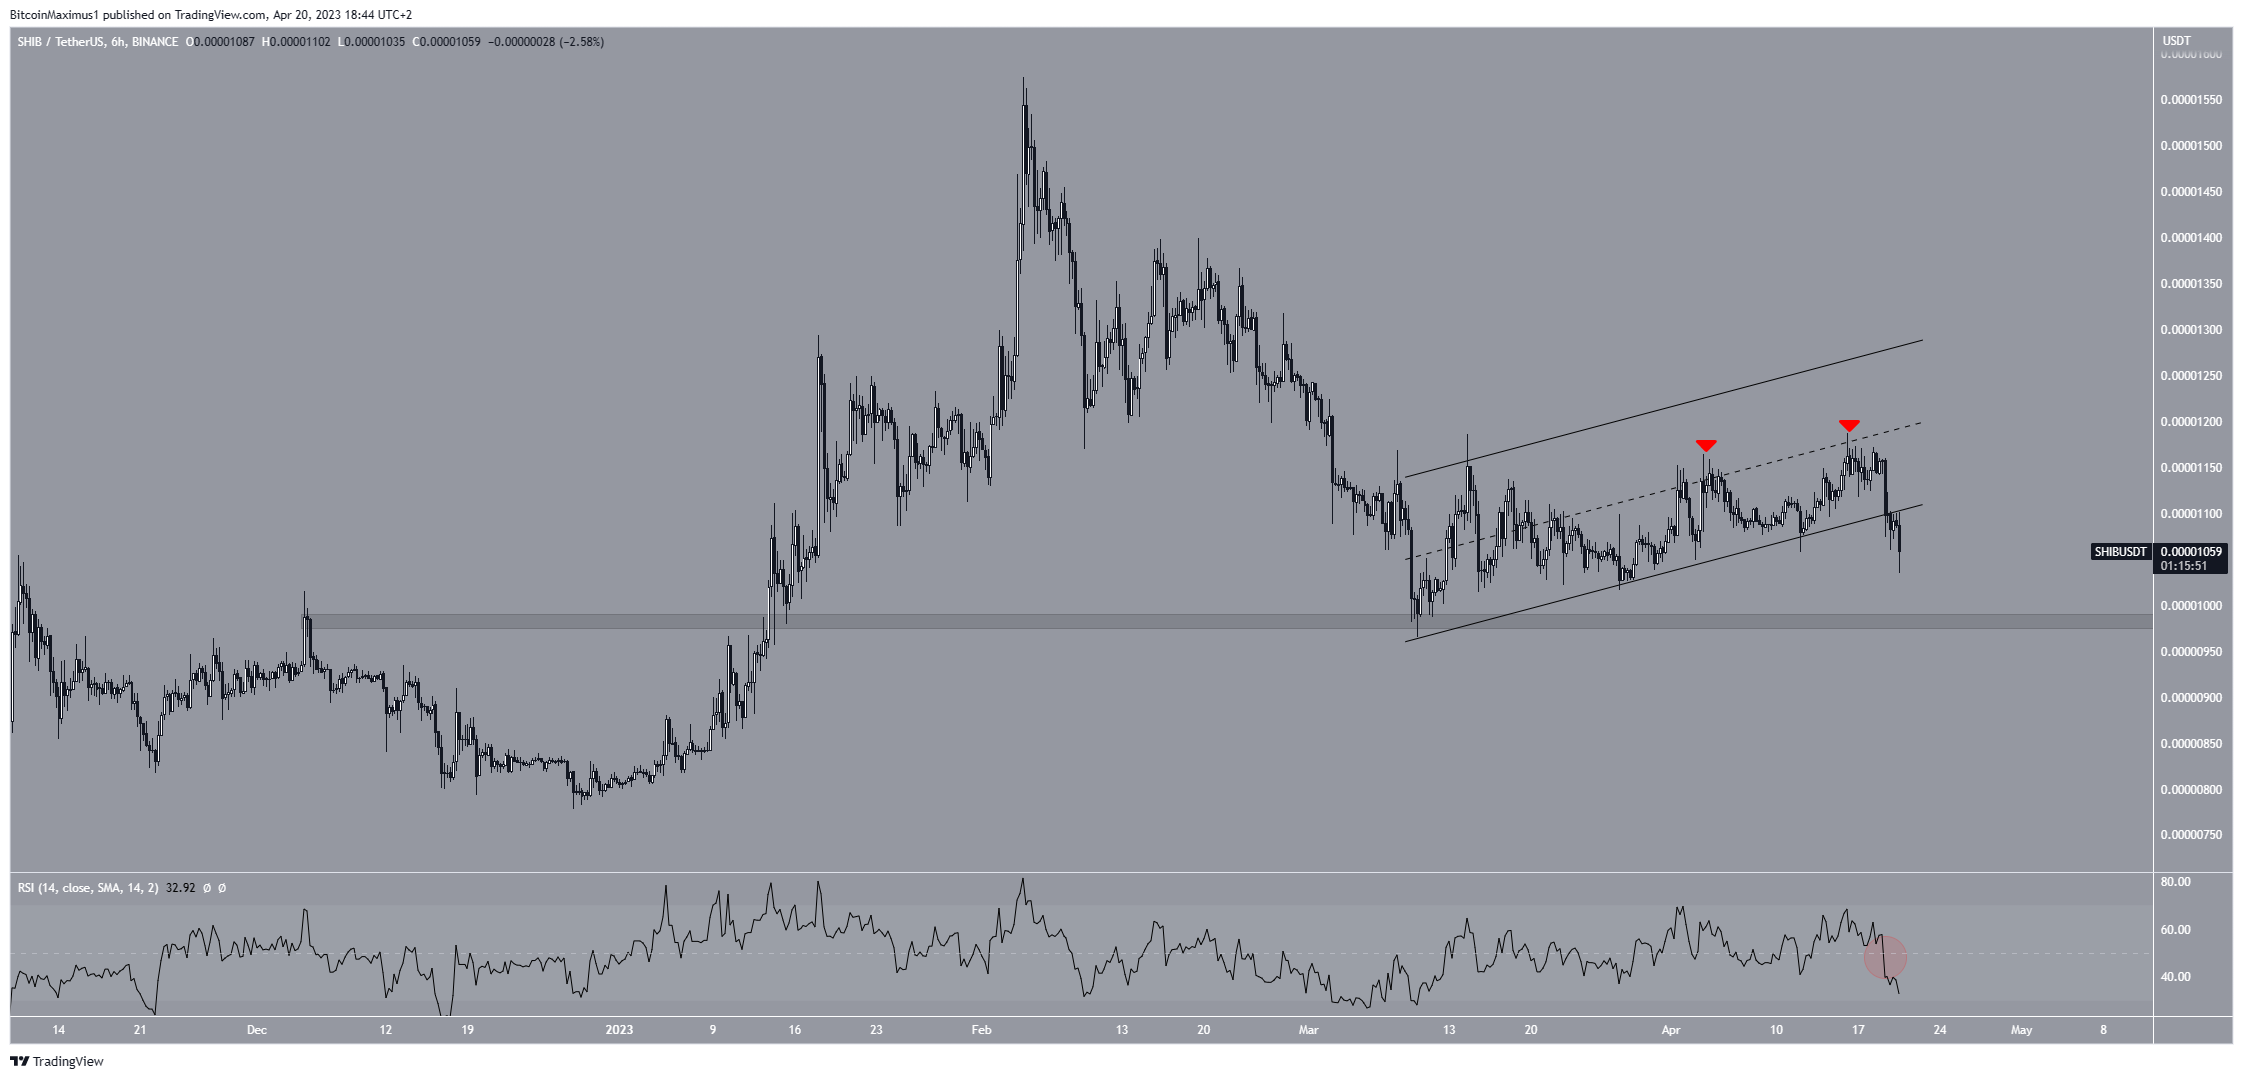
However, this bearish SHIB price prediction would be invalid if the price reclaims the channel’s support line. In that case, the most likely outlook would be an increase toward the resistance line at $0.0000130.
For BeInCrypto’s latest crypto market analysis, click here.



