
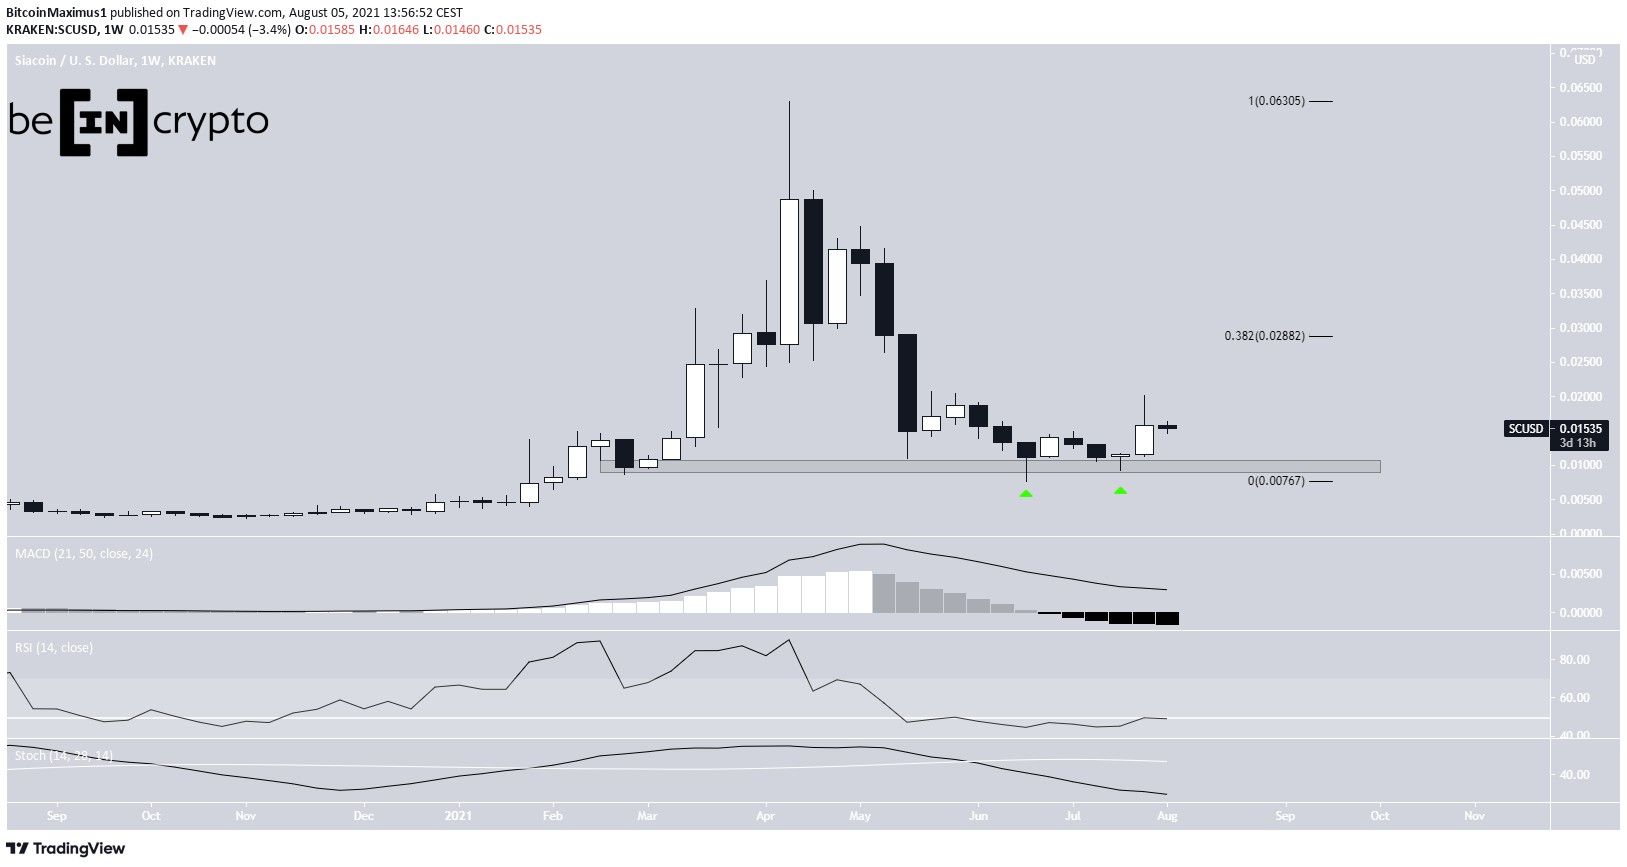
Siacoin (SC) has been decreasing since April but has bounced at the $0.01 horizontal support area.
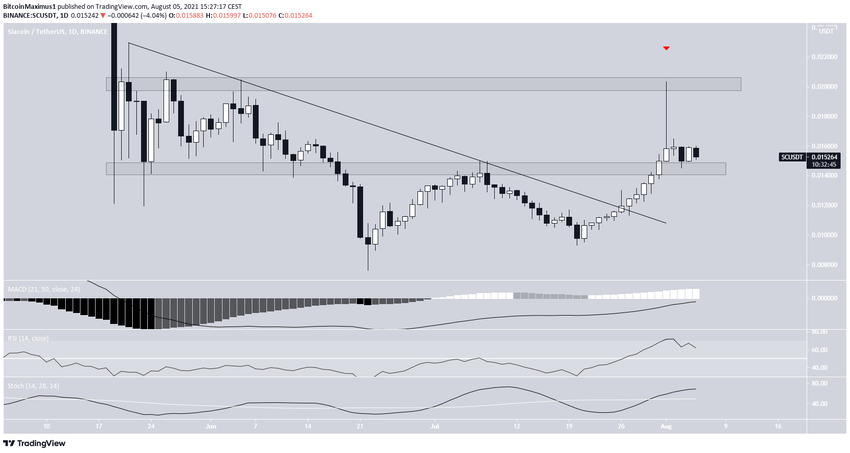
It broke out from a descending resistance line afterwards and is trading inside a range between $0.0145-$0.02.
SC bounces at support
SC has been moving downwards since reaching a high of $0.063 on April 17.
However, it seemingly stopped its descent by bouncing twice at the $0.01 horizontal resistance area. It did so on June 22 and July 21.
So far, it has reached a high of $0.02, doing so on Aug. 1.
Despite the bounce, technical indicators in the weekly time-frame are bearish. The Stochastic oscillator has made a bearish cross, the RSI is just below 50 and the MACD is decreasing.
The 0.382 Fib resistance level is at $0.029. This is the closest Fib resistance level.
Potential breakout
Cryptocurrency trader @TradingTank outlined a SC chart, stating that the token is in the process of breaking out from a descending wedge.
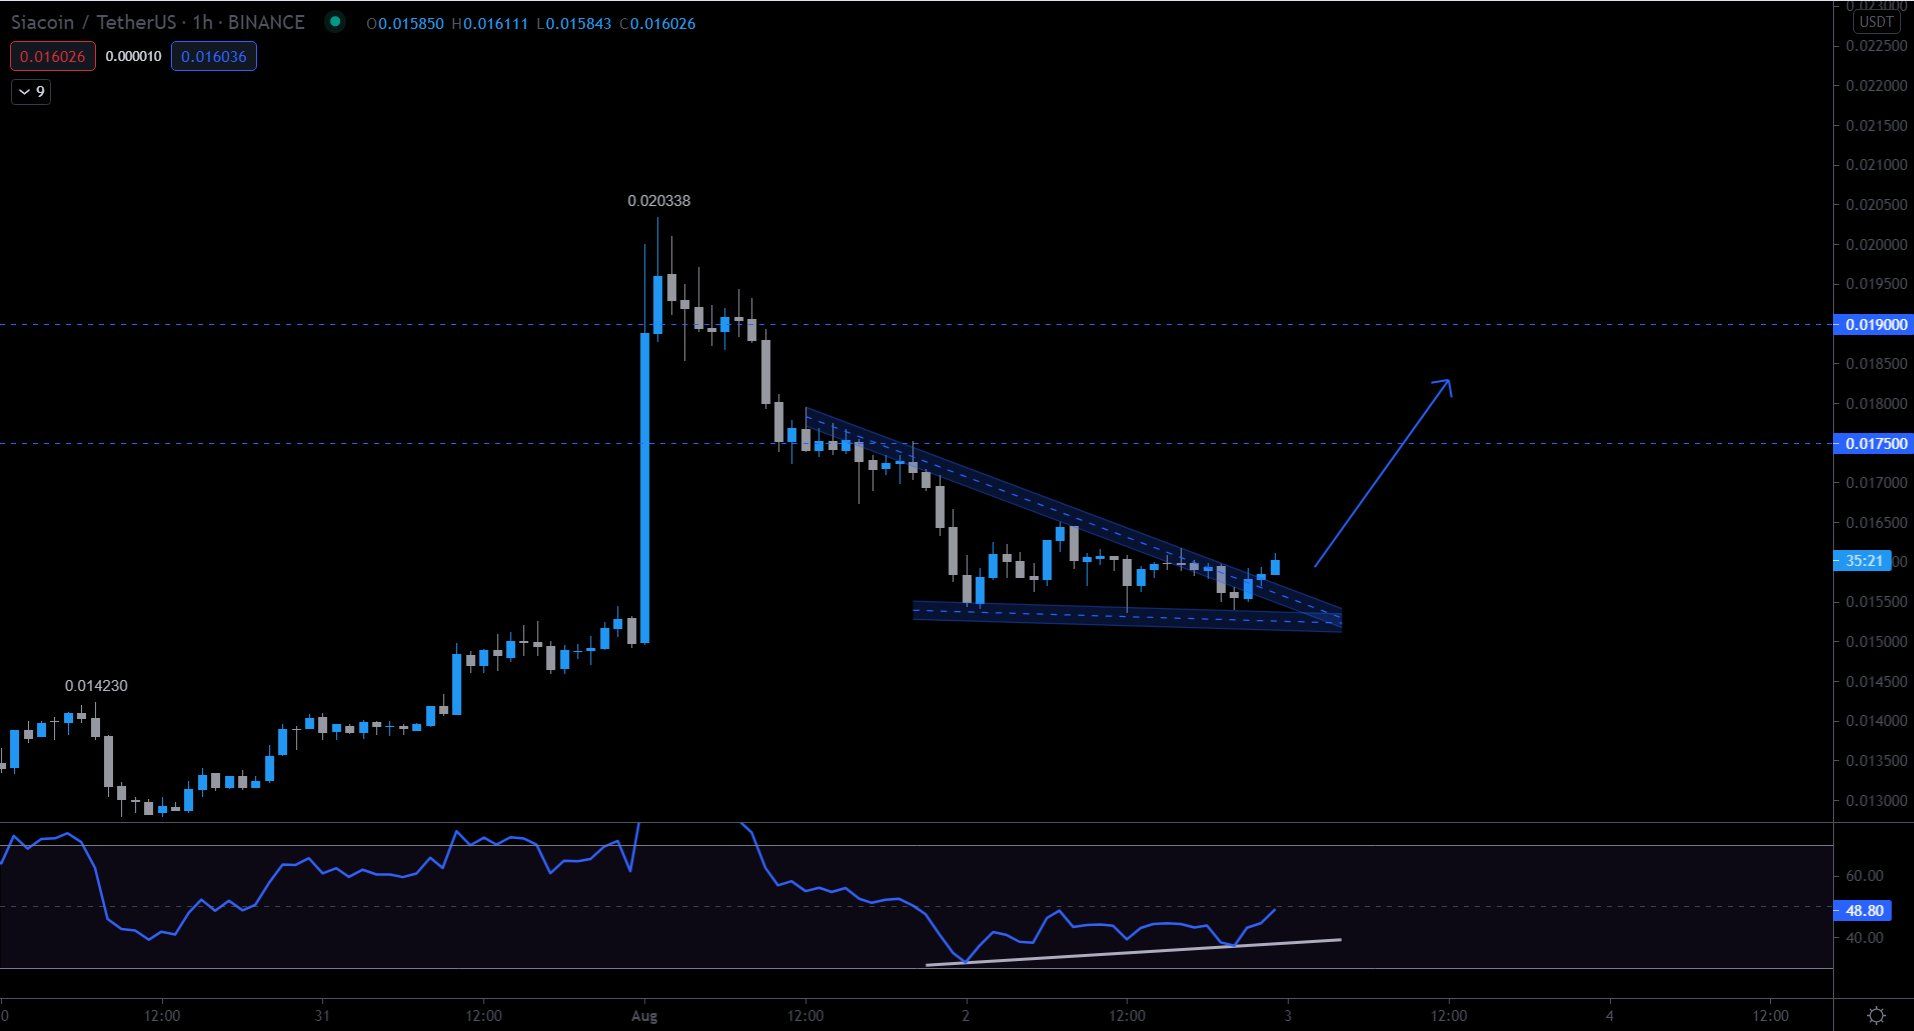
Since the tweet, it has broken out from the wedge and proceeded to reach a high of $0.02 on Aug. 1. However, this left a long upper wick in place (red icon) and validated the $0.02 area as resistance.
Since then, it has returned to the $0.0145 support area.
Unlike the weekly time-frame, technical indicators in the daily time-frame are bullish. The stochastic oscillator has made a bullish cross, the MACD is nearly positive and the RSI has nearly crossed above 70.
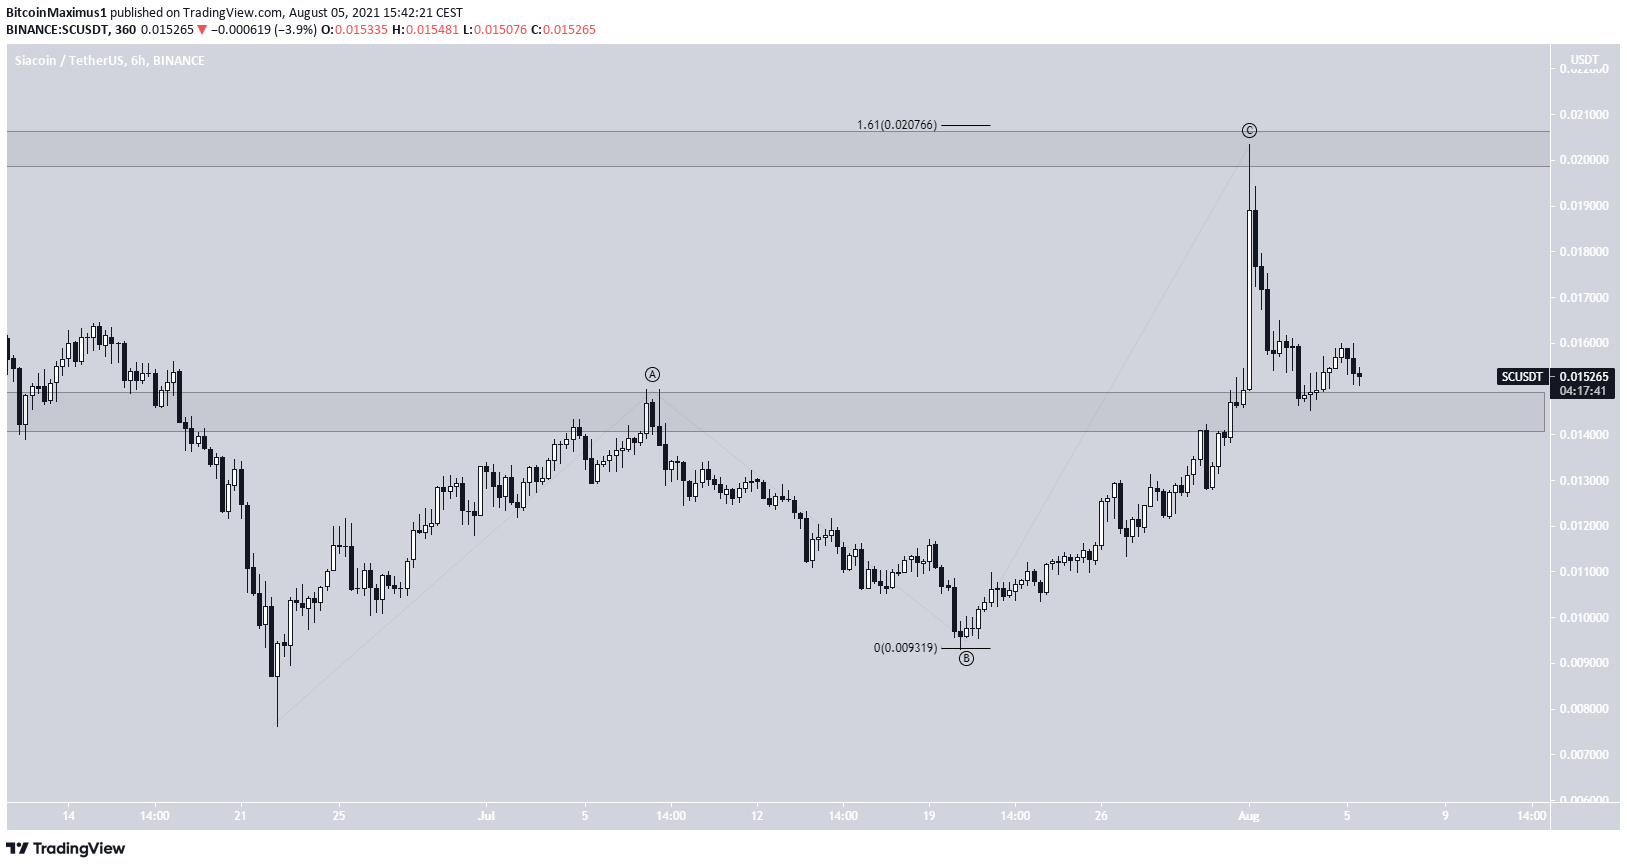
The entire upward movement could be an A-B-C corrective structure.
Besides being inside a resistance area, the $0.02 high was made at the 1.61 length of wave A. Furthermore, the ensuing rejection was sharp, akin to a new bearish impulse.
A breakdown from the $0.0145 area would confirm that the token is heading low.
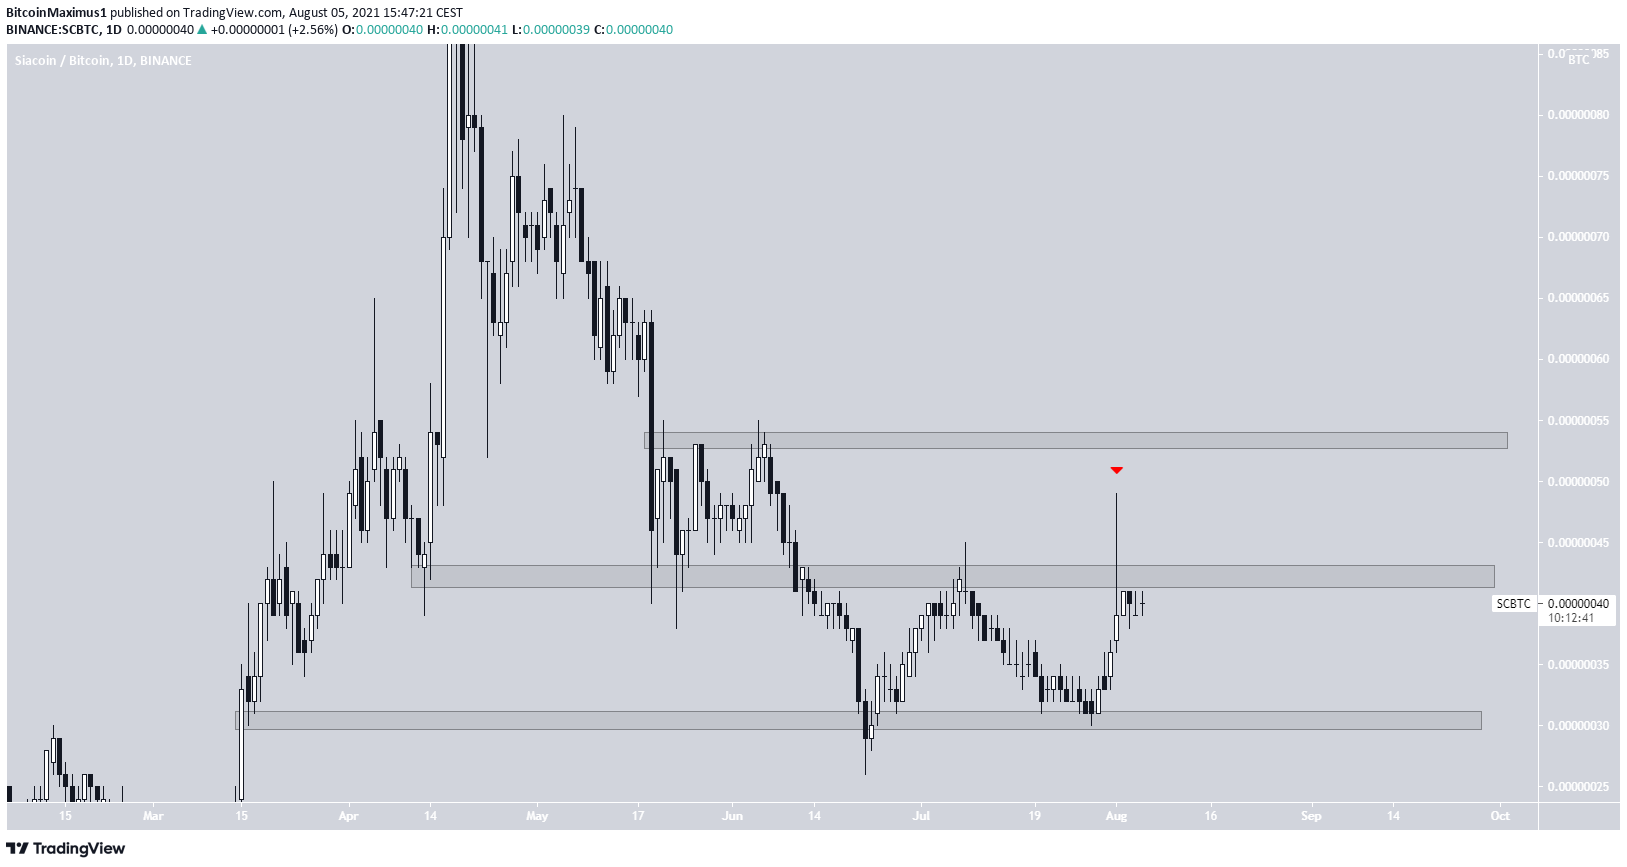
SC/BTC
The SC/BTC chart looks similar, with the token being rejected by the 42 satoshi area instead, creating a long upper wick (red icon).
While a breakout is possible, the most likely scenario would be a revisit of the 30 satoshi horizontal support area.
For BeInCrypto’s latest bitcoin (BTC) analysis, click here.
