


Both The Sandbox (SAND) and Decentraland (MANA) have completed corrective structures and have bullish-looking price formations in place.
Even though the Metaverse has been heralded as a new digital frontier, things have not gone smoothly over the last few months. This is especially visible in the decreased revenue of Decentraland, a virtual world where users use the Decentraland marketplace to trade virtual assets such as plots of land as non-fungible tokens (NFT). As a result, Artificial Intelligence is becoming the main novelty in the tech world.
However, the prices of both MANA and SAND show bullish signs that could lead to a recovery in the near future.
Will Decentraland (MANA) Price Finally Reclaim Resistance
The Decentraland price had decreased inside a descending parallel channel since Feb. 2. Such channels usually contain corrective movements, meaning a bullish breakout would be expected.
On April 1, the MANA token price broke out from the channel. This succeeded a RSI breakout from its bearish divergence trendline (green line). However, the price failed to move above the $0.61 resistance area. Doing so is required for the trend to be considered bullish.
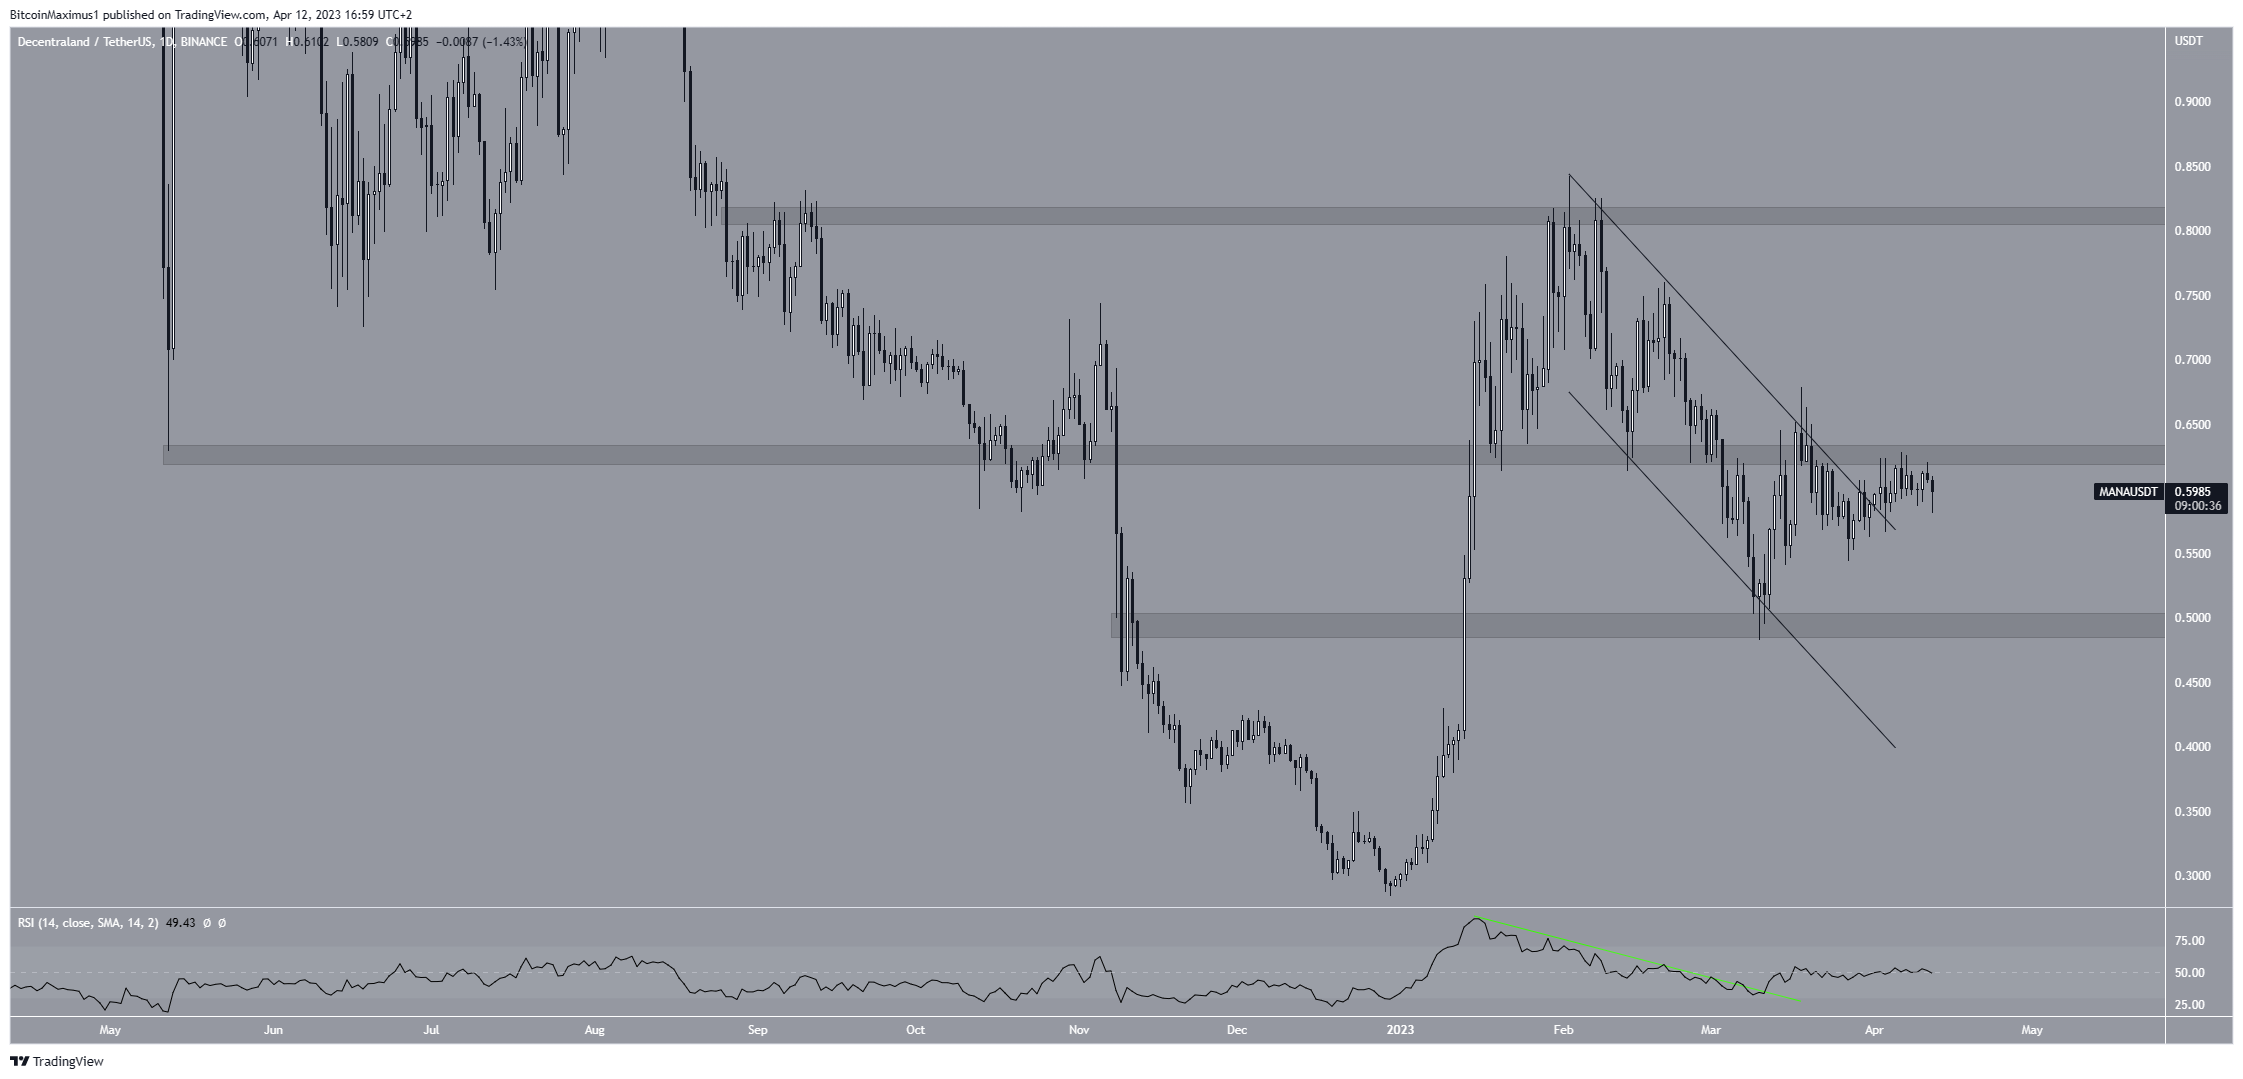
Even though the daily RSI has not moved above 50, the completed A-B-C correction (black) inside the channel suggests that a breakout from the $0.61 area is more likely than a rejection. In that case, the MANA price could increase to $0.82.
However, if a rejection occurs instead, a drop to the $0.50 support could follow.
The Sandbox (SAND) Price Breaks Out – New Highs Incoming?
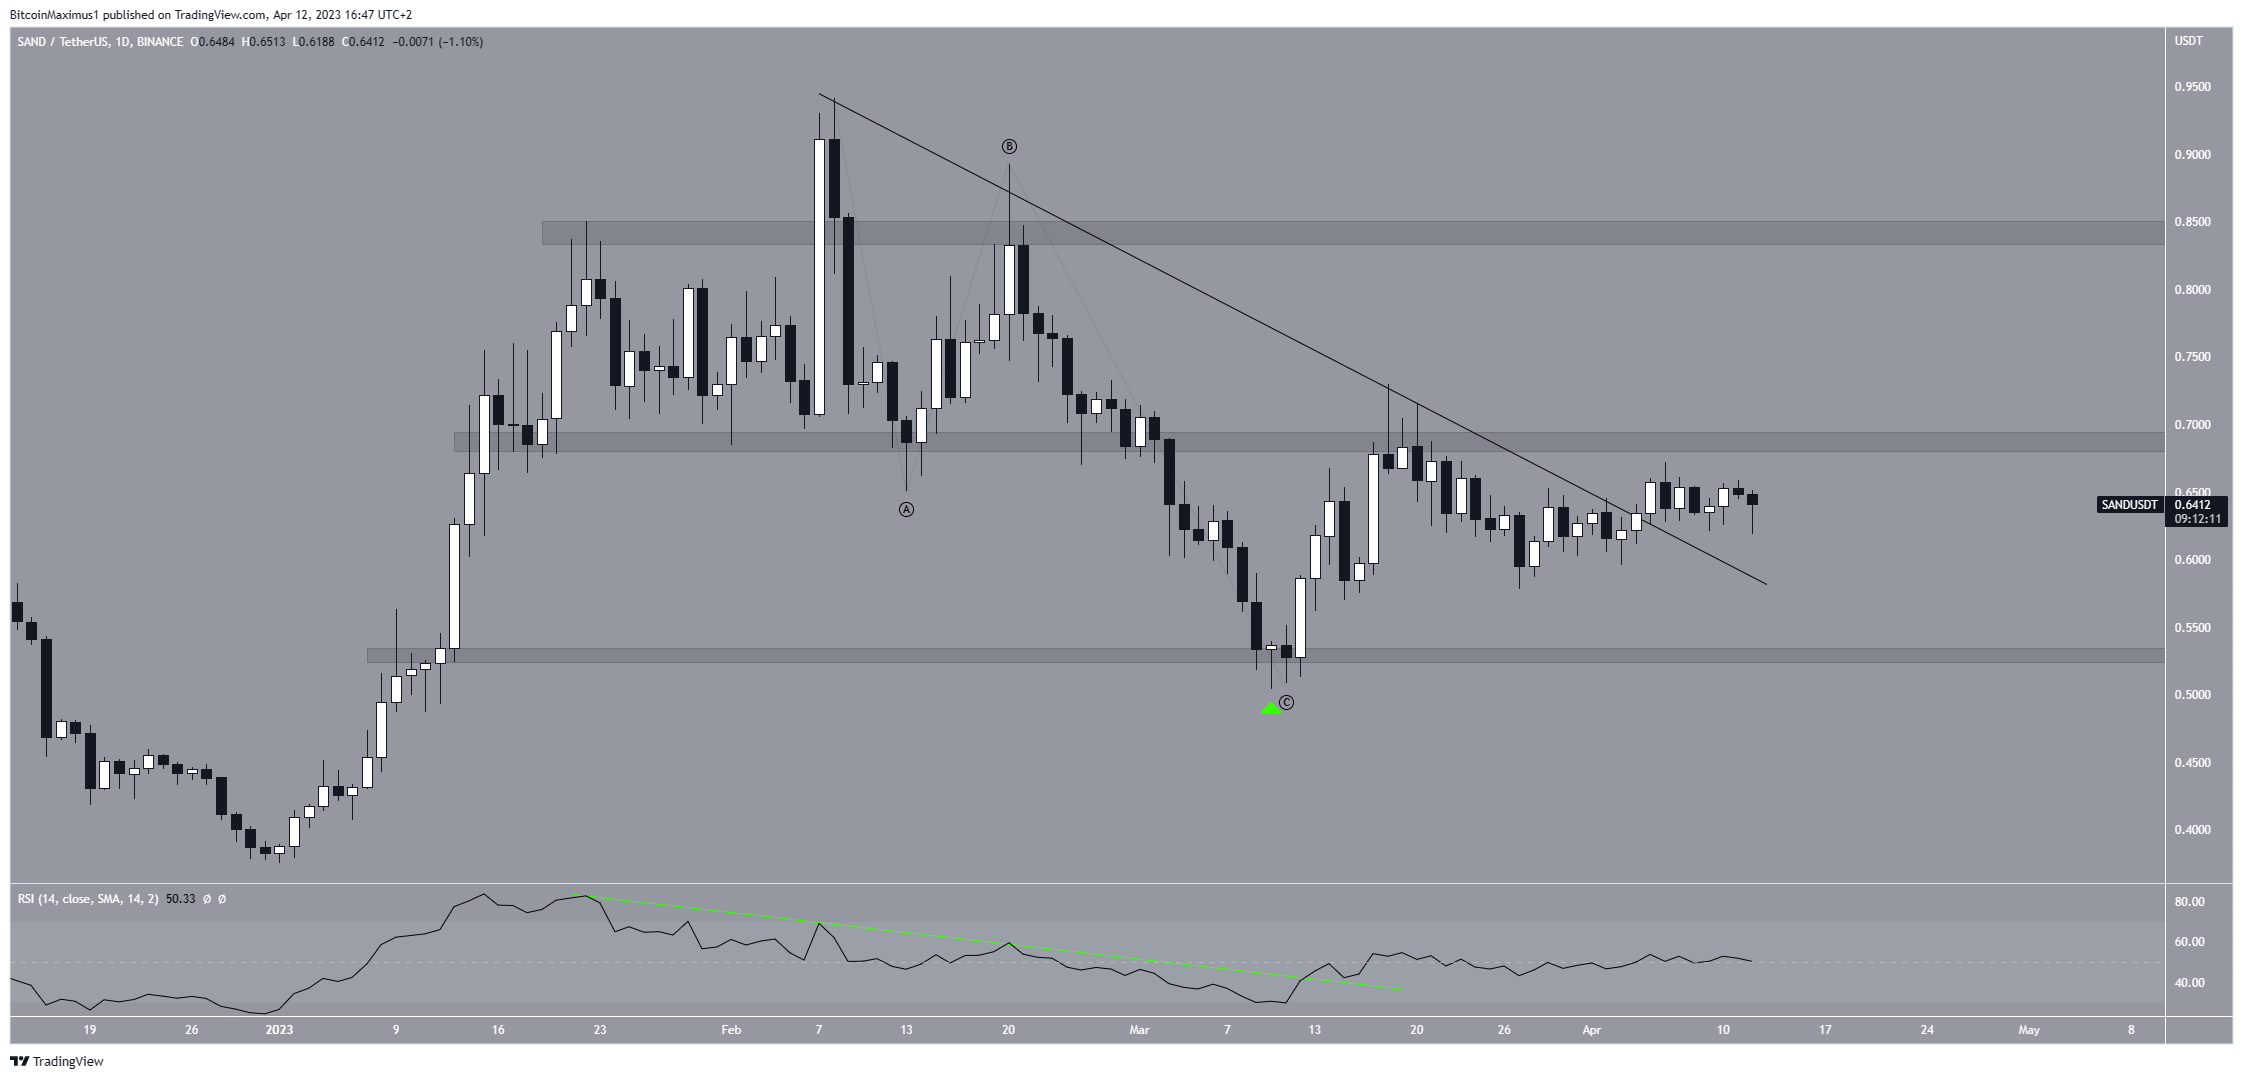
The technical analysis from the daily time frame shows that the Sandbox price has increased since March 11, when it bounced at the $0.53 horizontal support area (green icon). Shortly afterward, the daily RSI broke out from its bearish divergence trendline (green line). This is a sign that often precedes price breakouts.
As expected, the SAND price broke out from a descending resistance line on April 4. However, despite the breakout, it has yet to begin its rapid portion of the increase.
If the upward movement continues, there will be strong resistance at $0.69. This is the final resistance area before the $0.84 high. However, if the rally loses momentum, the SAND token price could fall to the descending resistance line and possibly drop to the $0.53 horizontal support region.
Similarly to MANA, the daily RSI is slightly above 50, a sign of an undetermined trend. However, the completed A-B-C correction and breakout from the resistance line make a breakout slightly more likely.
To conclude, SAND and MANA price trend is bullish, and an increase is expected in April. A rejection from their closest resistance areas could invalidate this bullish forecast and trigger a sharp drop.


