
On May 30, the Ripple price (XRP) reached a high of $0.474. A rapid decrease began the next day and the price reached a low of $0.40. After a gradual increase, the price began another downward move.
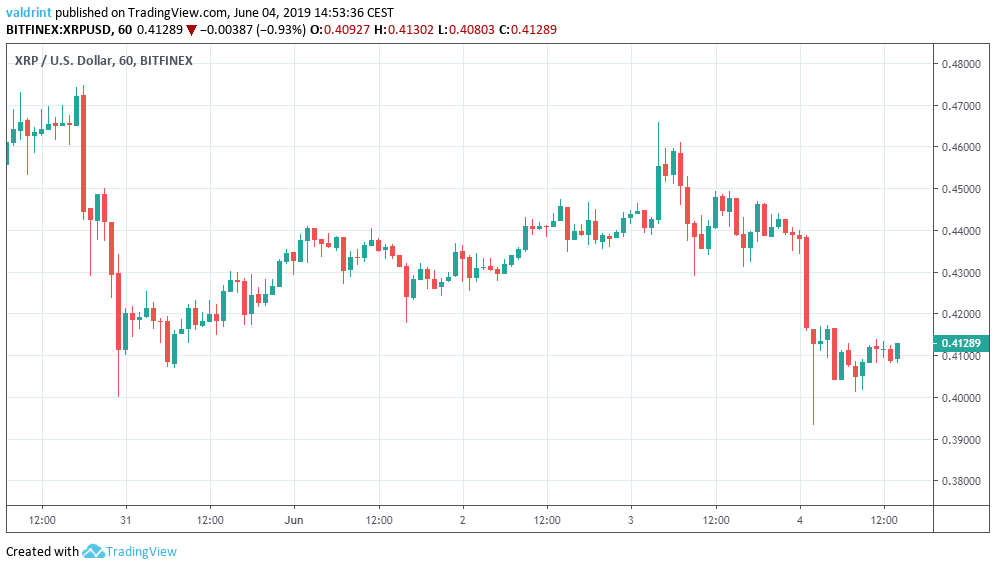
Will XRP stay above $0.4? Keep reading in order to find out.
Ripple Price (XRP): Trends and Highlights for June 4
- The price of XRP reached a high on May 30.
- It broke down from an ascending channel on Jun 4.
- There is bearish divergence developing in the RSI and the MACD.
- The price has made a possible double top pattern.
- There is resistance near $0.45.
- There is support near $0.37.
Ripple (XRP) in an Ascending Channel
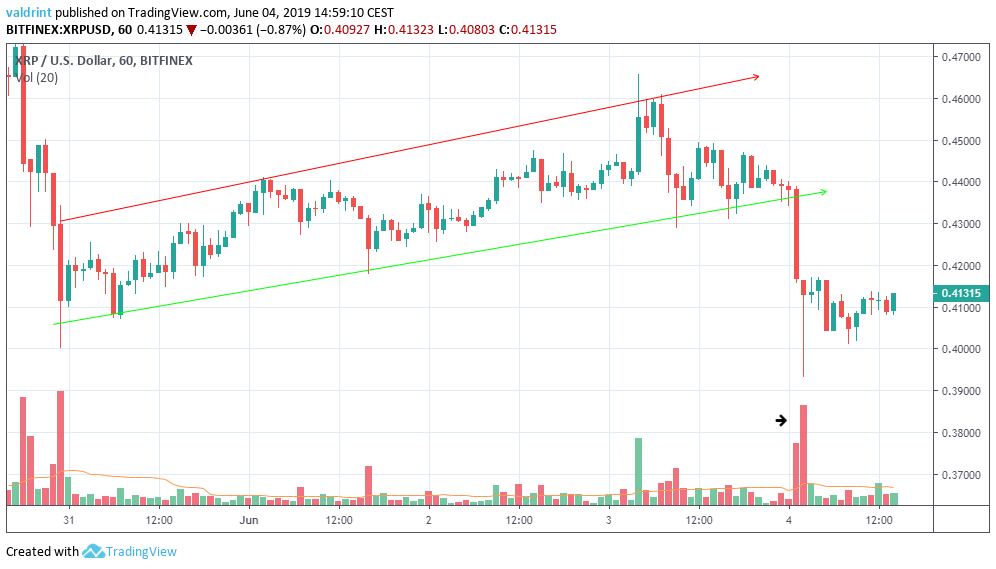
The price broke down from the channel on Jun 4. The breakdown occurred with significant volume.
The Ripple (XRP) price briefly traded below $0.4 before rebounding.
Where will it go next? Let’s take a look at some technical indicators and try to answer.
Bearish Divergence
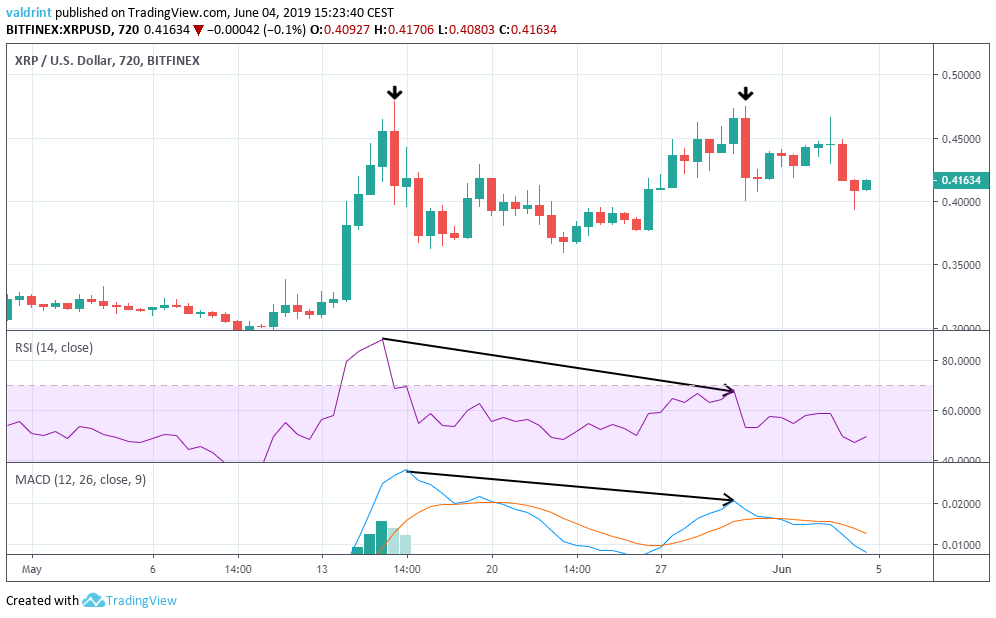
In yesterday’s analysis, we stated that:
Both the RSI and the MACD reached the first high on May 15. However, they have both generated lower values since. This is known as bearish divergence and often precedes drops in price.
Furthermore, it seems as if the price has created a double top, which is a bearish reversal pattern.
The use of these indicators makes it likely that the price will decrease. In the short-term, a breakdown from the ascending channel is likely.
As seen above, the breakdown from the ascending channel already occurred. However, the double top pattern took close to 15 days to materialize. Therefore, it is likely that this is not the end of the downward move.
Reversal Areas
One support area and one resistance area is traced for Ripple (XRP) below.
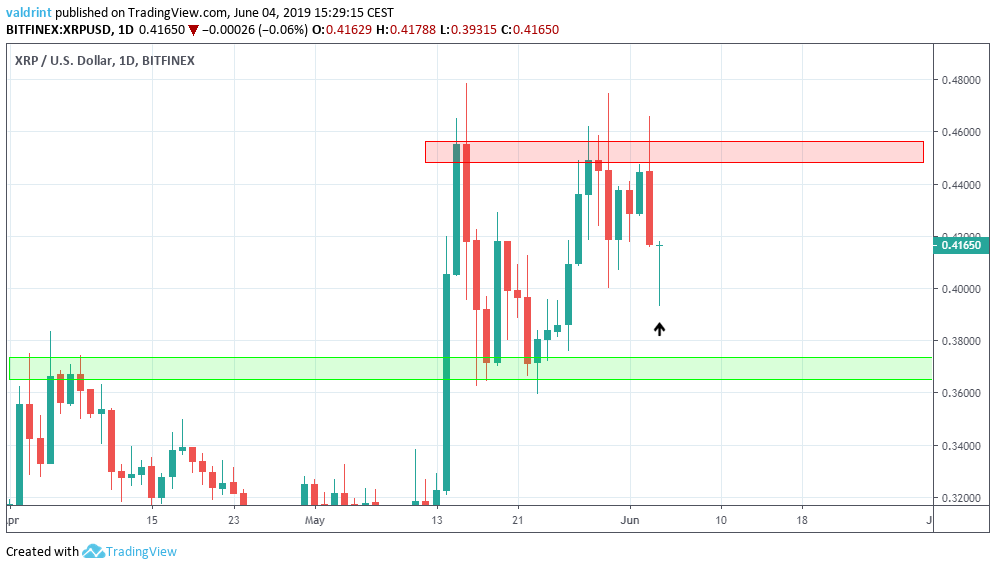
The closest support area is found near $0.37. If the double top pattern proves to be correct, the Ripple price (XRP) will eventually reach this area. The analysis of technical indicators supports this claim.
The closest resistance area is found near $0.45. A significant increase against the current trend would be required for the price to reach this area. Currently, there are no technical signs pointing towards this scenario. However, if the current daily candle closes above $0.415, it would create a hammer, which is a bullish reversal candlestick.
Summary
To conclude, the Ripple price (XRP) recently broke down from an ascending channel. Furthermore, it has created a double top pattern in long-term timeframes. This bearish reversal pattern, combined with the readings from technical indicators makes it likely that the price will decrease and eventually reach the support area outlined above.
What do you think will happen to the price of XRP? Let us know in the comments below.
Disclaimer: This article is not trading advice and should not be construed as such. Always consult a trained financial professional before investing in cryptocurrencies, as the market is particularly volatile.
