


Ripple (XRP) price has been largely observing a downtrend after posting the year-to-date highs last month.
However, by the looks of it, this downtrend will likely continue going forward, as indicated by these investors.
Ripple Loses Institutional Interest
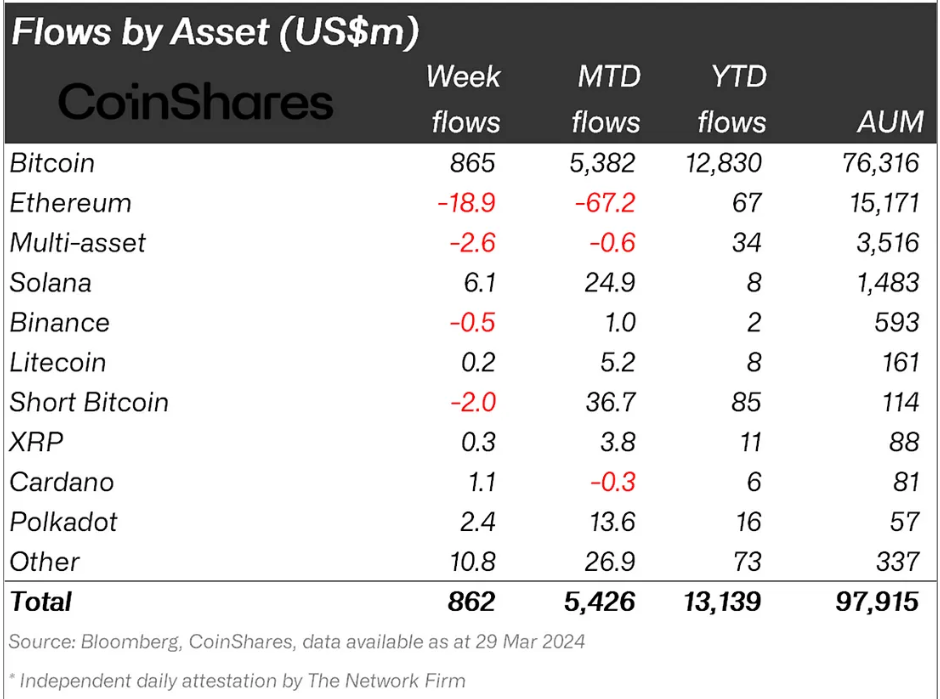
XRP price over the past year was largely affected by the inflows and outflows of the institutional investment. This year, however, the situation is significantly different. Ripple can be seen losing interest of these institutions, which has seemingly shifted to other altcoins, according to the CoinShares report.
The likes of Polkadot (DOT) and Solana (SOL) have noted much higher inflows over the past month than XRP. DOT inflows amounted to $13.6 million for the month of March; SOL noted $24.9 million flowing in from institutions, while XRP stood at just $3.8 million.
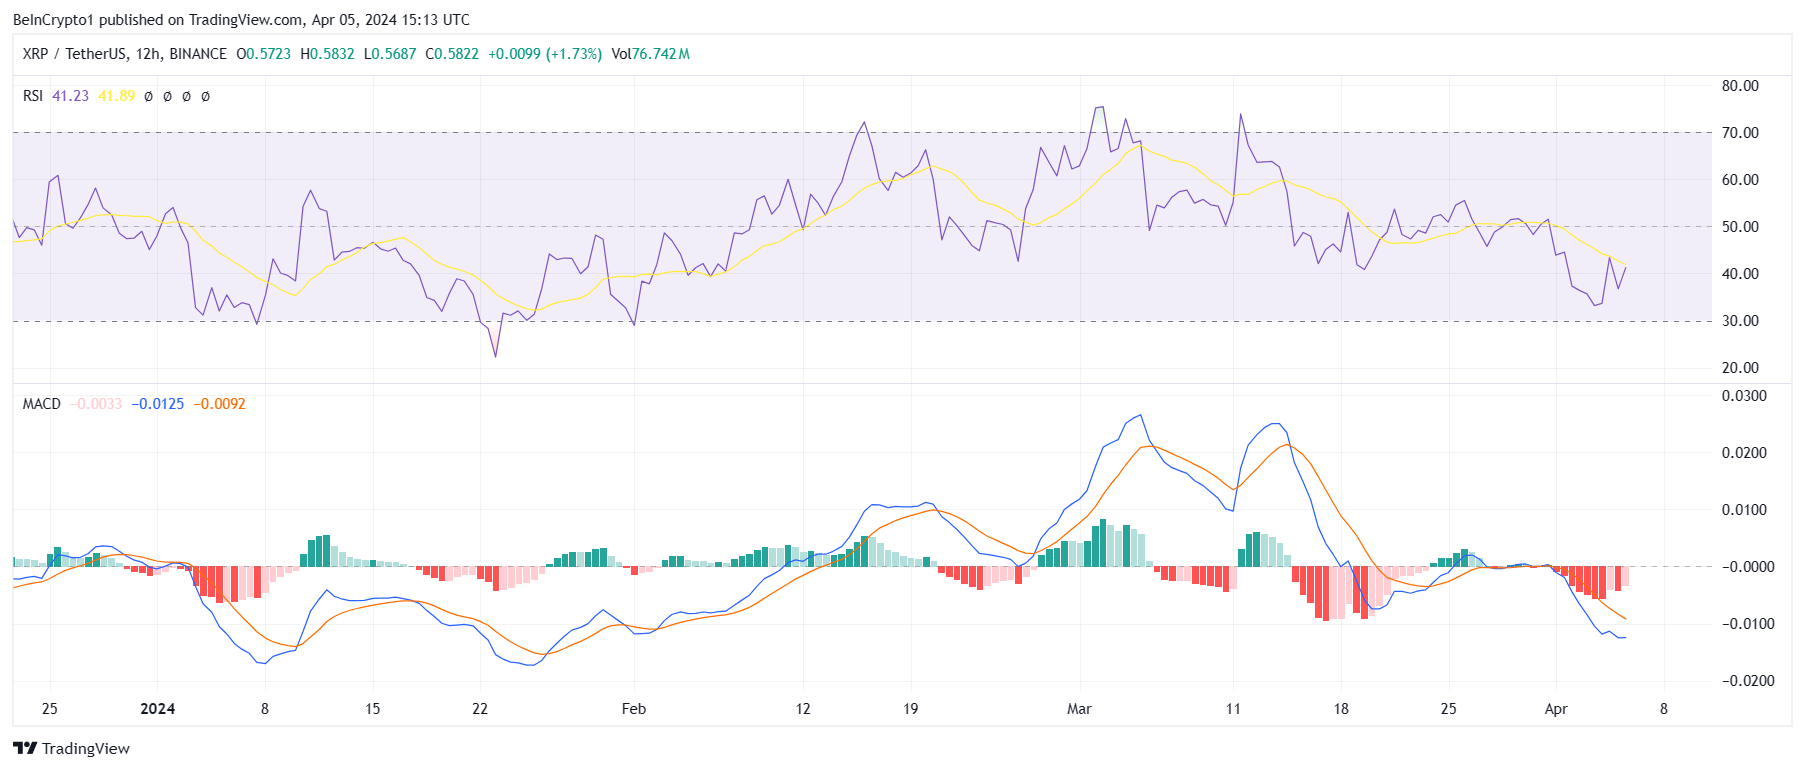
This bearishness is also reflected in the price indicators Relative Strength Index (RSI) and Moving Average Convergence Divergence (MACD).
RSI is a momentum oscillator measuring the speed and change of price, indicating overbought and oversold conditions. MACD, on the other hand, is a trend-following momentum indicator that is used to identify bullish and bearish trends.
Both are currently in their respective bearish zones and could continue to remain there, given the threat of a death cross on XRP.
XRP Price Prediction: Death Cross
XRP price trading at $0.58 is noting the formation of a death cross on the 12-hour chart. A death cross is bearish and occurs when a short-term 50-day Exponential Moving Average (EMA) crosses below a long-term 200-day EMA.
This signals a potential shift to a bearish trend for XRP, which might fail to reclaim $0.58 as support and drop to $0.54.
Read More: Ripple (XRP) Price Prediction 2024/2025/2030
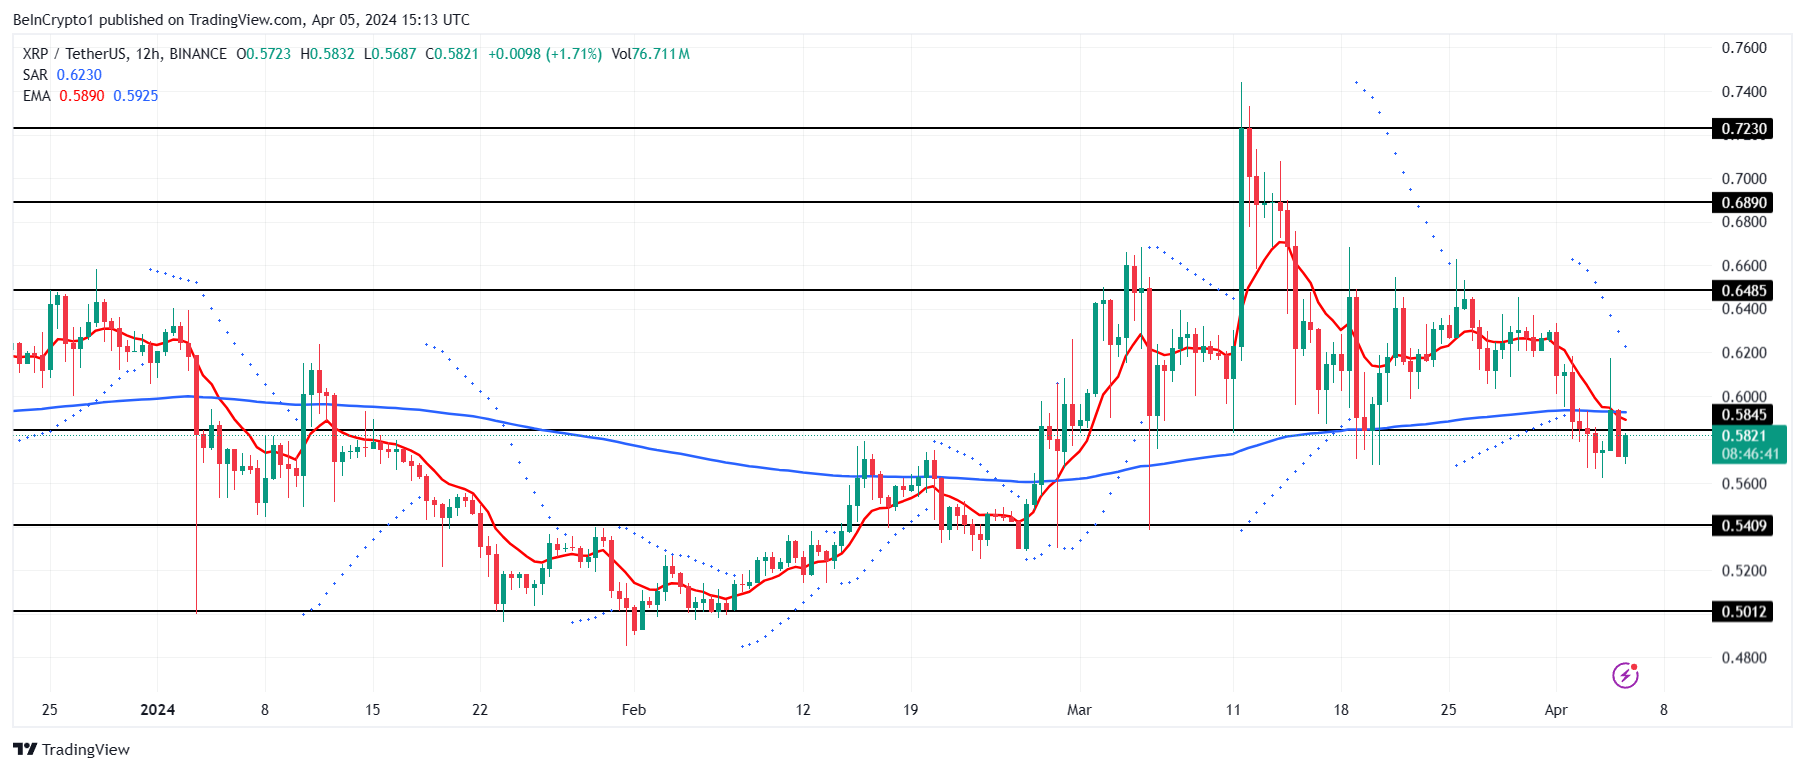
But if the $0.58 level is flipped into a support floor, the XRP would be able to climb back beyond $0.60 to invalidate the bearish thesis.


