


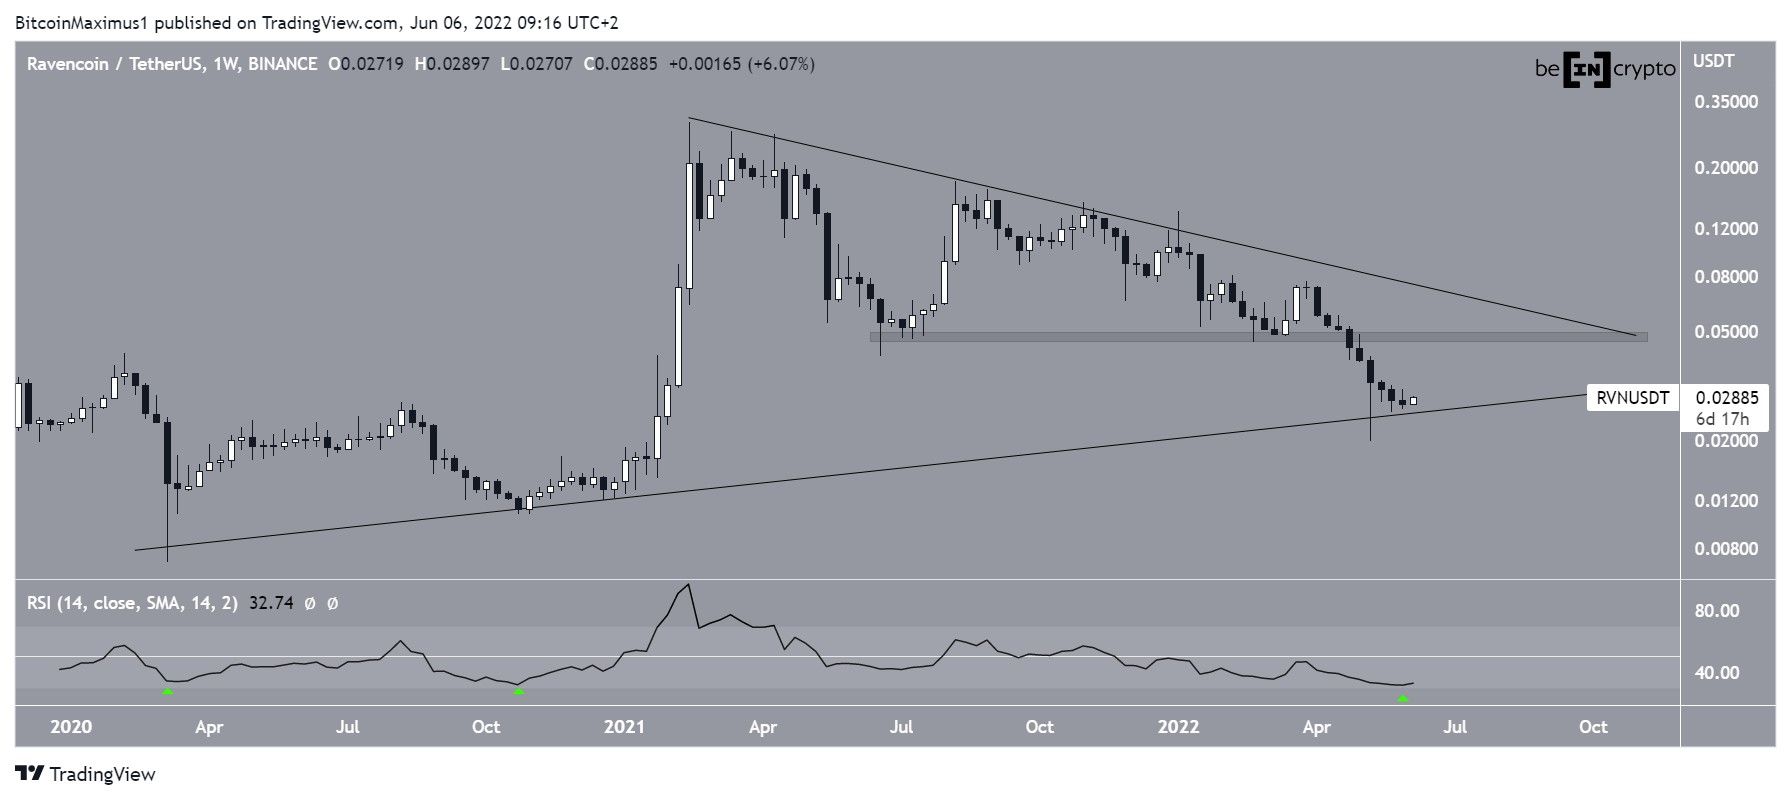
After breaking down from a long-term horizontal support level, Ravencoin (RVN) reached a low of $0.019 and validated an even longer-term ascending support line.
RVN has been falling since reaching an all-time high price of $0.29 on Feb. 2021. The downward movement has been contained underneath a descending resistance line. More recently, the line caused a rejection on Jan. 2022.
Afterward, RVN broke down below the $0.048 area, which had previously been acting as support since July 2021. This accelerated the rate of decrease and led to a low of $0.019 in May 2022.
The ensuing bounce served to validate a long-term ascending support line that has been in place since March 2020.
Additionally, the weekly RSI gave a reading of 30, a level that has previously been associated with bottoms (green icons).
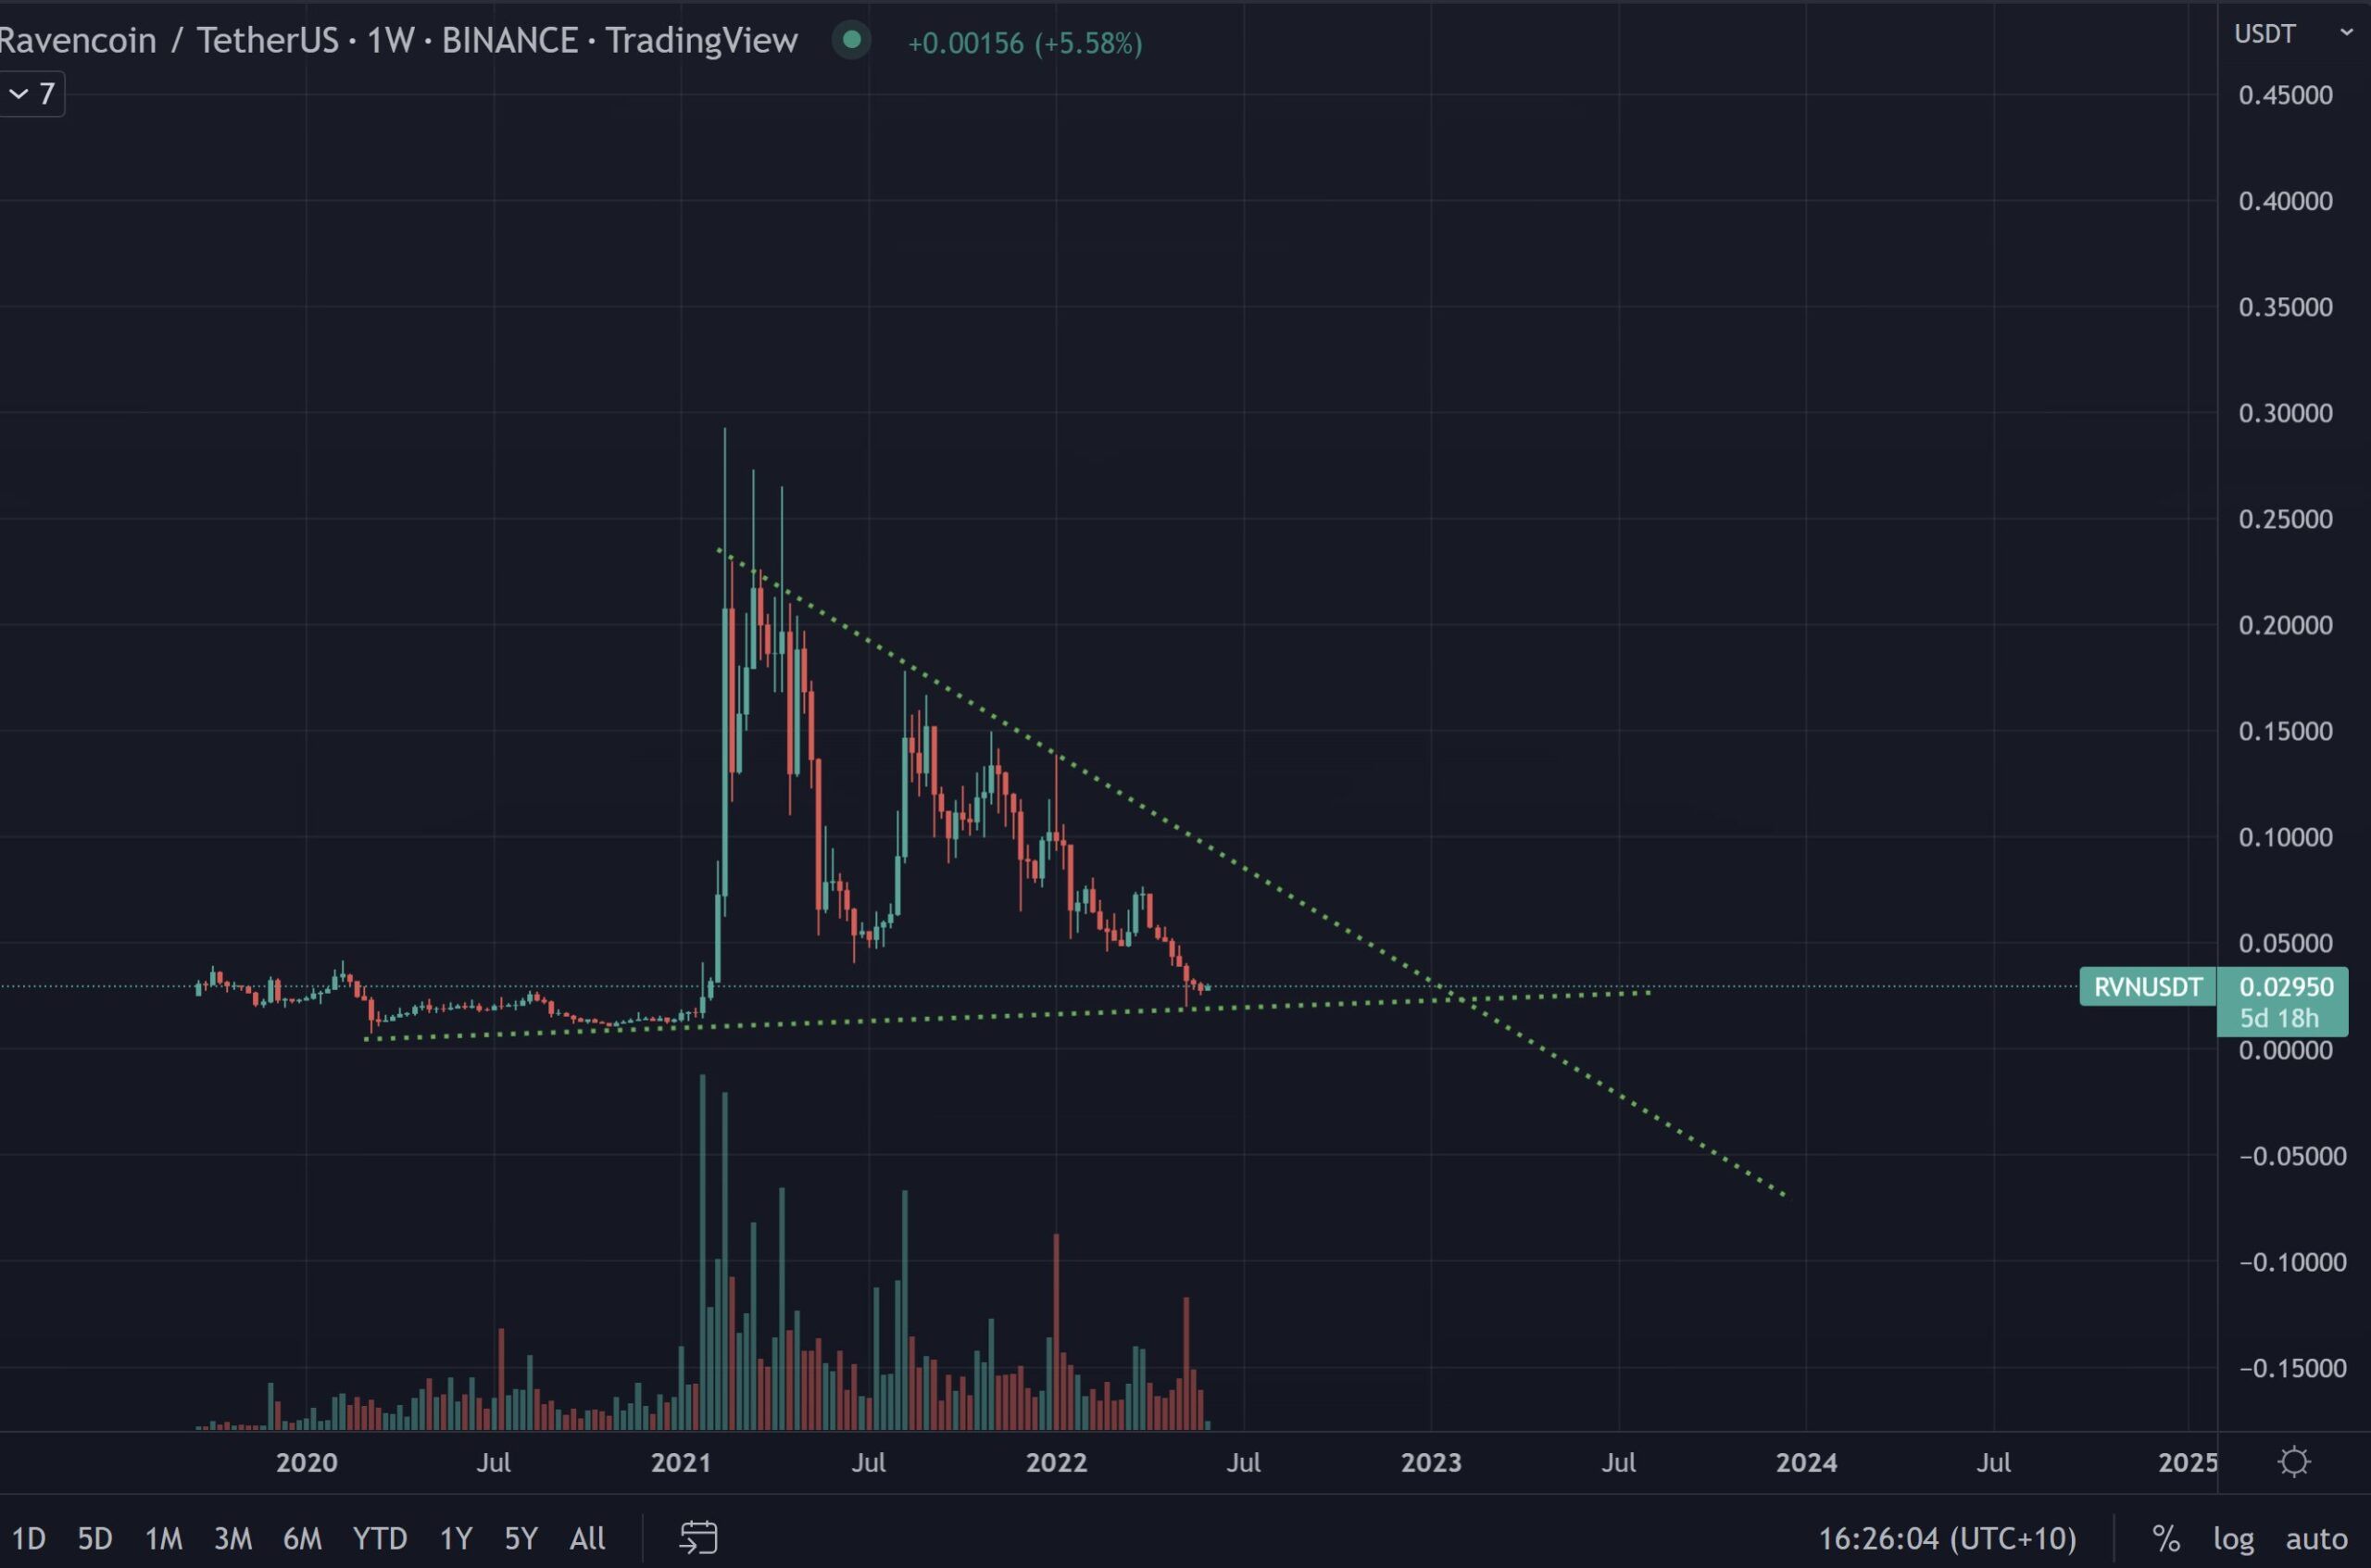
Cryptocurrency trader @bitcoinmanbear1 tweeted a chart of RVN which shows a very long-term symmetrical triangle in place. Both the resistance and support lines coincide with those drawn in the previous image.
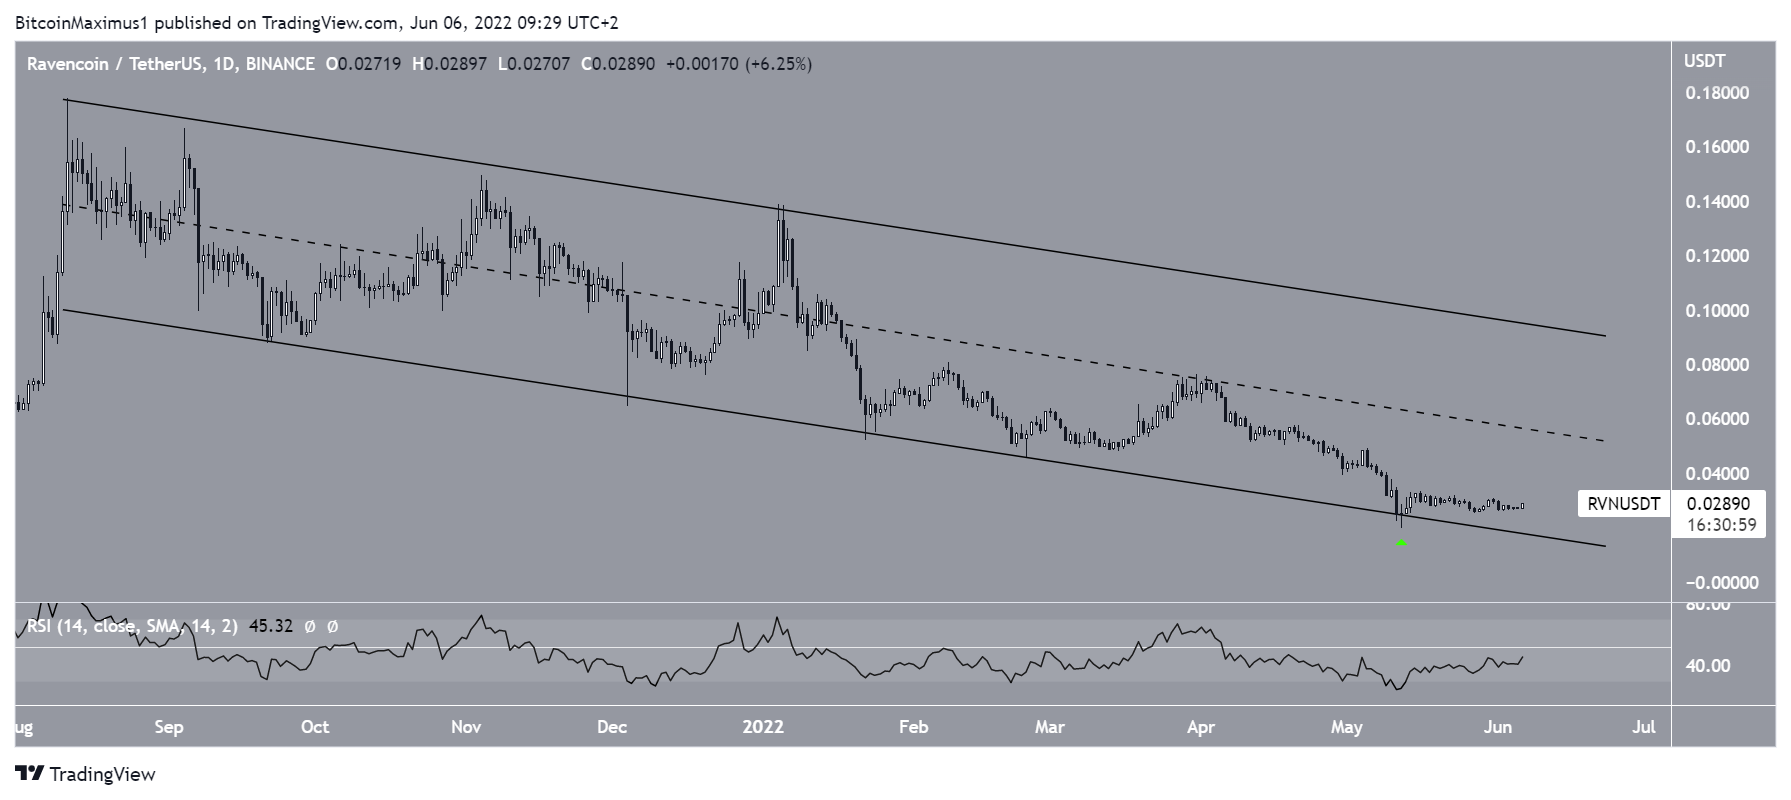
Long-term channel
A look at the daily chart shows that the price has been trading inside a descending parallel channel since Aug. 2021. Such channels usually contain corrective movements, meaning that an eventual breakdown from them would be expected.
The support line of the channel has been validated numerous times, most recently on May 12, 2022.
Even though the descending parallel channel usually leads to breakdowns, the price is still trading in its lower portion, and the RSI is still below 50. So, neither of these readings suggests that a bullish reversal is forthcoming.
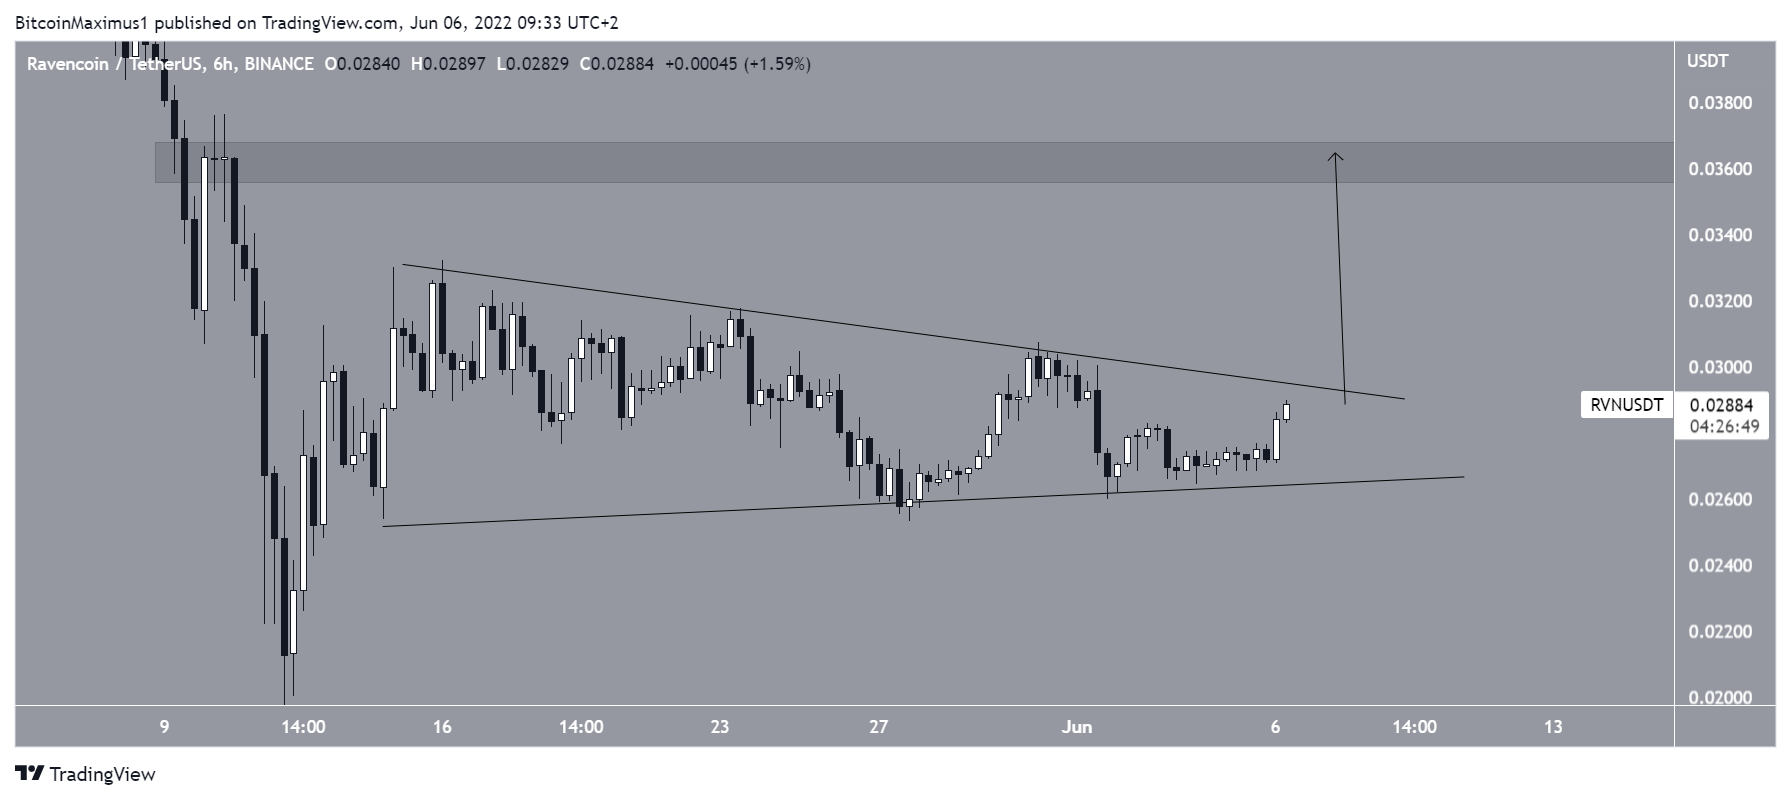
Short-term RVN movement
Finally, the six-hour chart shows that RVN has been trading inside a symmetrical triangle since May 16. While this is considered a neutral pattern, it is transpiring after an upward movement. So, it is possible that it will lead to a breakout.
This potential breakout could take the price to $0.036, if it travels the entire length of the triangle. But, due to the mixed readings from the weekly and daily time frames, the direction of the trend cannot be confidently determined yet.
For Be[in]Crypto’s latest bitcoin (BTC) analysis, click here


