
Quant (QNT) increased by 12.50% during the week of Sept 18-25, despite the cryptocurrency market being in a slump. It is now approaching a crucial resistance at $150.
Despite last week’s market sell-off, QNT is one of the few tokens that has managed to increase. Besides its positive performance, it has performed well in social metrics, with its social contributions reaching a 90-day-high.
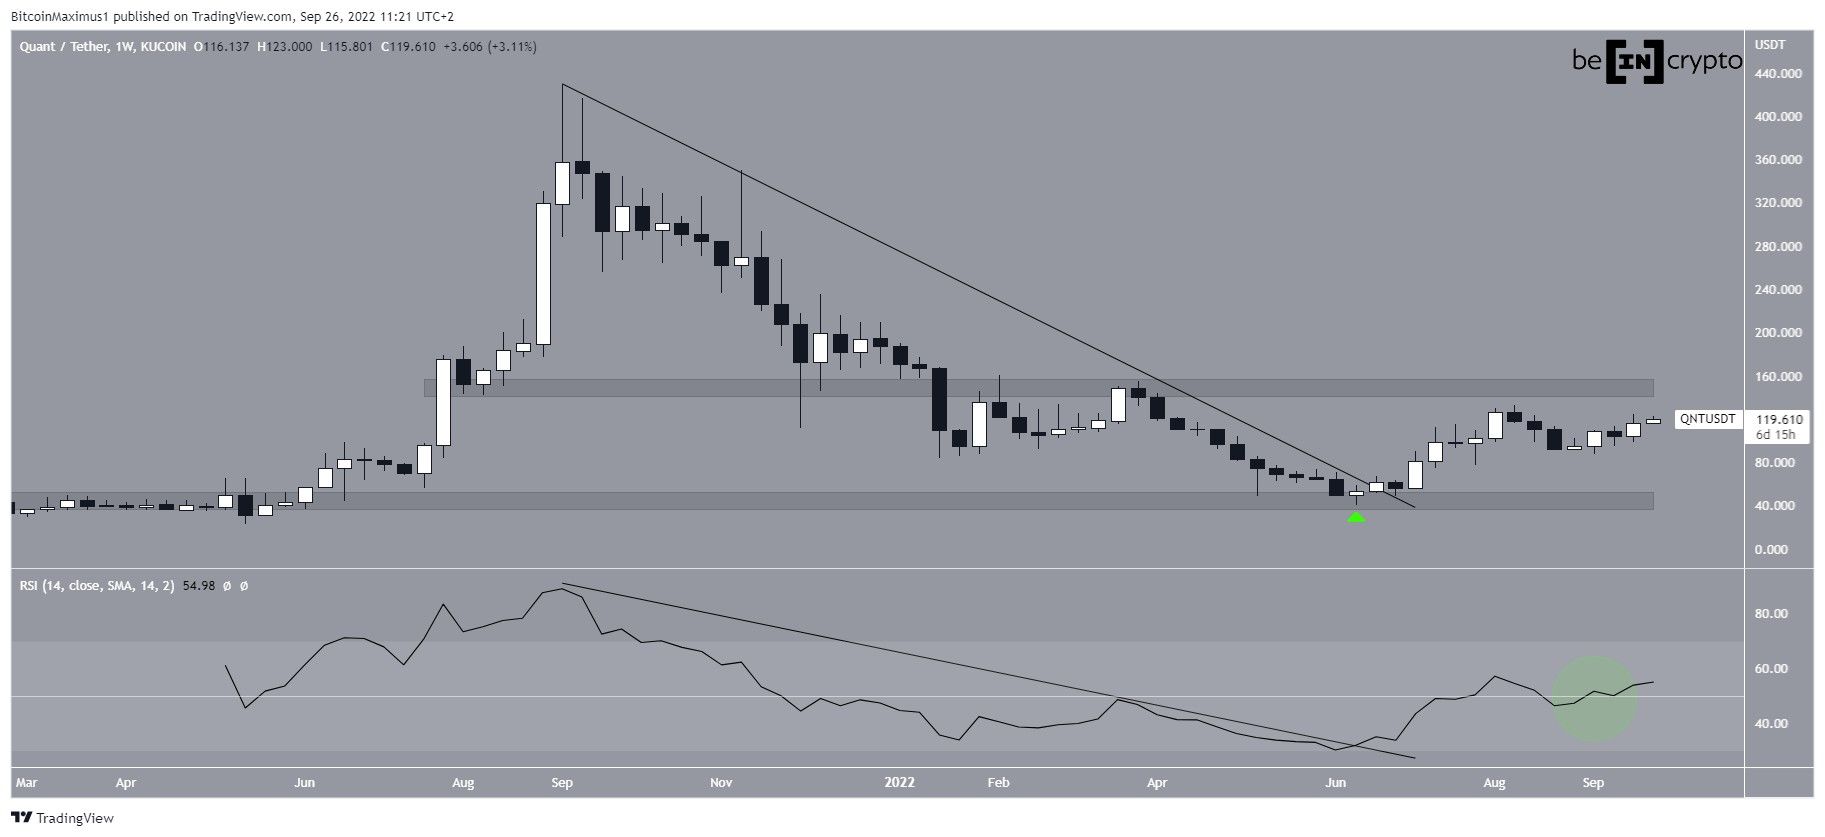
Moreover, the price movement for QNT looks exceptionally bullish. This is especially visible in the weekly chart. The price has broken out from a descending resistance line which had previously been in place since Sept. Additionally, the weekly RSI has broken out from its descending resistance line in place throughout this period.
Furthermore, the breakout occurred after the price bounced at the long-term $40 horizontal support area (green icon). So far, QNT has reached a high of $129, only slightly below the $150 horizontal resistance area. Currently, the price is gearing up for an attempt at breaking out. Since the weekly RSI has already broken out above 50 (green circle), the price will likely reclaim the $150 area.
If it is successful in doing so, the rate of increase could accelerate further due to the lack of overhead resistance.
QNT daily outlook bullish
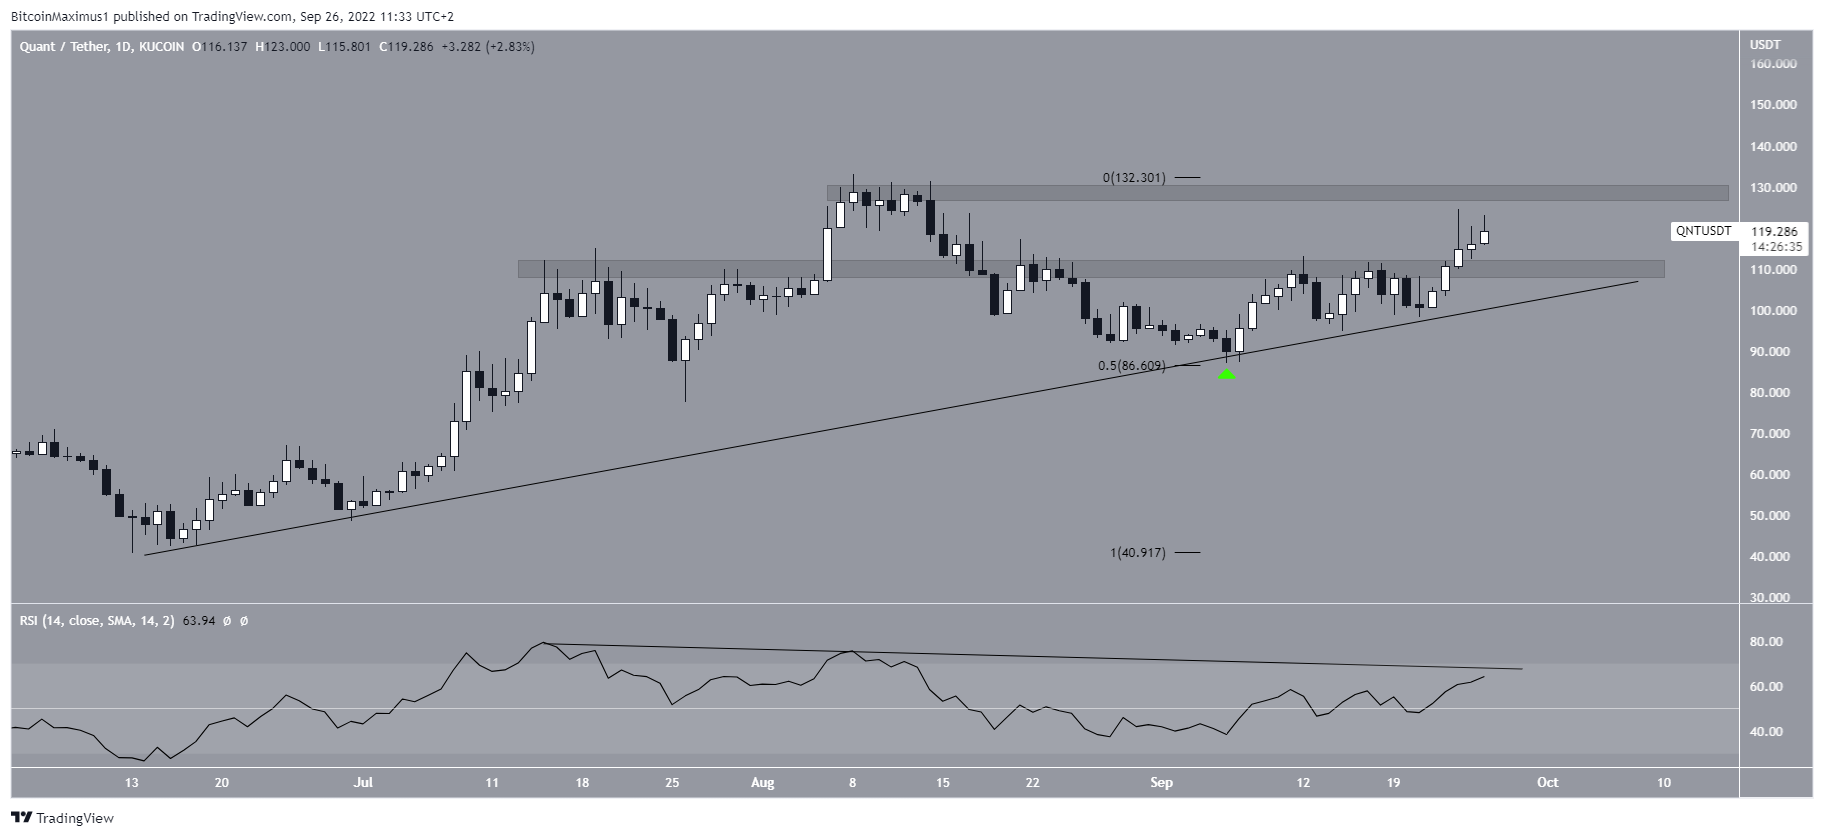
The daily chart also provides a bullish outlook. QNT has been following an ascending support line since June 13. It bounced at the support line on Sept. 6. At the time, the line also coincided with the 0.5 Fib retracement support level.
Afterward, the price reclaimed the $110 horizontal resistance area and is now approaching the next resistance at $130.
A potential breakout from the Aug. highs would also cause a breakout from the bearish divergence trend line in the RSI. As a result, it would be expected to accelerate significantly the rate of increase towards at least $150 and possibly higher.
For Be[In]Crypto’s latest Bitcoin (BTC) analysis, click here
