


Polygon (MATIC) price surged 20% last week and regained an important long-term support area at $1.31.
According to data from CoinGecko, Polygon (MATIC) is currently the eighth largest cryptocurrency by market capitalization. MATIC is the native token of the Polygon network, which provides a scaling solution for the Ethereum blockchain.
On the weekly chart, we see that the recovery of the $1.31 level is a key event for the resumption of a new uptrend. This area corresponds with the important 0.382 Fib retracement level of the entire downward movement counting from the all-time high (ATH).
Moreover, it acted as support in early 2022 (green circles), but was lost in April. It has since turned into resistance and rejected the MATIC price in October-November (red circle).
This event coincided with the rejection from the long-term falling resistance line (blue), which was in place from the ATH at $2.92 reached in December 2021. The line was finally broken last month (blue circle). This was one of the first signals of a long-term trend reversal.
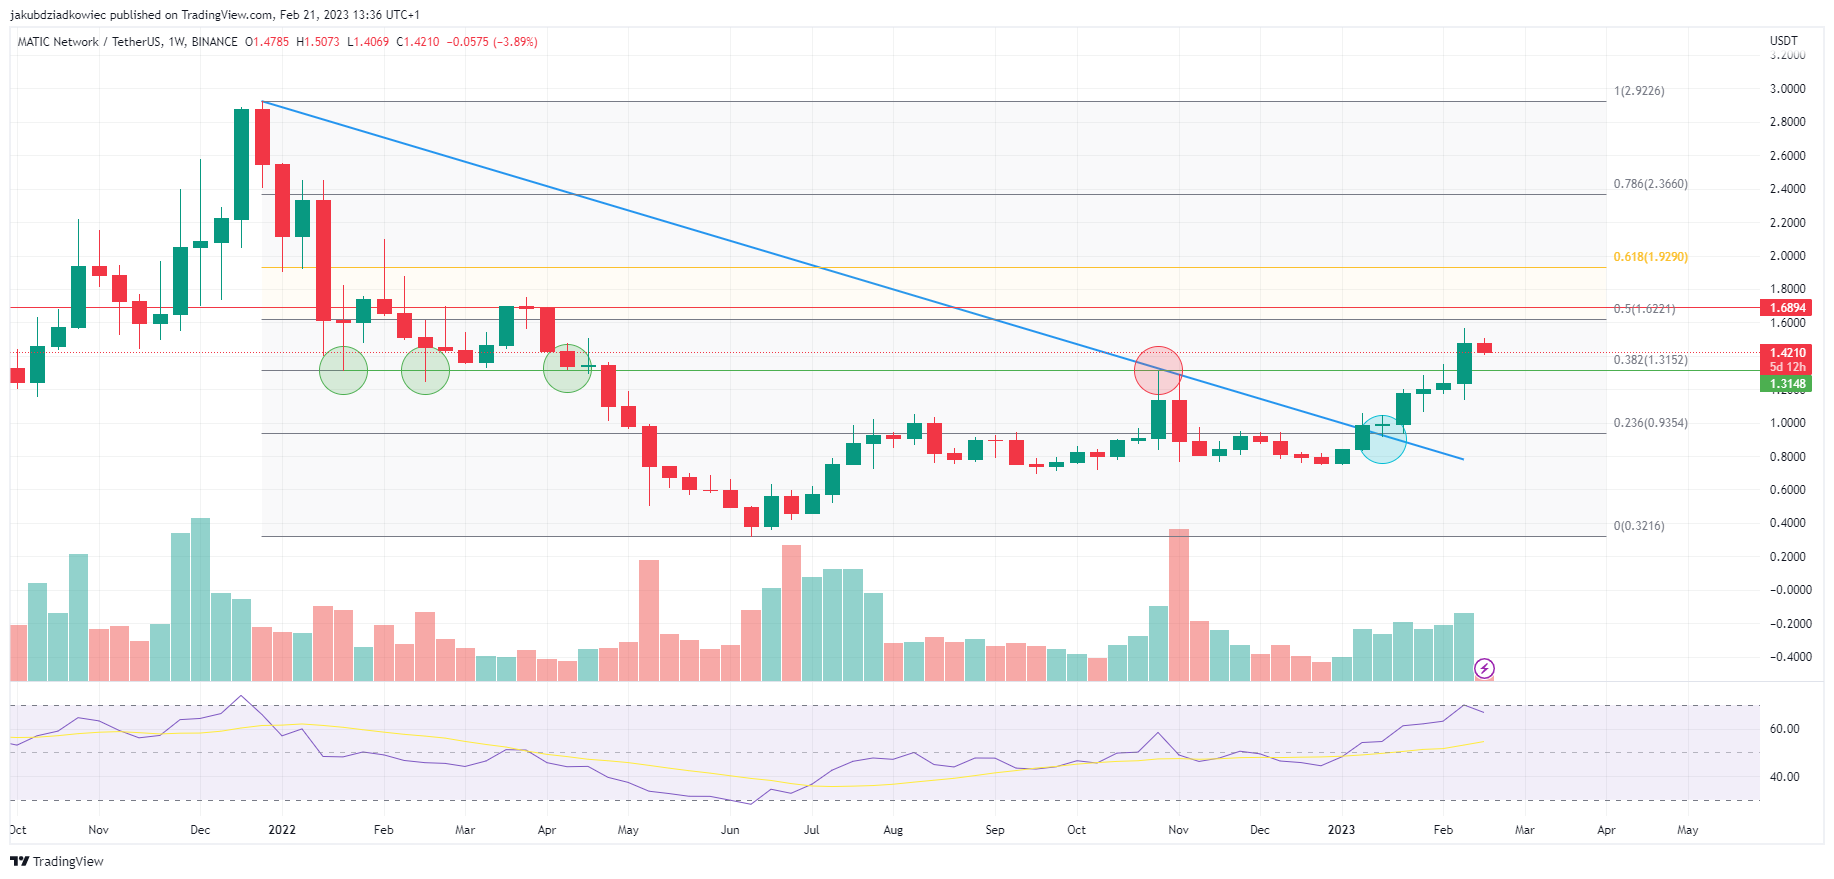
MATIC reached a local peak at $1.57, very close to the 0.5 Fib retracement. At the same time, the weekly RSI reached the overbought area at 70, but failed to surpass it. The uptrend so far is likely to continue, as there are no signs of bearish divergence yet.
The next targets are the resistance levels at $1.69 and $1.93. They correspond with the 0.5 Fib and 0.618 Fib retracement levels, respectively, as well as important horizontal areas.
Polygon (MATIC) Price Will Move up After Correction
The Polygon daily chart provides a more detailed outlook on the short-term price action. Firstly, it seems that the bearish divergence that has been developing since mid-January (red line) has already played out. After the MATIC price validated the $1.16 level as support, the upward movement resumed.
Now, after reaching a local peak at $1.57, a correction to the $1.25-$1.31 area is expected. This range corresponds with the 0.382 Fib retracement of the entire upward movement this year and with the support of the daily super trend indicator. In addition, it would serve to validate the long-term level of $1.31 as support.
On the other hand, a breakdown below the bullish super trend and the $1.16 level would violate the structure of the current uptrend. This would lead the Polygon price to lower support levels at $1.06 or $0.92.
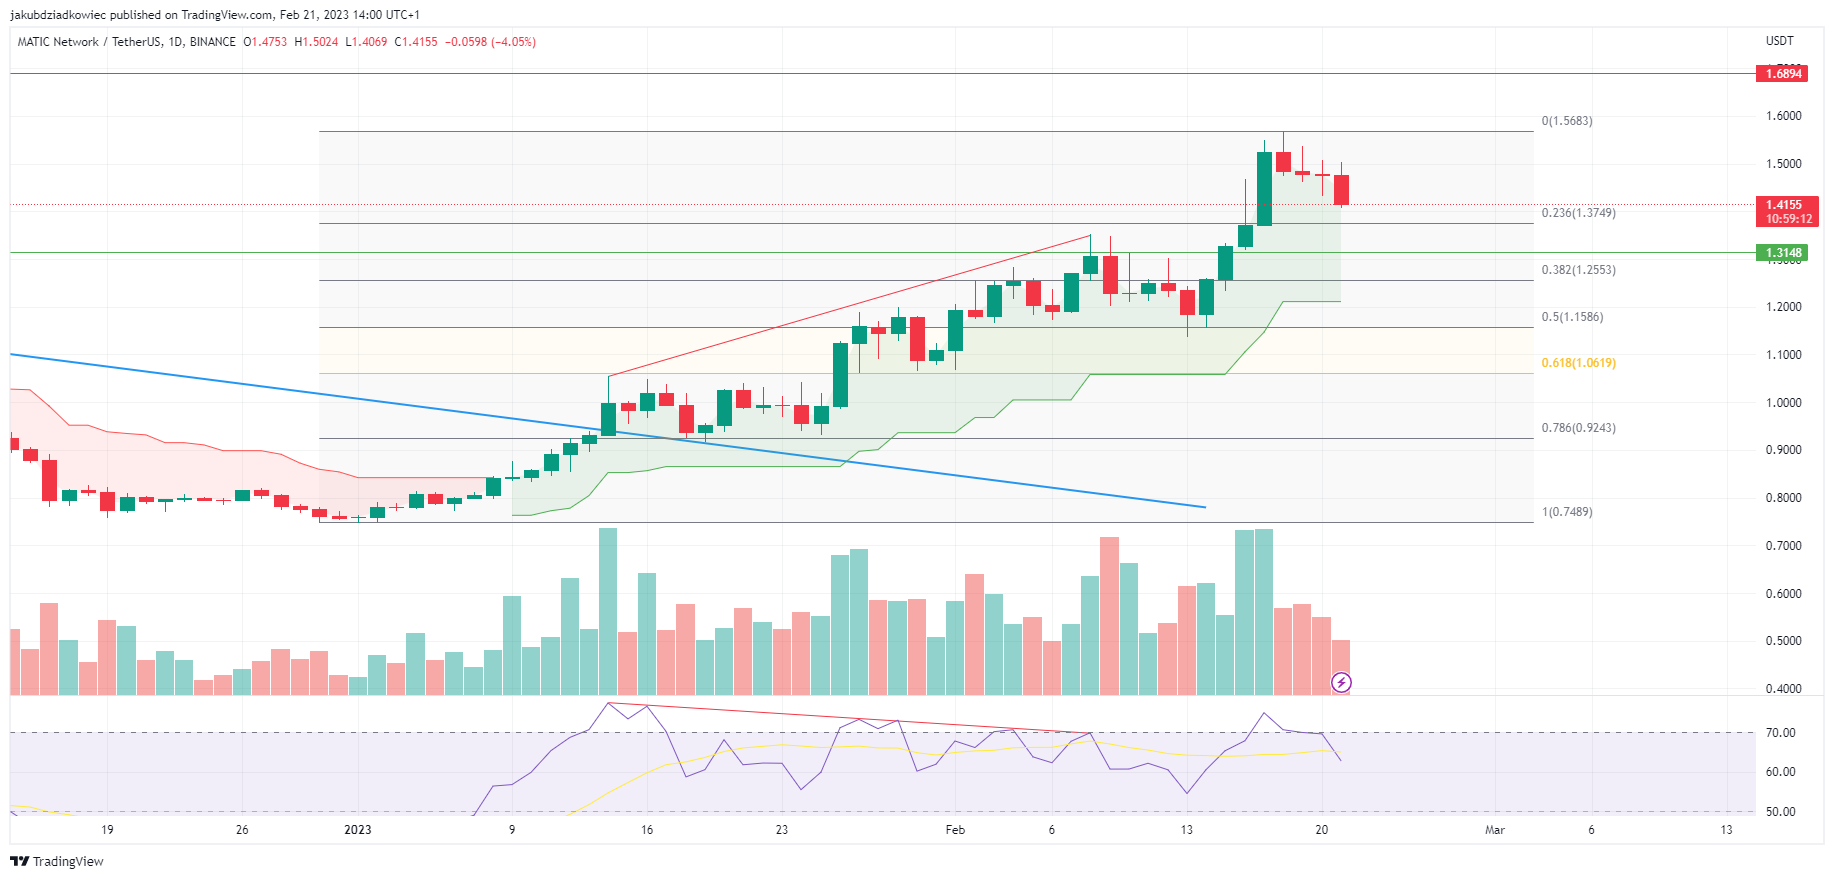
In conclusion, the MATIC price has regained an important long-term support area and is on track to continue its upward movement. However, this is likely to happen only after a short-term correction and validation of the $1.31 area.
For BeInCrypto’s latest Bitcoin (BTC) analysis, click here.



