


Polygon (MATIC) has broken out from a short-term resistance and could soon break out out from a long-term one.
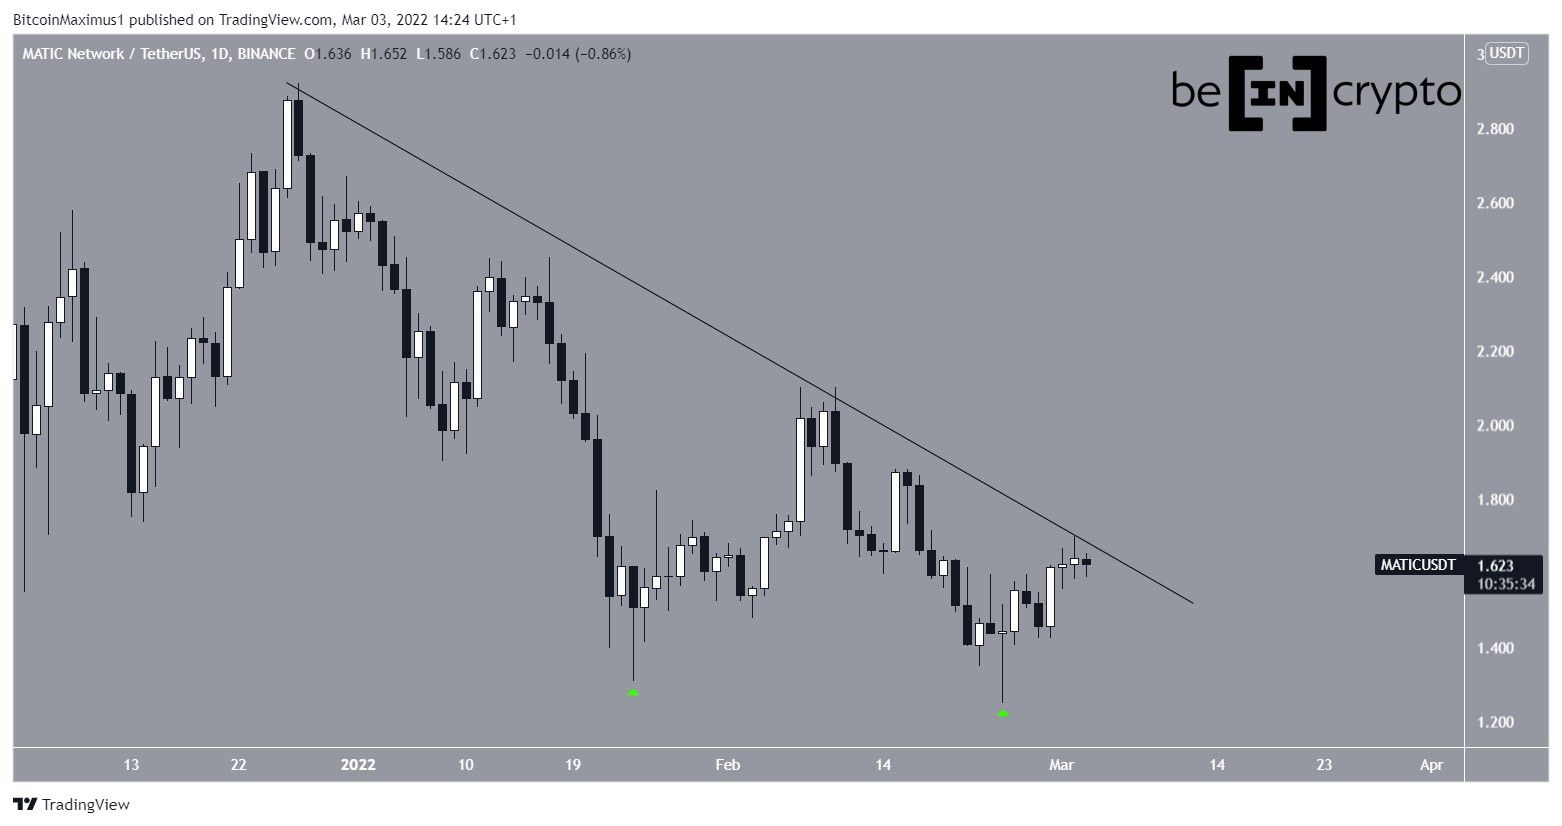
MATIC has been falling since reaching an all-time high price of $2.92 on Dec 27. The downward movement has so far led to a low of $1.24 on Feb 24. The price has been increasing since. The ensuing bounce created a very long lower wick, which is considered a sign of buying pressure.
When combined with the Jan 24 increase, this movement created a double bottom (green icons), which is considered a bullish reversal pattern.
Potential MATIC breakout
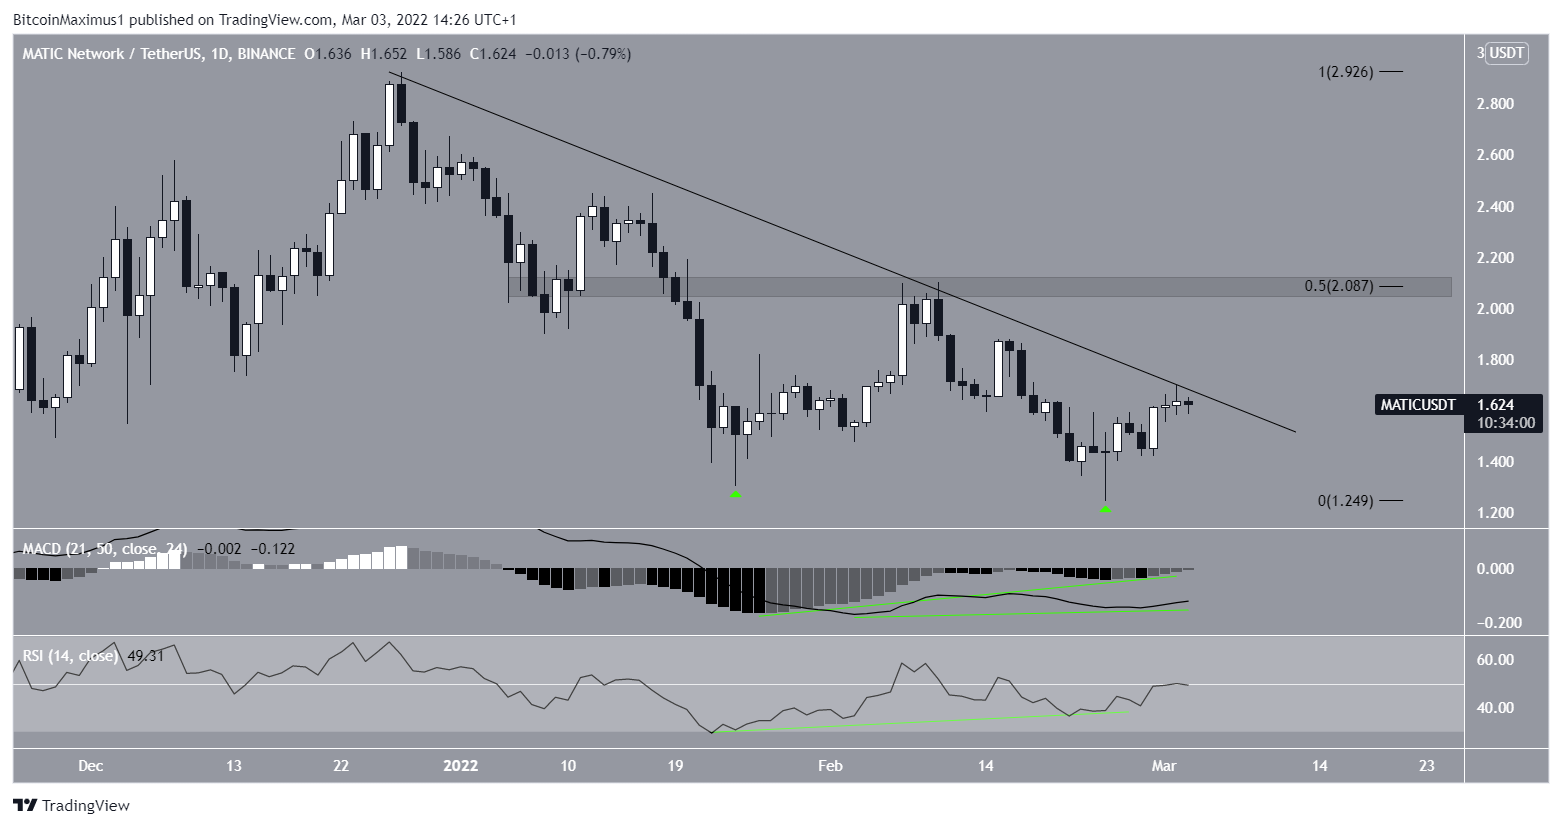
In addition to the price action, technical indicators in the daily time-frame support the continuation of the upward movement.
This is especially visible by the strong bullish divergences in both the RSI and MACD (green lines). Such divergences often precede significant trend reversals. However, the RSI has yet to cross above 50 and the MACD is not yet positive.
If a breakout from the resistance line occurs, the closest resistance would be at $2.10. This is the 0.5 Fib retracement resistance level and a horizontal resistance area.
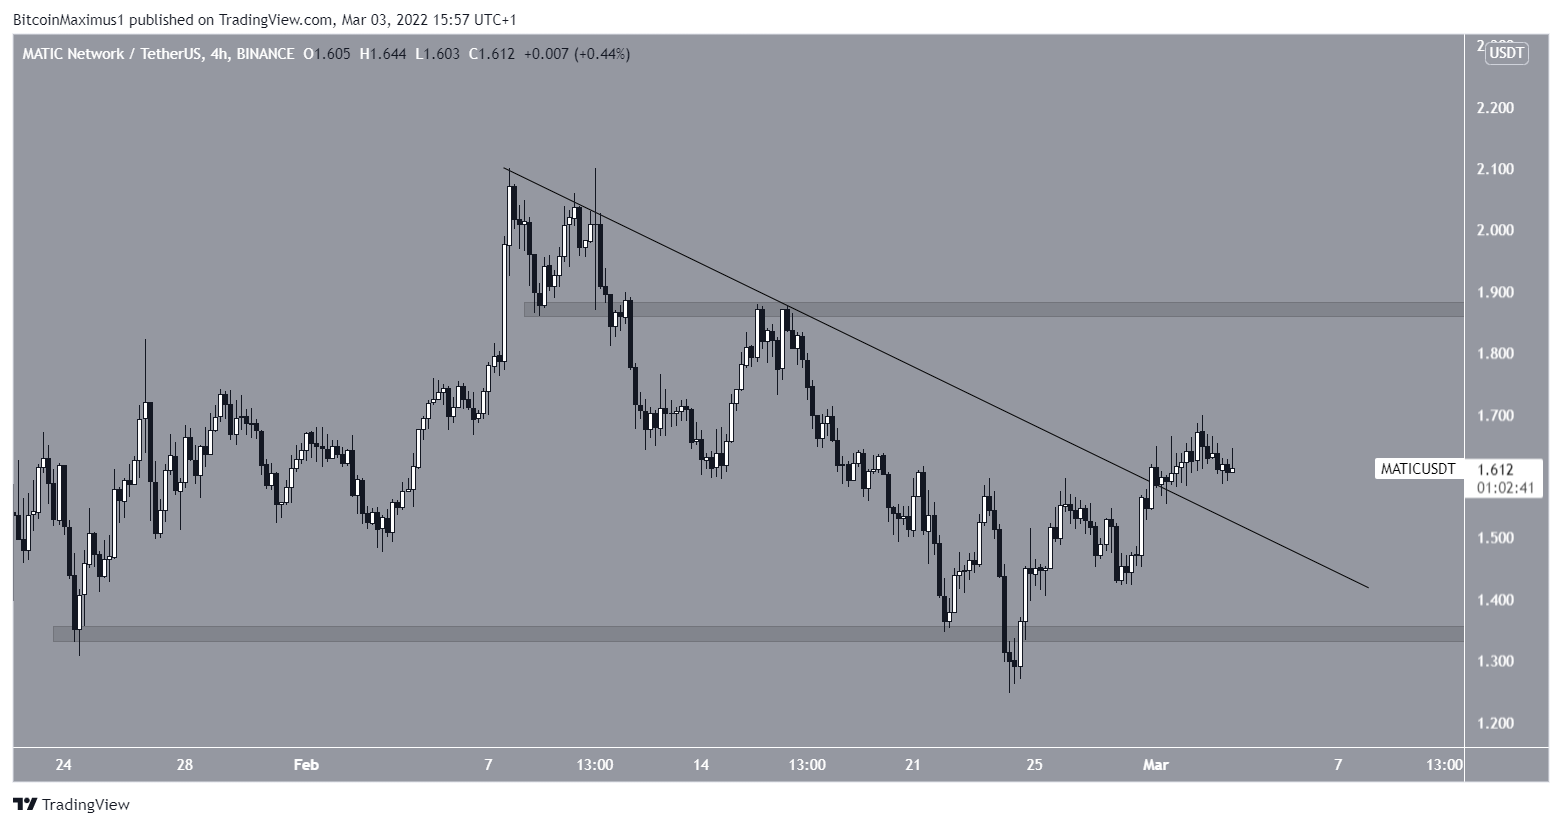
The four-hour chart supports the breakout from the long-term descending resistance line. It shows that MATIC has already broken out from a shorter-term line.
If the upward movement continues, the next closest resistance would be at $1.88. This is a minor resistance level prior to the major one at $2.08.
Wave count analysis
Cryptocurrency trader @TheTradingHubb tweeted a chart of MATIC, stating that the price could decrease once more in order to complete its correction.
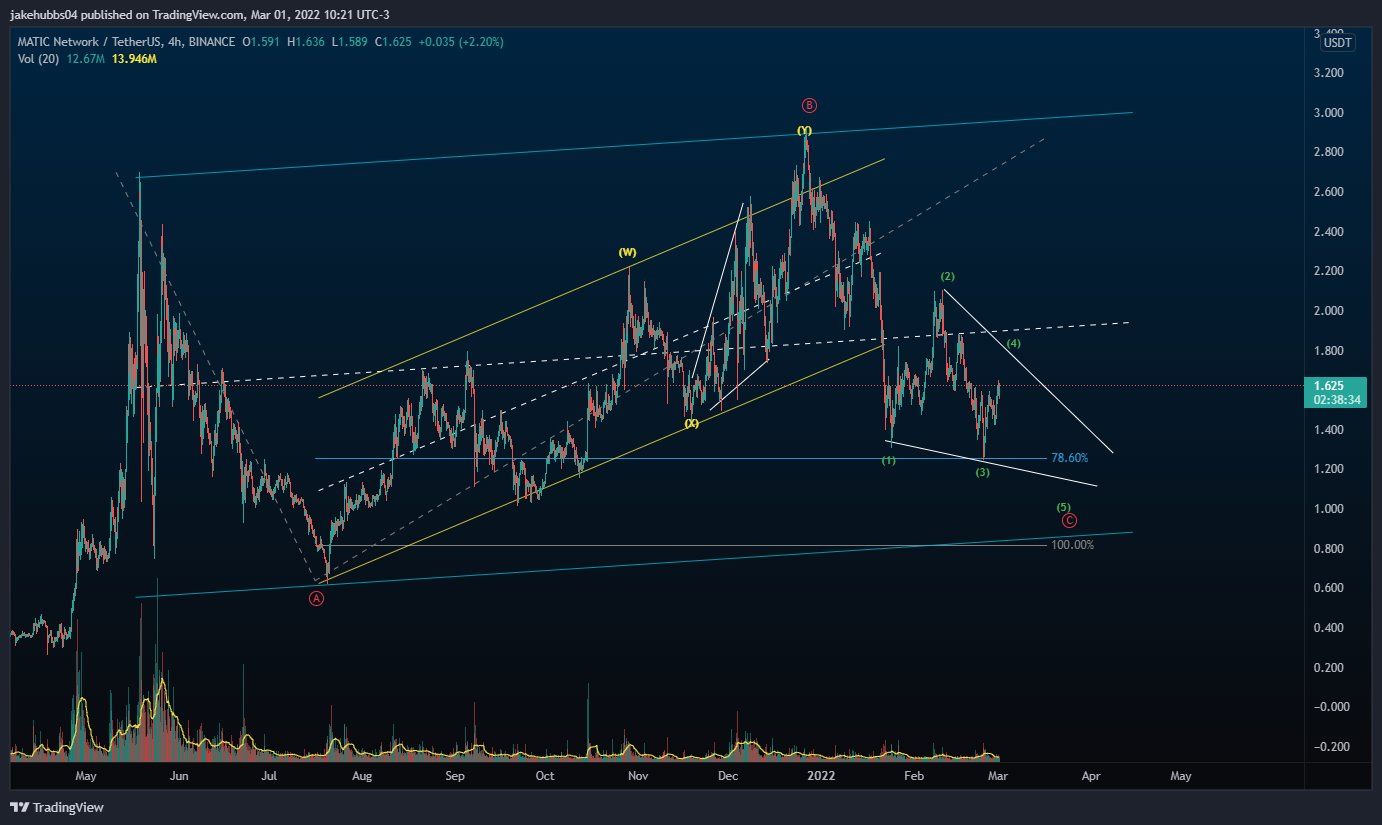
There are several wave counts that are still valid, therefore the correct on is not yet confirmed. If MATIC fails to break out from the resistance line, this would be the most likely count.
For BeInCrypto’s latest Bitcoin (BTC) analysis, click here


