

The Polkadot (DOT) price is trading at a confluence of resistance levels at $5.10. A breakout above this area would confirm that a bullish reversal has begun.
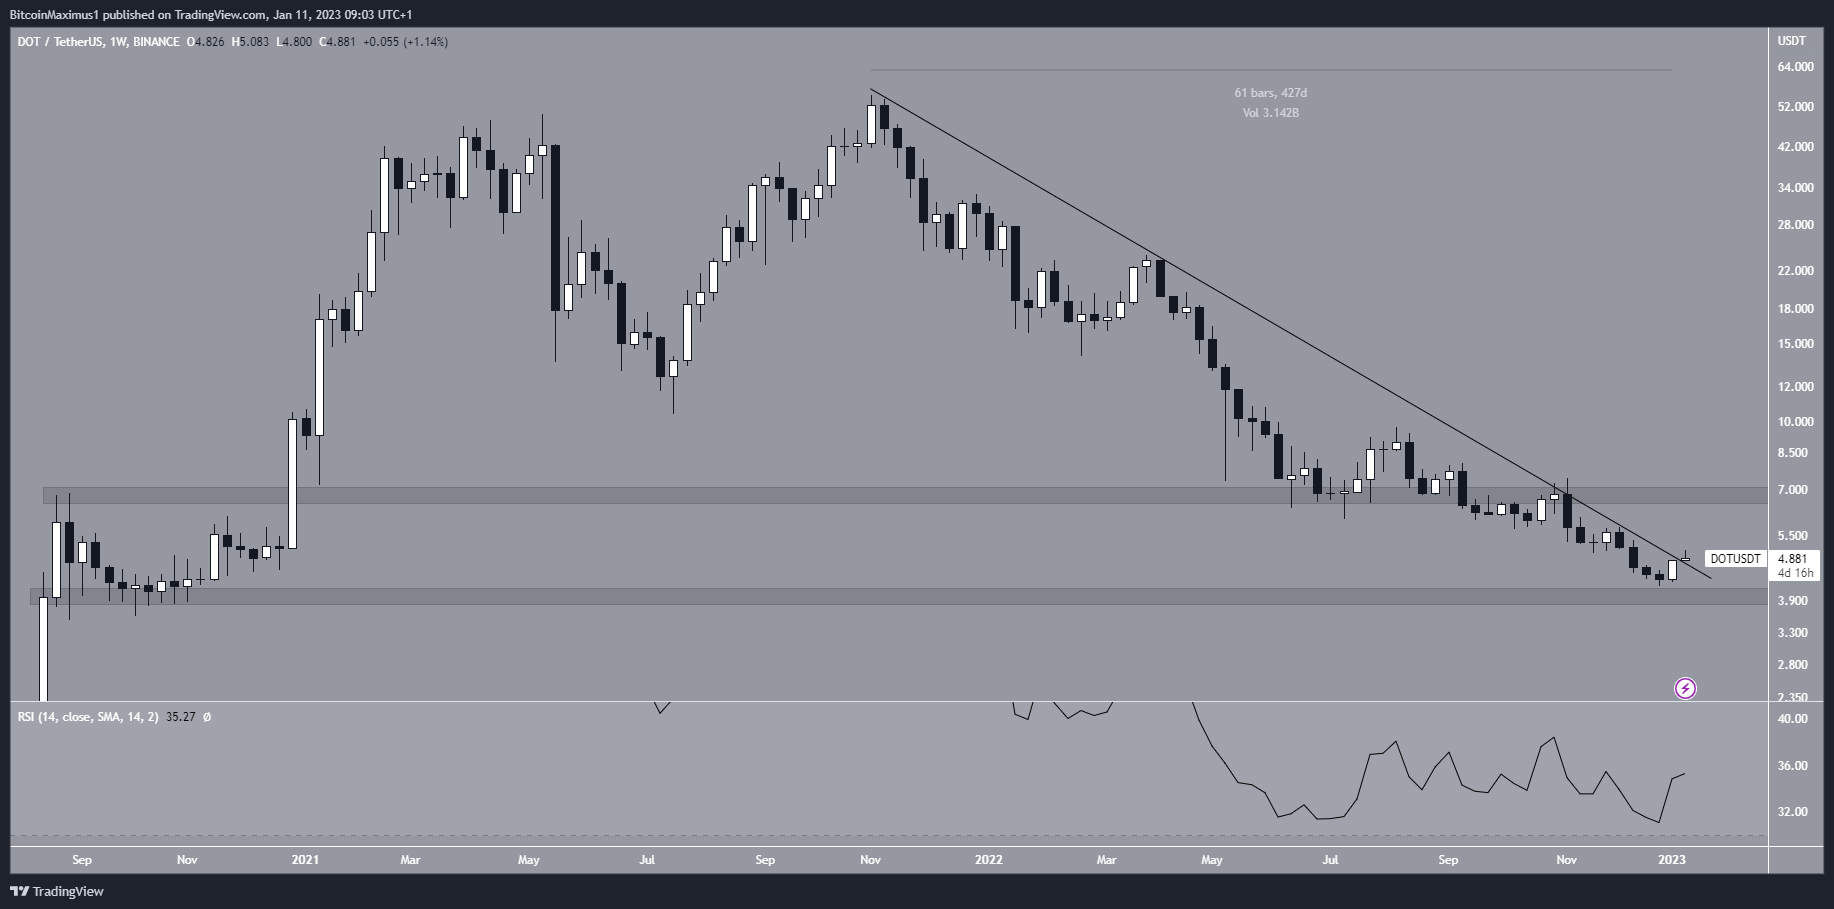
The Polkadot price had decreased under a descending resistance line since Nov. 2021, when it reached a maximum price of $55.10. The downward movement led to a minimum price of $4.22 in Dec. 2022.
Even though the DOT price did not reach the main support area at $4, it initiated an upward movement immediately afterward and is currently in the process of breaking out from the resistance line. Since the line has been in place for 427 days, a breakout from it would go a long way in confirming that a bullish reversal has begun.
If the upward movement continues, the closest resistance area would be at $6.80. On the other hand, failure to sustain the upward trend could lead to a drop toward the support area at $4.
While the price action is bullish, the weekly RSI is still bearish. The indicator has not generated any bullish divergence and is still below 50, both signs of a bearish trend.
Due to these mixed signs, the technical analysis from the weekly time frame is insufficient in predicting the long-term trend’s direction.
Polkadot Price Could Break out From Wedge
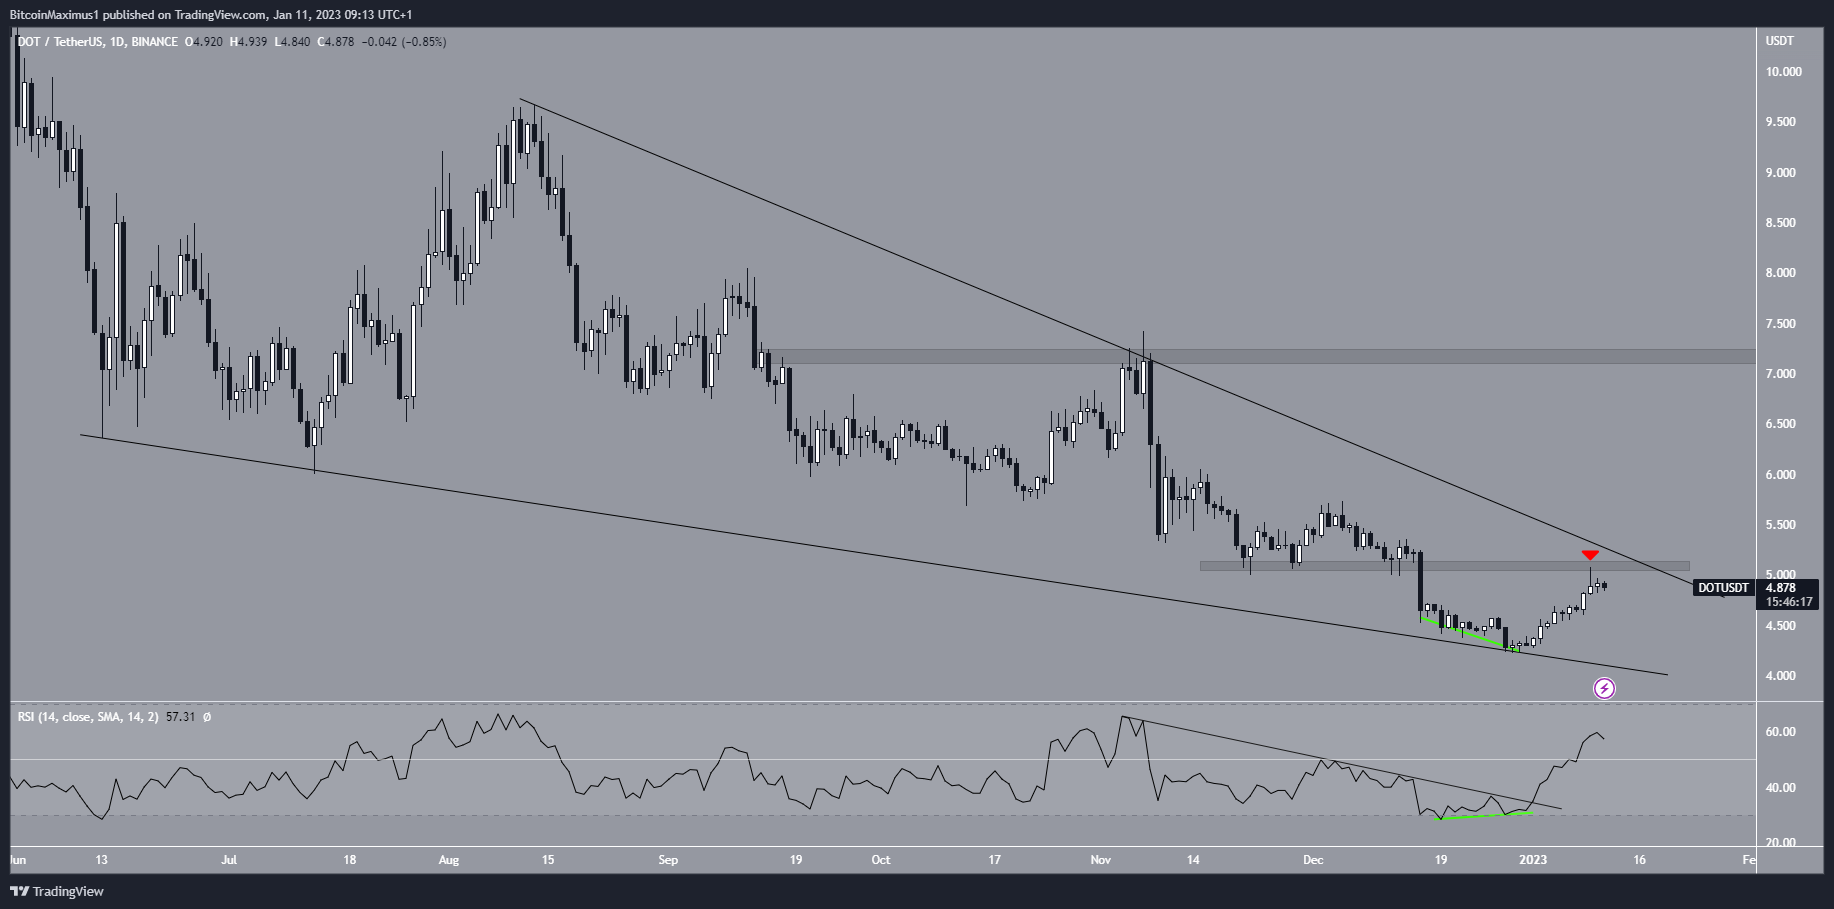
While the outlook from the weekly time frame is not decisive, the daily time frame readings are clearly bullish.
There are two main reasons for this. Firstly, the price has traded inside a descending wedge since Aug. 2021. The descending wedge is considered a bullish pattern, meaning that it leads to breakouts the majority of the time.
Next, the daily RSI generated bullish divergence (green line) and broken out from a descending resistance line (black line). These are also considered signs of a bullish trend.
Therefore, both the price action and technical indicator readings suggest that the trend is bullish, and a breakout will follow. If one occurs, the closest resistance area would be at $7.20.
However, it is worth mentioning that the Polkadot price was rejected by the short-term $5.10 resistance area (red icon) during the last 24 hours. The resistance area coincides with the resistance line of the wedge. A breakout above this level would confirm the bullish reversal, while failure to do so would likely send the DOT price back to the wedge’s support line.
To conclude, the Polkadot price analysis from the weekly time frame is unclear. However, the daily time frame readings indicate that the DOT token price is expected to break out from the $5.10 resistance area and the descending wedge.
For BeInCrypto’s latest crypto market analysis, click here.
Trusted
Disclaimer
In line with the Trust Project guidelines, this price analysis article is for informational purposes only and should not be considered financial or investment advice. BeInCrypto is committed to accurate, unbiased reporting, but market conditions are subject to change without notice. Always conduct your own research and consult with a professional before making any financial decisions. Please note that our Terms and Conditions, Privacy Policy, and Disclaimers have been updated.
