
The Polkadot (DOT) price has yet to break out from long-term resistance levels in the weekly time frame. However, the daily chart supports the beginning of a bullish reversal which could then continue in the weekly time frame.
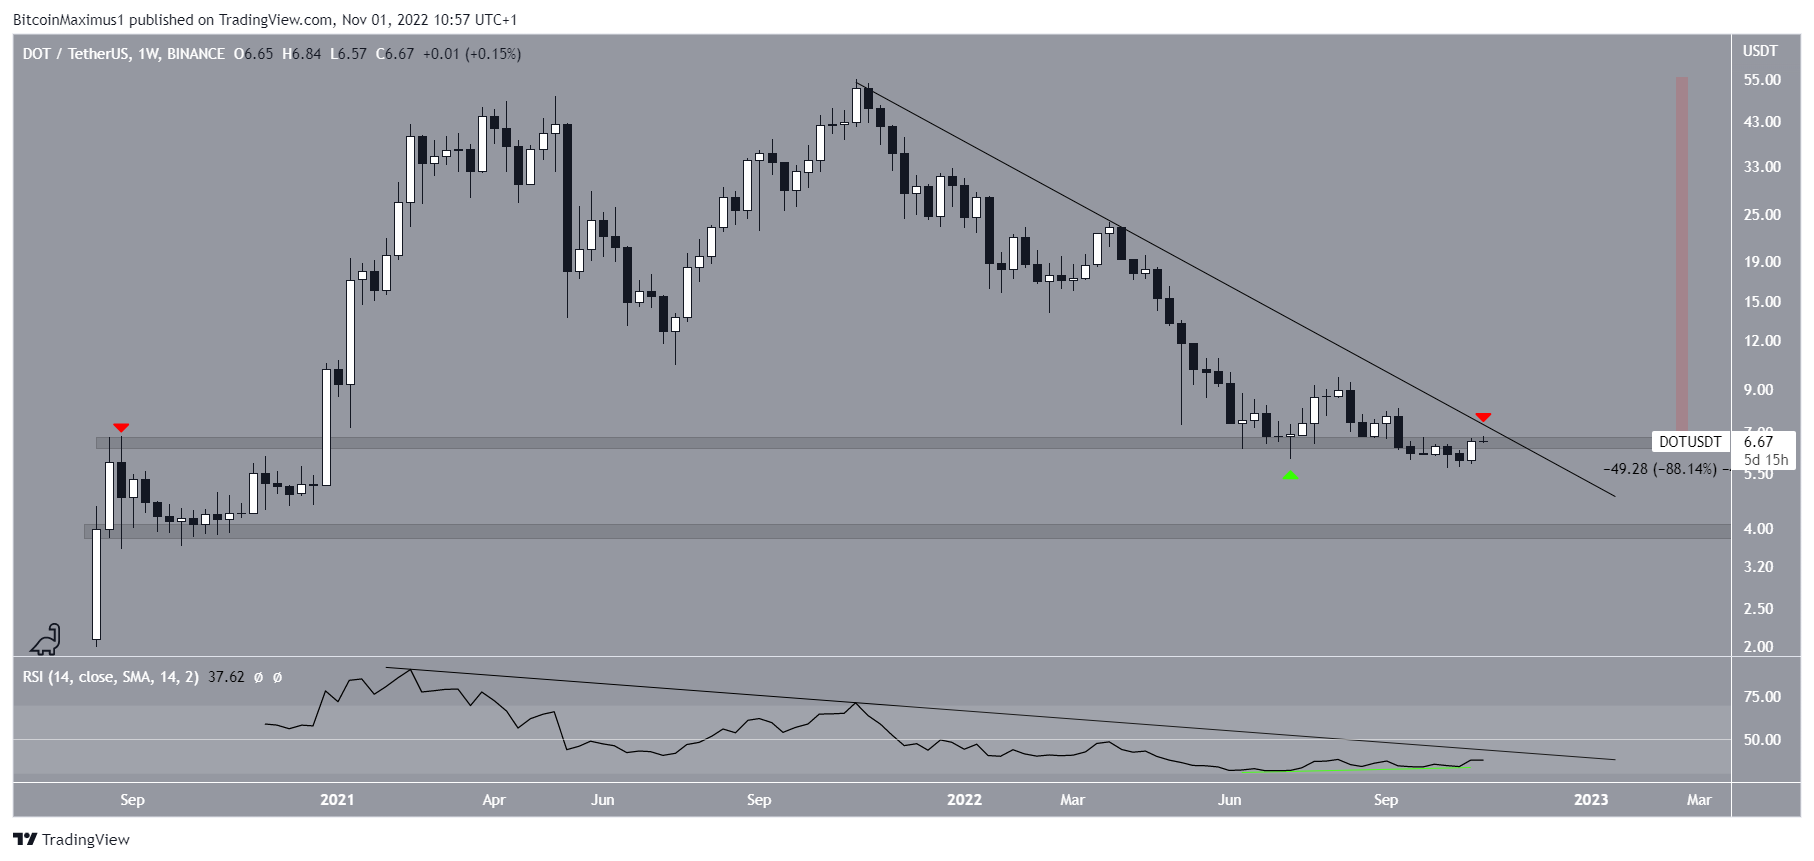
DOT has fallen underneath a descending resistance line since reaching an all-time high price of $55.09 in Nov. 2021. Throughout this period, it has been one of the biggest losers in the crypto market, falling by 88%.
In July 2022, the Polkadot price bounced at the $6.65 horizontal support area (green icon), creating a long lower wick in the process. However, DOT could not sustain this upward movement and a breakdown occurred in Sept.
Now, the price is in the process of validating the $6.65 area as resistance. Since the area also coincides with the descending resistance line, its importance is increased.
While the weekly RSI has generated a considerable amount of bullish divergence (green line), it has yet to break out from its original bearish divergence trend line (black). Additionally, it is worth mentioning that last week’s candlestick represented the highest percentage increase since July.
Therefore, whether the Polkadot price breaks out from the line/area or gets rejected will likely determine the direction of the future trend. At the current time, the weekly time frame does not offer an accurate DOT price prediction.
Polkadot Price Prediction: Short-Term Chart Support Breakout
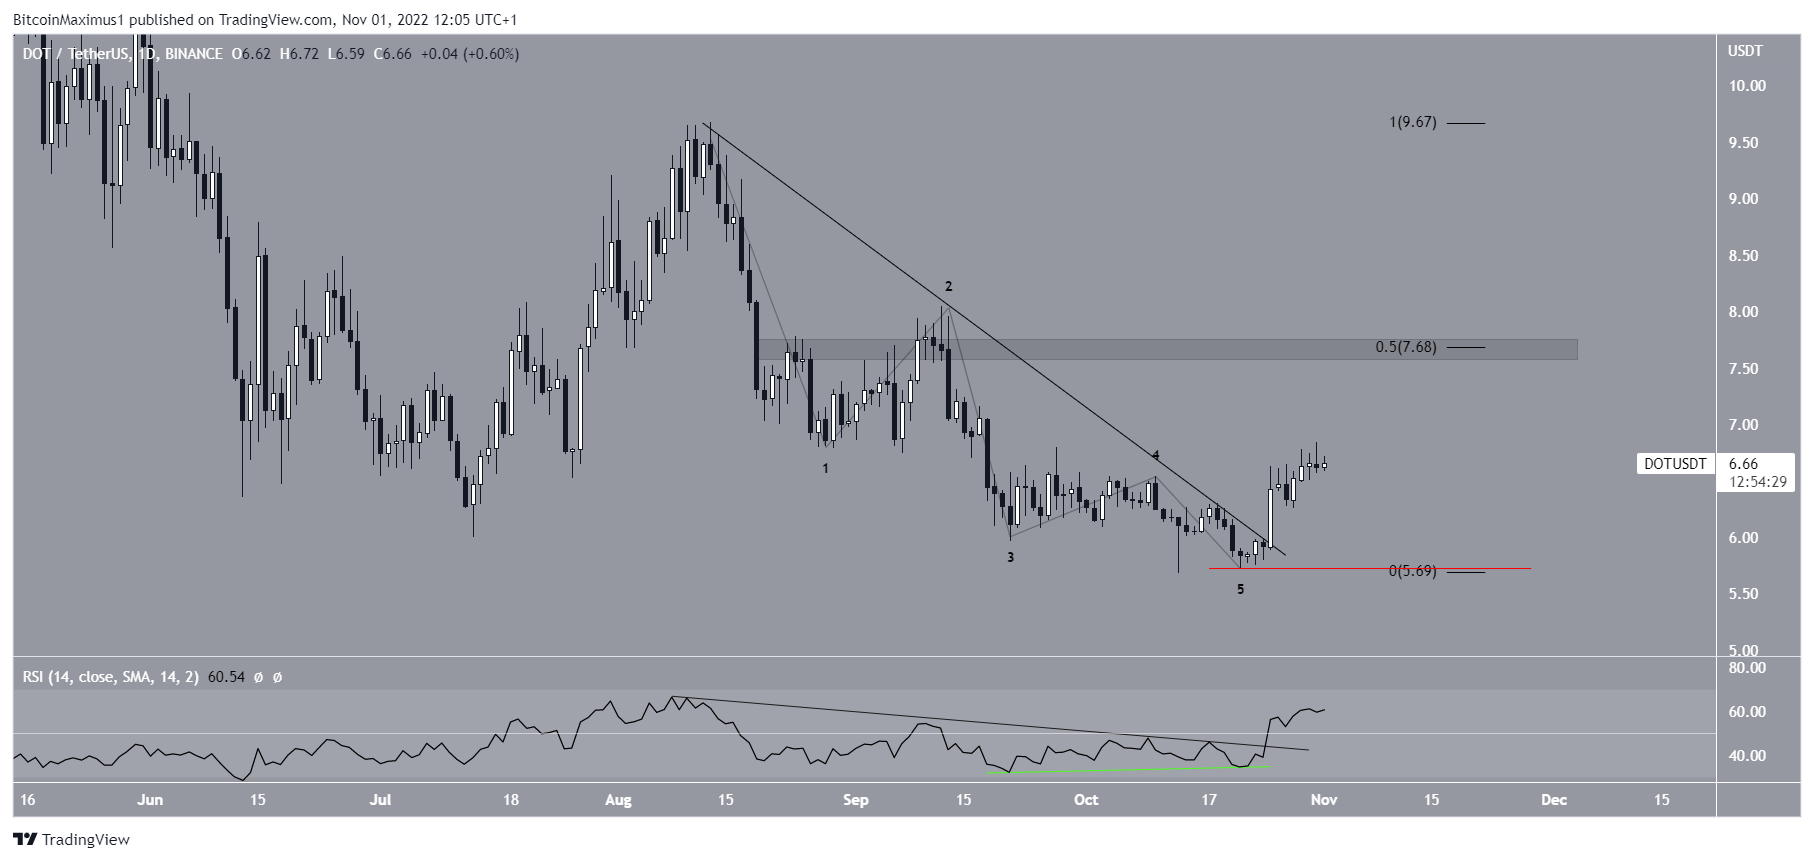
The price action from the daily chart is decisively bullish.
Firstly, the RSI has generated bullish divergence (green) and broken out from its bearish trend line (black).
Secondly, the DOT price has broken out from a descending resistance line. After the breakout, it reached the highest price value of $6.84. After decreasing slightly over the past 24 hours, the DOT price seems to have regained its footing and could resume its upward movement.
Lastly, it seems that there is a completed five-wave downward movement (black).
As a result of these readings, a bullish reversal has likely begun both in the daily and weekly time frames.
The main resistance area is at $7.68, created by the 0.5 Fib retracement resistance level and a horizontal resistance area.
If it reaches it, it will mean that the price has broken out from the previously outlined long-term resistance at $6.65. As a result, it would go a long way in confirming that a bullish reversal has begun.
Conversely, a decrease below the Oct. 21 low of $5.73 (red line) would invalidate the bullish price prediction. Instead, it would suggest that the Polkadot price will fall towards the $3.90 support area.
For the latest BeInCrypto Bitcoin (BTC) and crypto market analysis, click here
Disclaimer: BeInCrypto strives to provide accurate and up-to-date information, but it will not be responsible for any missing facts or inaccurate information. You comply and understand that you should use any of this information at your own risk. Cryptocurrencies are highly volatile financial assets, so research and make your own financial decisions.
