
Polkadot (DOT) has reclaimed an important support level and looks to have begun a new bullish impulse that might take it to new highs.
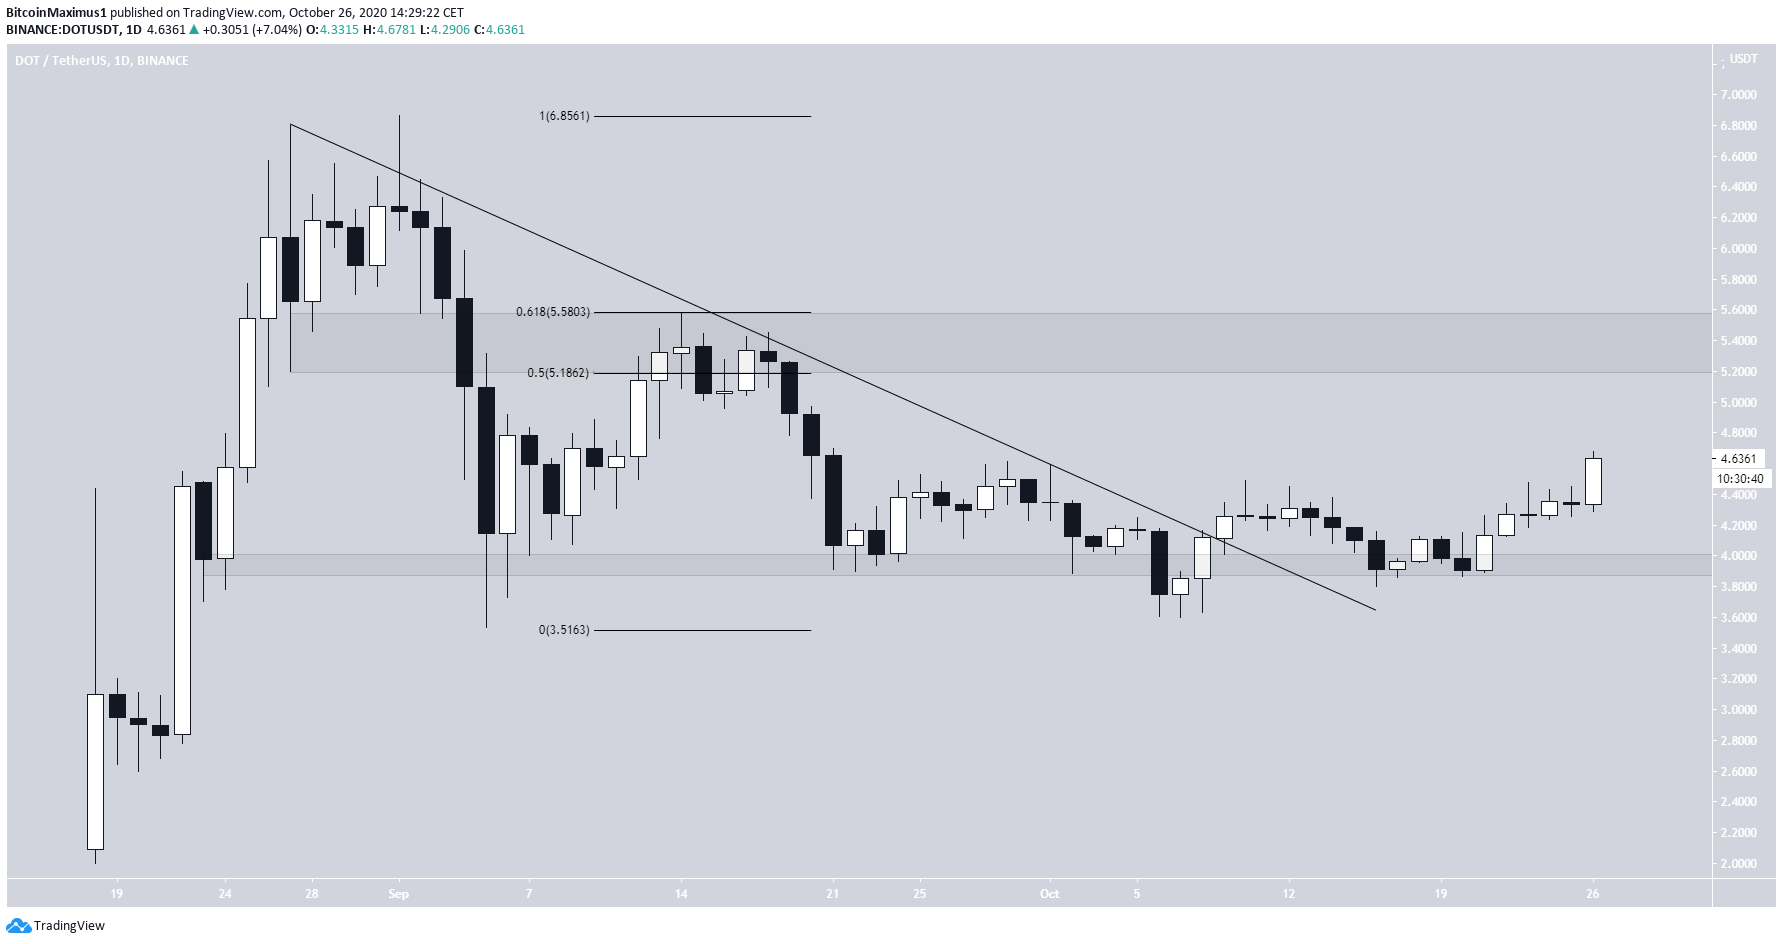
The DOT price has been following a descending resistance line since reaching a high of $6.86 on Sept 1.
DOT Overcomes Resistance
The price broke out from this resistance line on Oct 8 and then proceeded to validate the resistance and the $3.95 area as support. On Oct 20 the price initiated another upward movement that is still ongoing.
The closest resistance area is found between $5.18-$5.58, the 0.5-0.618 Fib levels of the entire downward move.
Wave Count
Cryptocurrency trader @TheEWguy outlined a DOT chart which shows the beginning of a new bullish impulse:
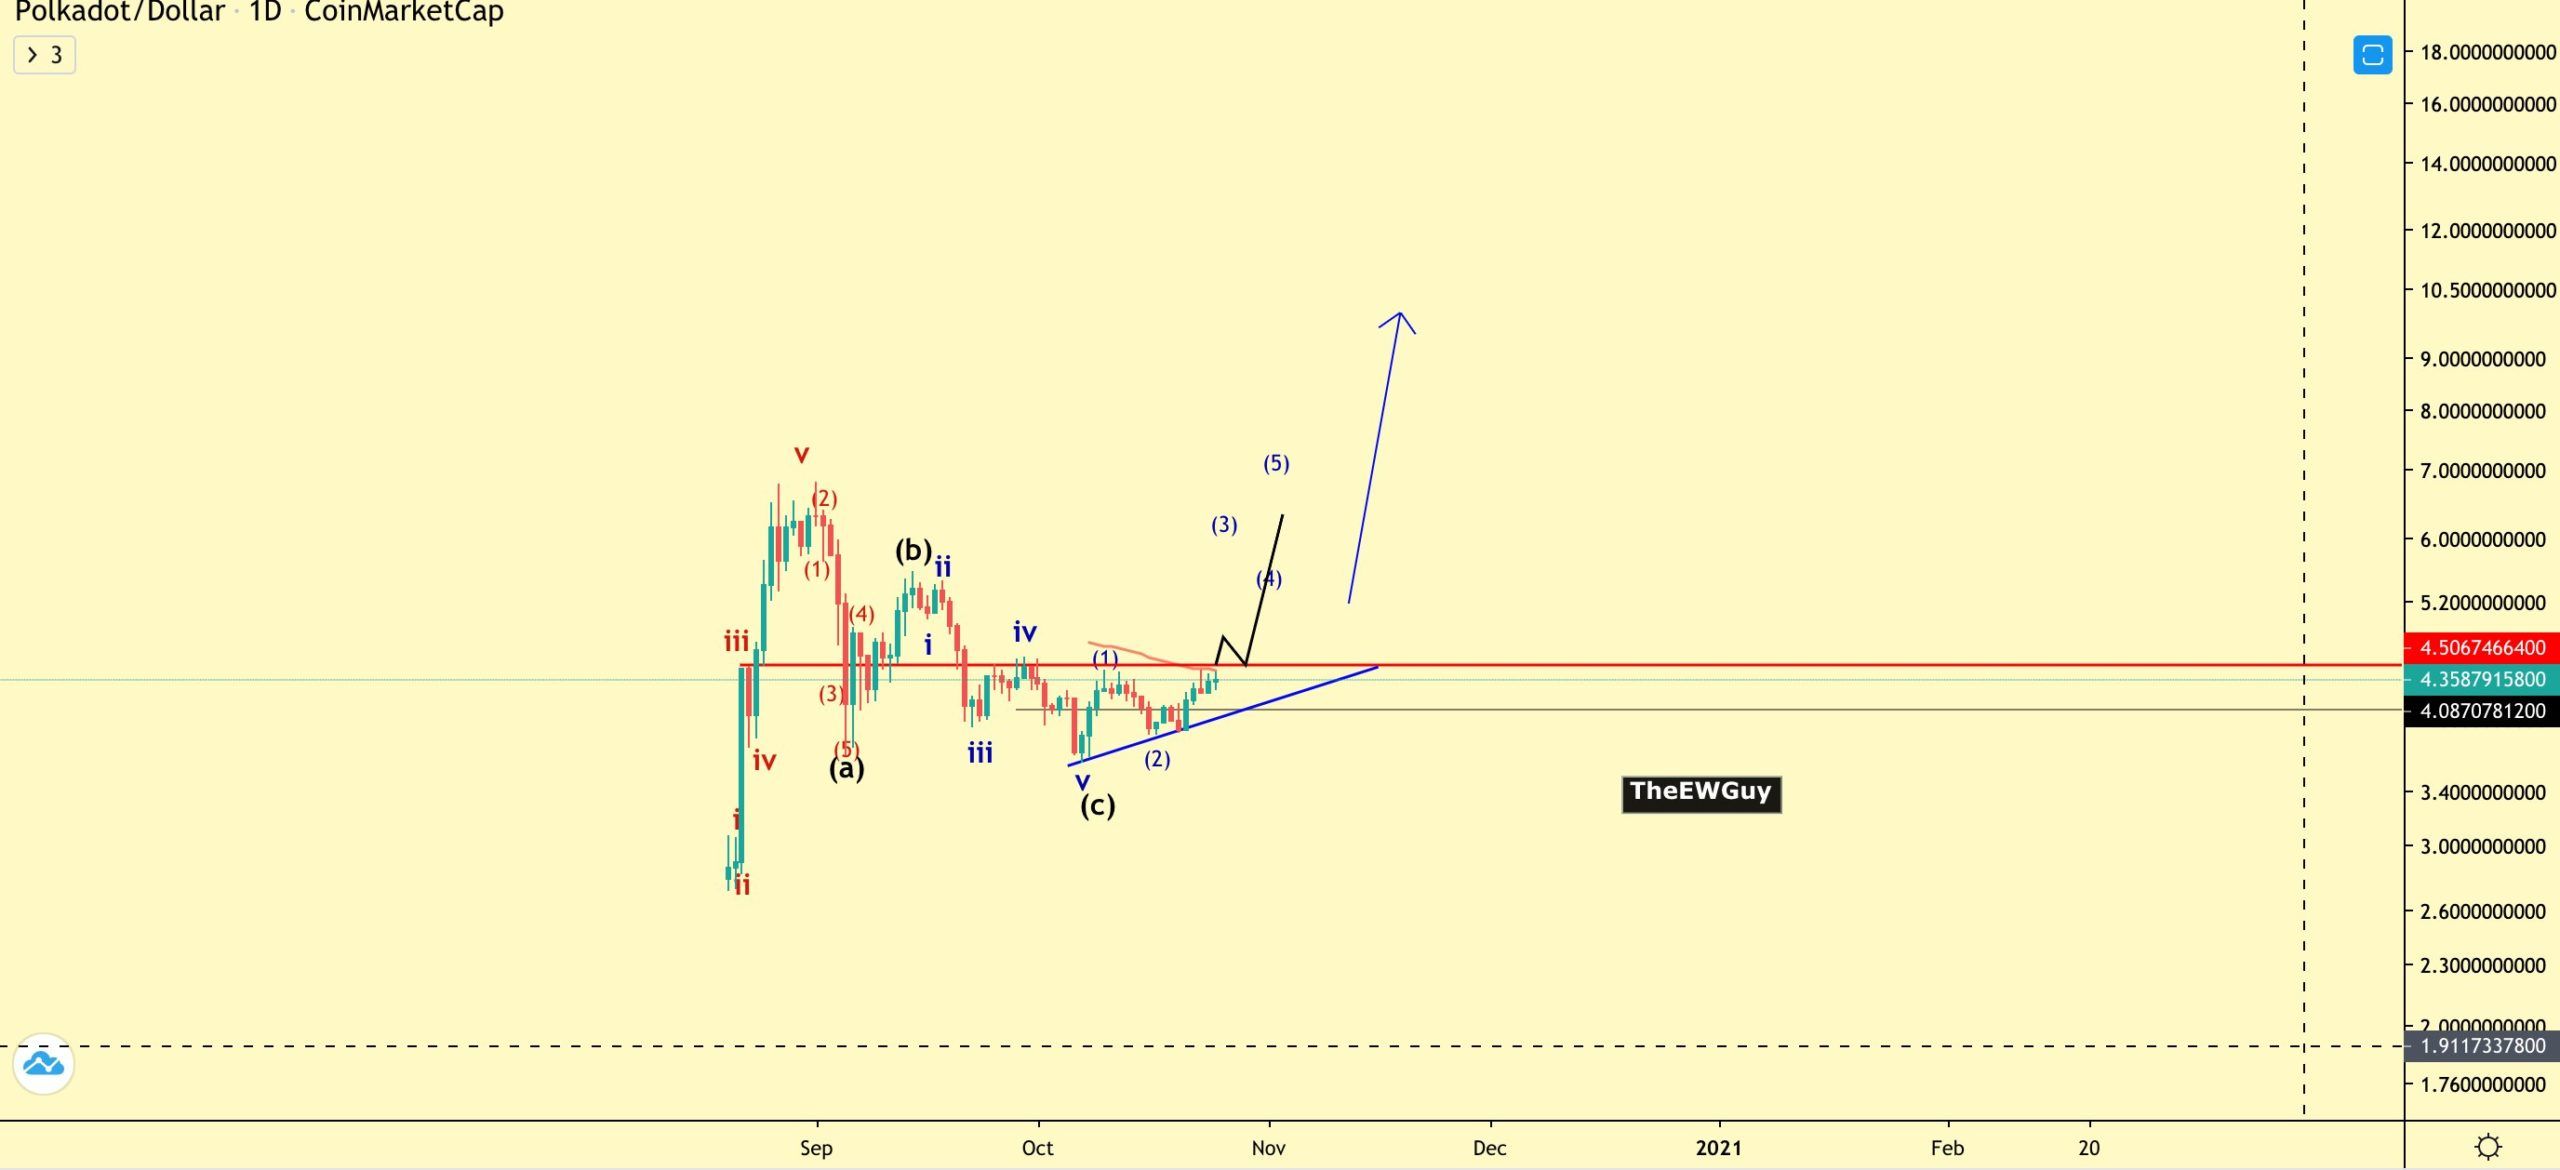
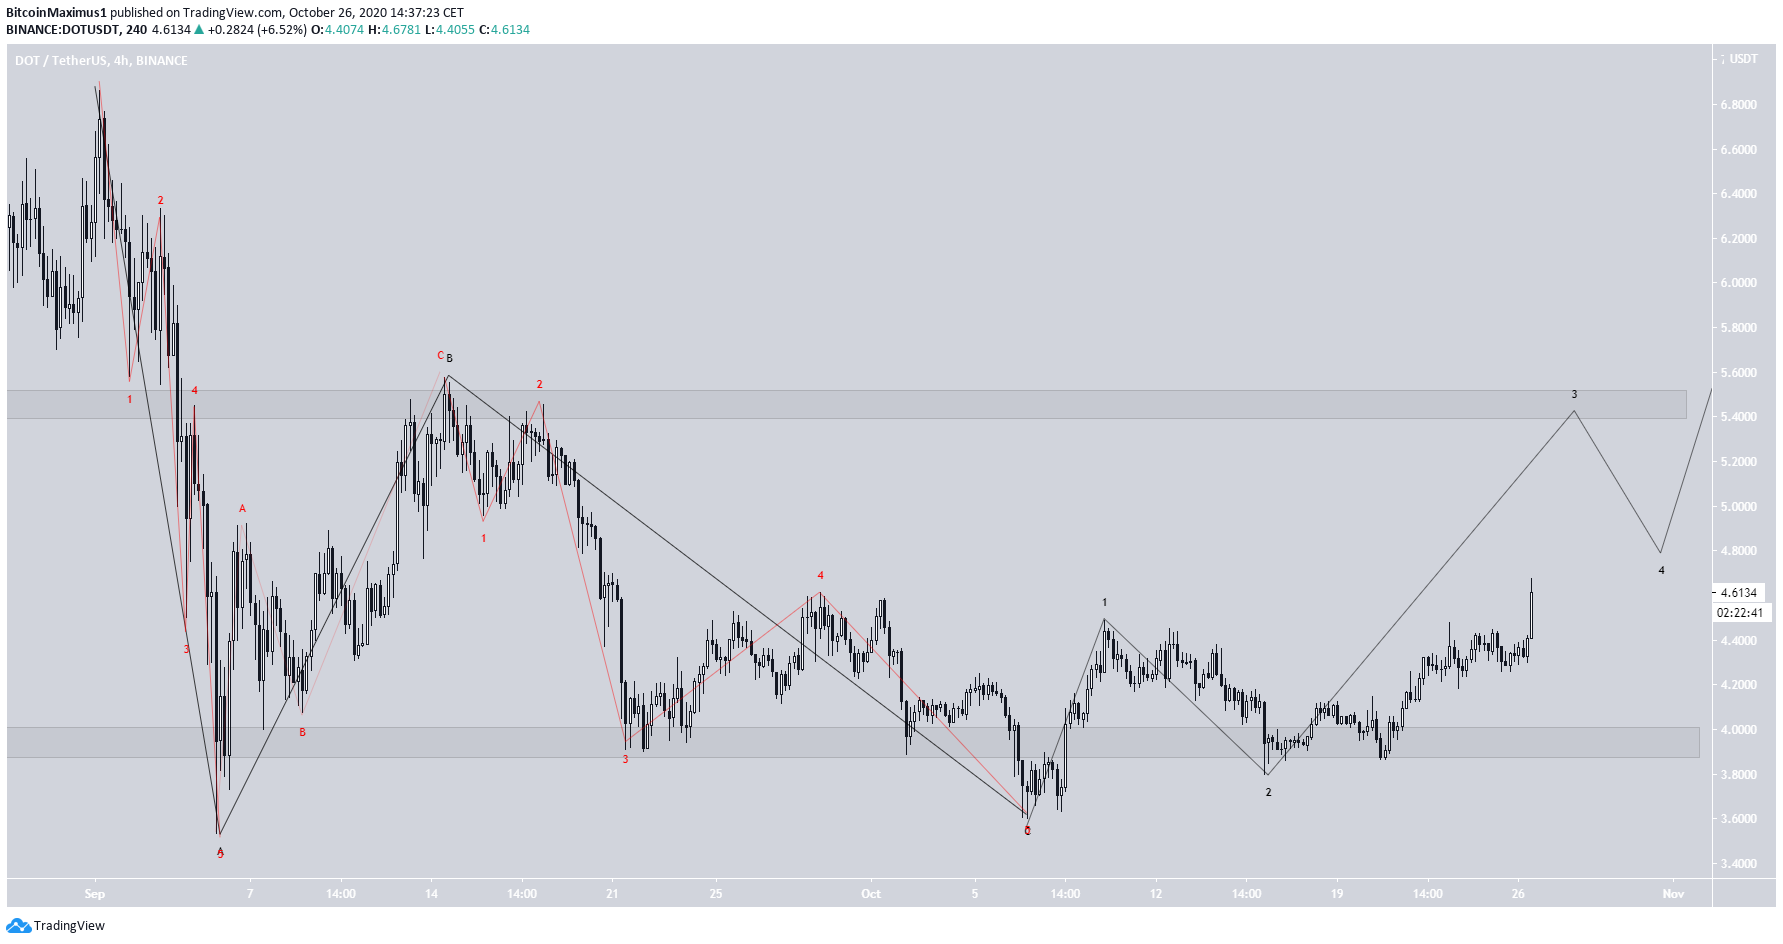
The price completed a bearish A-B-C correction (shown in black below) with the $3.60 low reached on Oct 7.
DOT looks to have begun a new bullish impulse (black) that is currently in wave 3. This wave is expected to end near the previously outlined resistance area between $5.18-$5.58. This impulse is expected to conclude with new highs.
A decrease below the wave 2 low at $3.80 would invalidate this particular wave count.
DOT/BTC
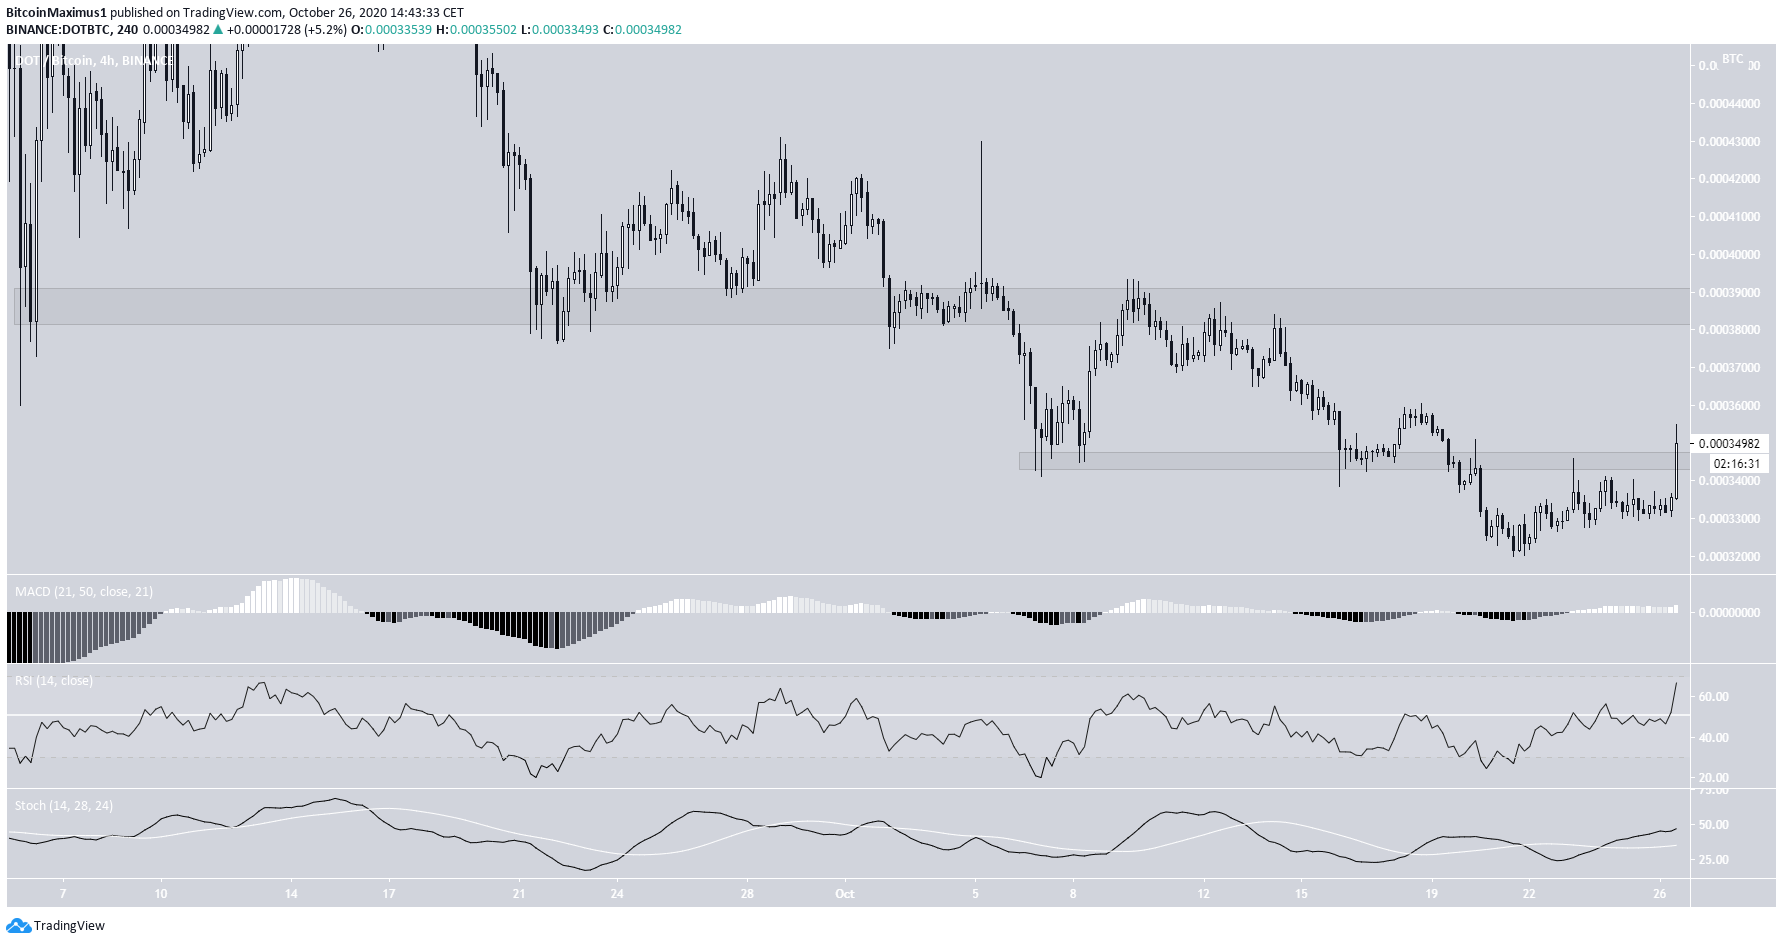
The DOT/BTC price movement is not as clear as its USD counterpart. At the time of press, DOT/BTC was pulling back slightly after yesterday’s close just under 37.000 satoshis.
Even though technical indicators are bullish, the 39,000 satoshi area had been acting as support since the beginning of September and is likely going to be difficult to break. Therefore, while an increase to 39,000 satoshis seems likely, we cannot yet confidently predict a breakout.
The loss of the current 34,500 satoshi support area could trigger a rapid decrease towards 25,000 satoshis.
For BeInCrypto’s previous Bitcoin analysis, click here!
Disclaimer: Cryptocurrency trading carries a high level of risk and may not be suitable for all investors. The views expressed in this article do not reflect those of BeInCrypto.
