


During the week of Oct 19-26, Bitcoin (BTC) reached a close above $13,000. While the long-term trend is bullish, the short-term chart has begun to show weakness.
Whether the price breaks out or down from the current parallel channel will likely determine the direction of the short-term movement.
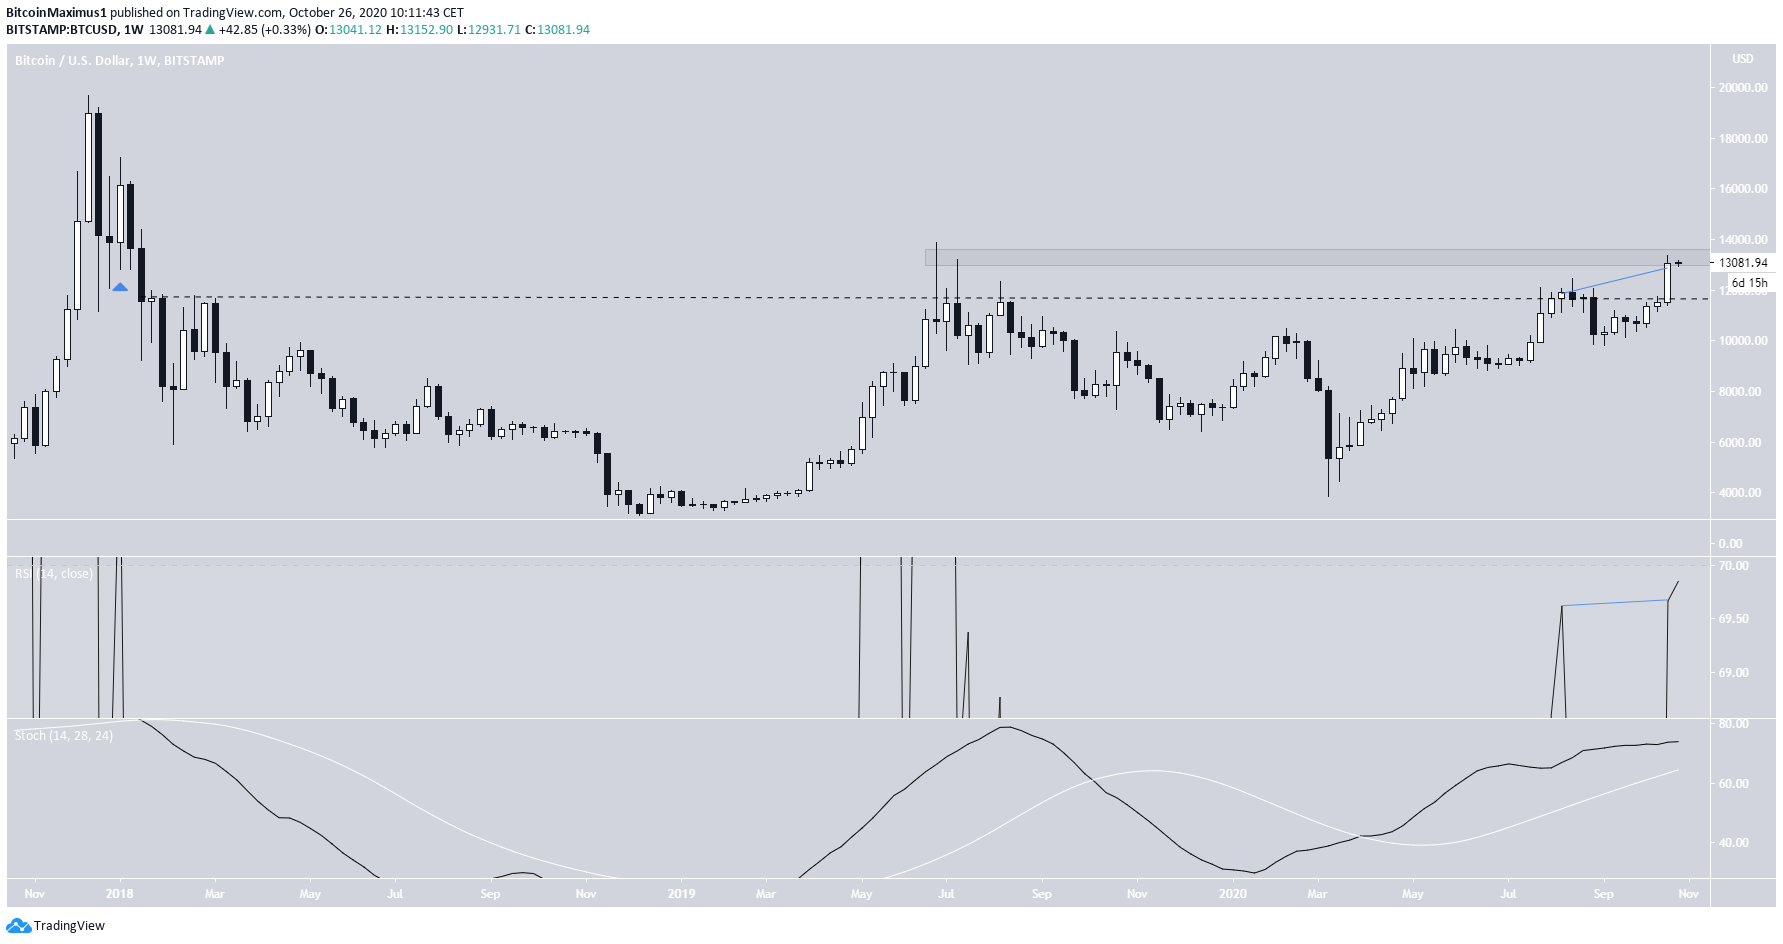
Bitcoin Bullish Weekly Close
During the week of Oct 19-26, the BTC price created a bullish engulfing candlestick with a body that measured 13.5% in magnitude. The weekly close of $13,039 was the highest reached since January 2018.
BTC is still trading close to the long-term $13,500-$14,000 resistance level created by the wick highs of July 2019. However, it has already moved above the resistance area of $11,800, created by the weekly closes since February 2018 (shown with the dashed line below).
Therefore, it’s possible that Bitcoin has already cleared a crucial resistance level, a hypothesis that would be strengthened by a sustained move above $13,500.
It’s worth noting that the recent increase did not generate a bearish divergence in the RSI, since the recent RSI high was slightly higher than that on Aug 17. Furthermore, the Stochastic Oscillator is still increasing, so there is no weakness present yet in the weekly time-frame.
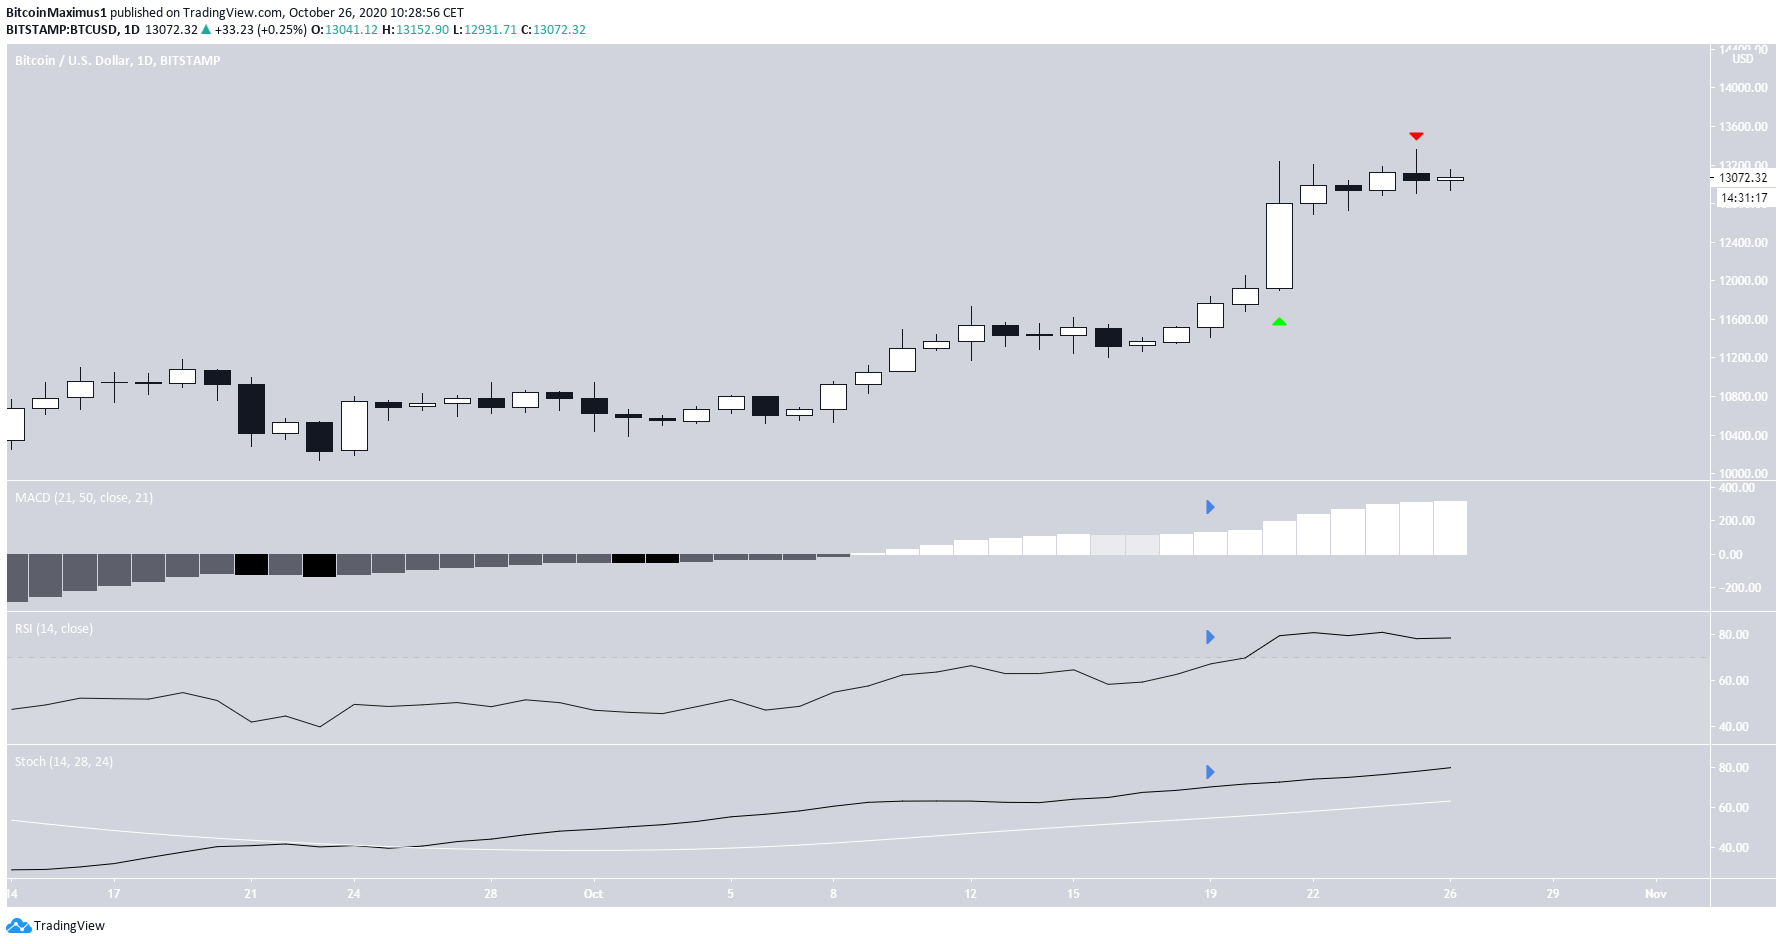
In the daily time-frame, the price has been increasing since the bullish engulfing candlestick of Oct 21. While BTC created a small bearish candlestick on Oct 25, there are no clear signs of weakness in the daily time-frame yet.
The MACD, RSI, and Stochastic Oscillator are increasing and haven’t generated any bearish divergence.
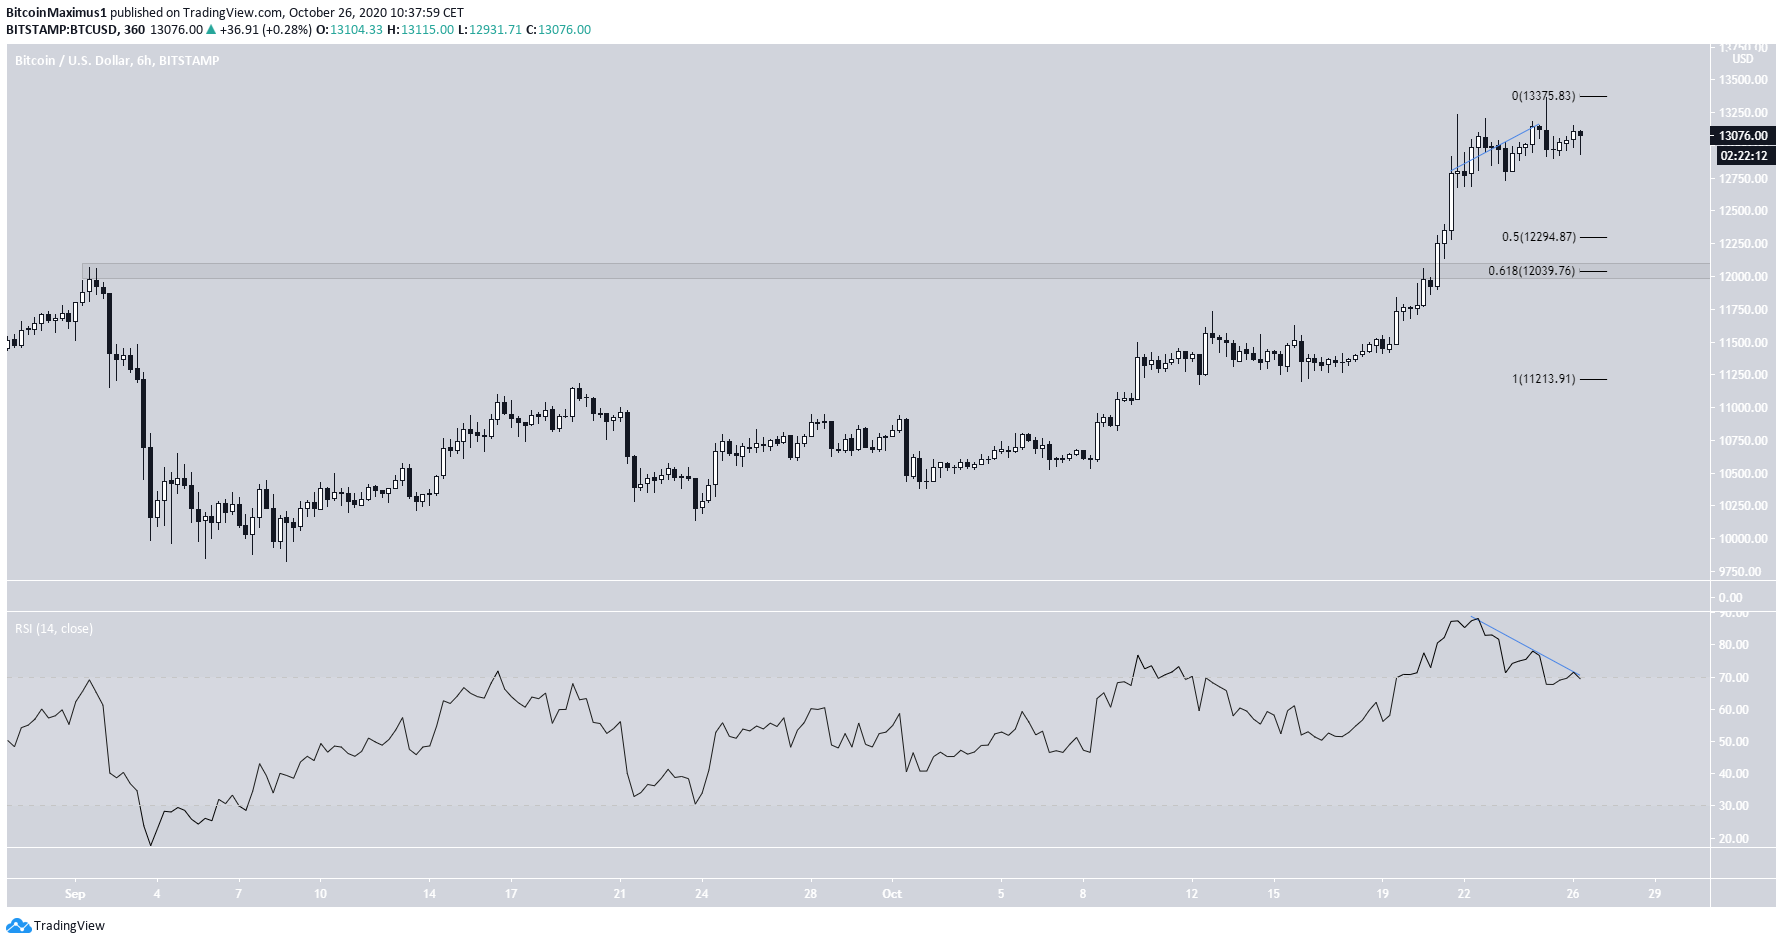
Short-Term Weakness
The shorter-term six and two-hour-chart shows the first signs of weakness in their trading structures.
During the two most recent tops, the RSI has generated some bearish divergence and the price has created a shooting star candlestick.
These are bearish signs that indicate a correction might soon follow. If it does, the closest support levels are found near $12,300 and $12,040, the 0.5-0.618 Fib levels of the most recent increase. The latter also coincides with a previous resistance area, which is now expected to act as support.
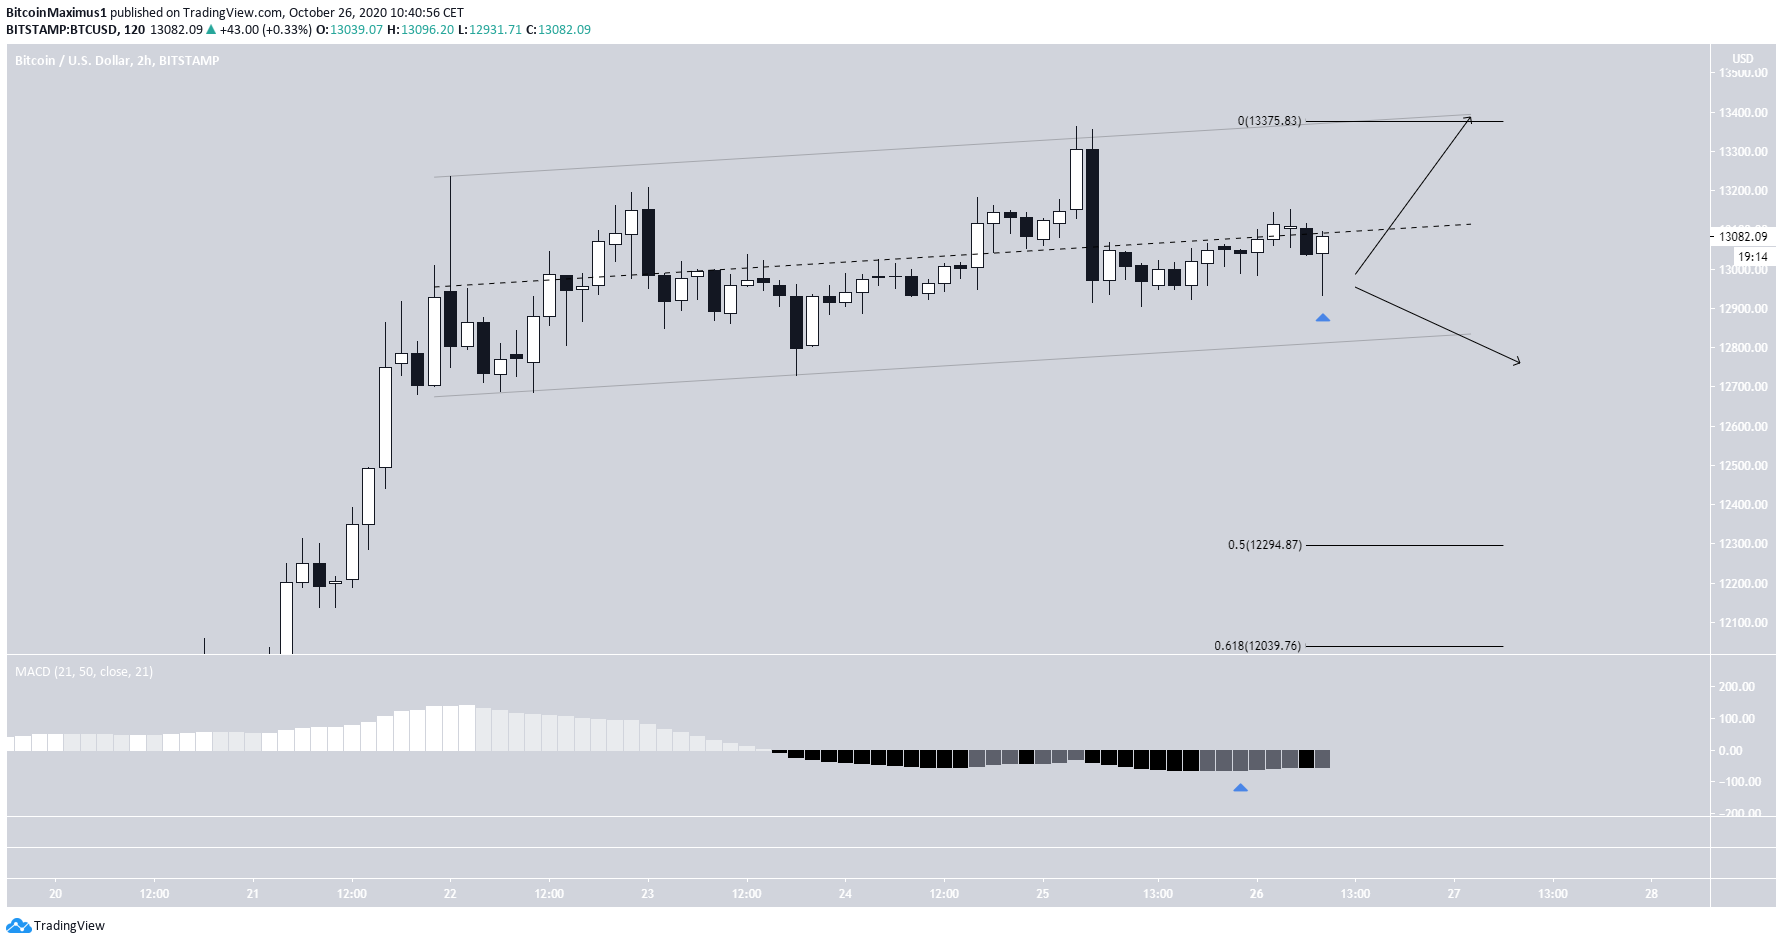
The two-hour chart shows a possible parallel ascending channel. At the time of writing, the price was in the process of creating a hammer candlestick and moving above the middle of the channel.
Whether BTC breaks out or down from the channel could be the short-term trigger that determines the direction of the next trend. A breakdown would likely take the price towards the previously outlined support levels, while a breakout could cause a re-test of the $13,500-$14,000 long-term resistance area.
Due to the weakness in the short/medium-term time-frames, a breakdown seems slightly more likely. Despite this, the long-term trend is bullish.
To conclude, the BTC price is likely in a bullish trend, but a short-term drop could transpire before the price resumes its upward movement.
For BeInCrypto’s previous Bitcoin analysis, click here!
Disclaimer: Cryptocurrency trading carries a high level of risk and may not be suitable for all investors. The views expressed in this article do not reflect those of BeInCrypto.


