
On Aug 30, Polkadot (DOT) broke out from the $29 resistance area with considerable volume.
If DOT is successful in holding on above this level, the next resistance target would be found at $41.35.
Parabolic increase
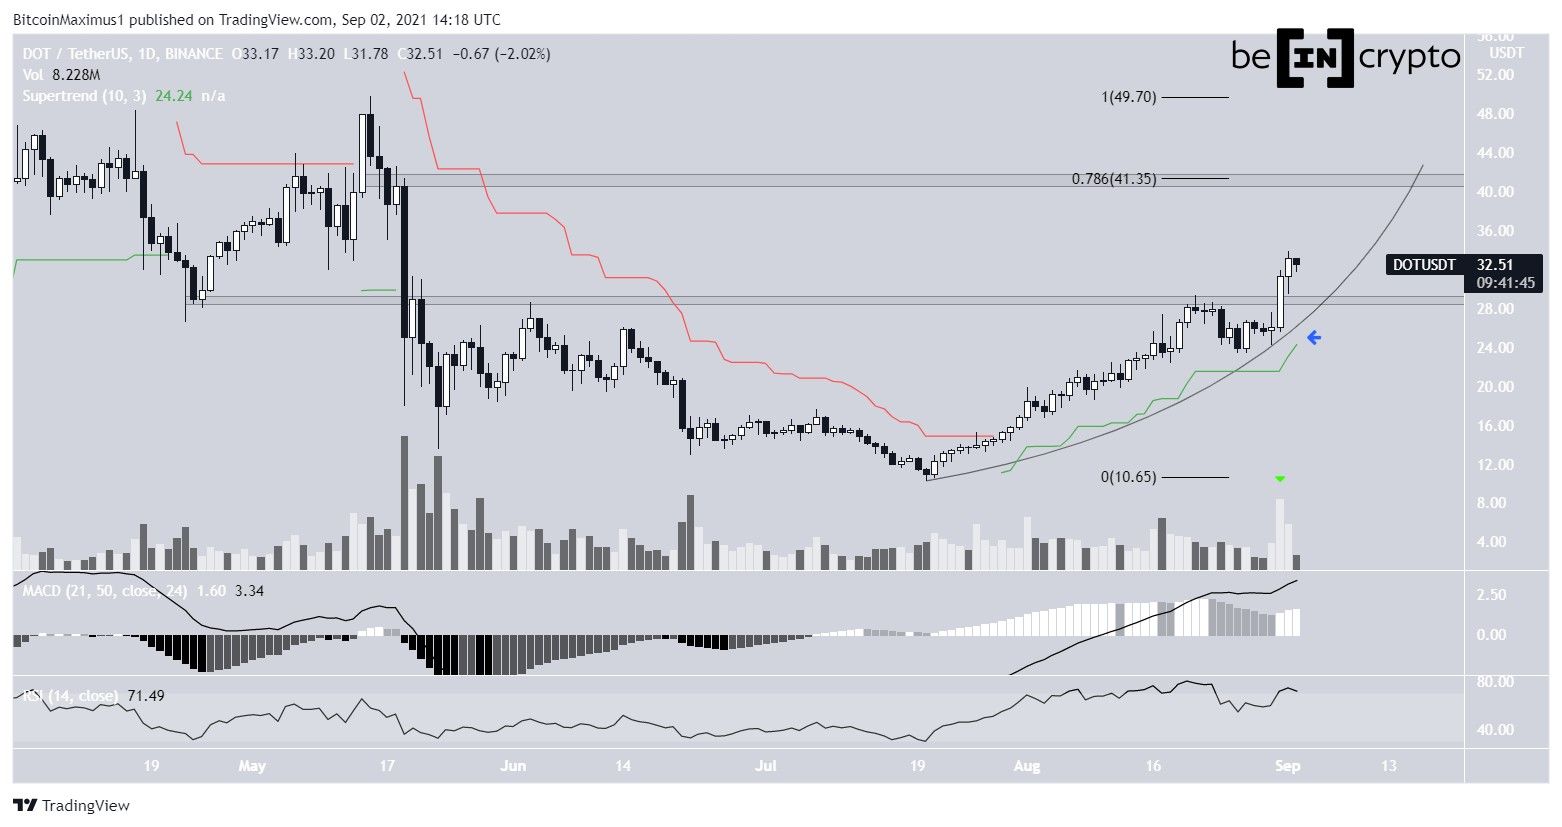
Polkadot has been increasing since July 20. On Aug 21, it reached a high of $29.35 but fell almost immediately after it was rejected by the $29 resistance area.
However, it initiated another upward move on Aug 30 and broke out above the $29 resistance area the next day. The breakout transpired with considerable volume (green icon).
While there is a bearish divergence developing in the RSI, it has just moved above 70. Furthermore, the MACD is still increasing and the supertrend is bullish.
Even though there is no discernible pattern, it’s possible that DOT is following a parabolic ascending support line that coincides with the bullish supertrend line on Aug 30 (blue arrow).
The next resistance area is found at $41.35. This is a horizontal area that also coincides with the 0.786 Fib retracement resistance level. On the other hand, the $29 area is now expected to act as support.
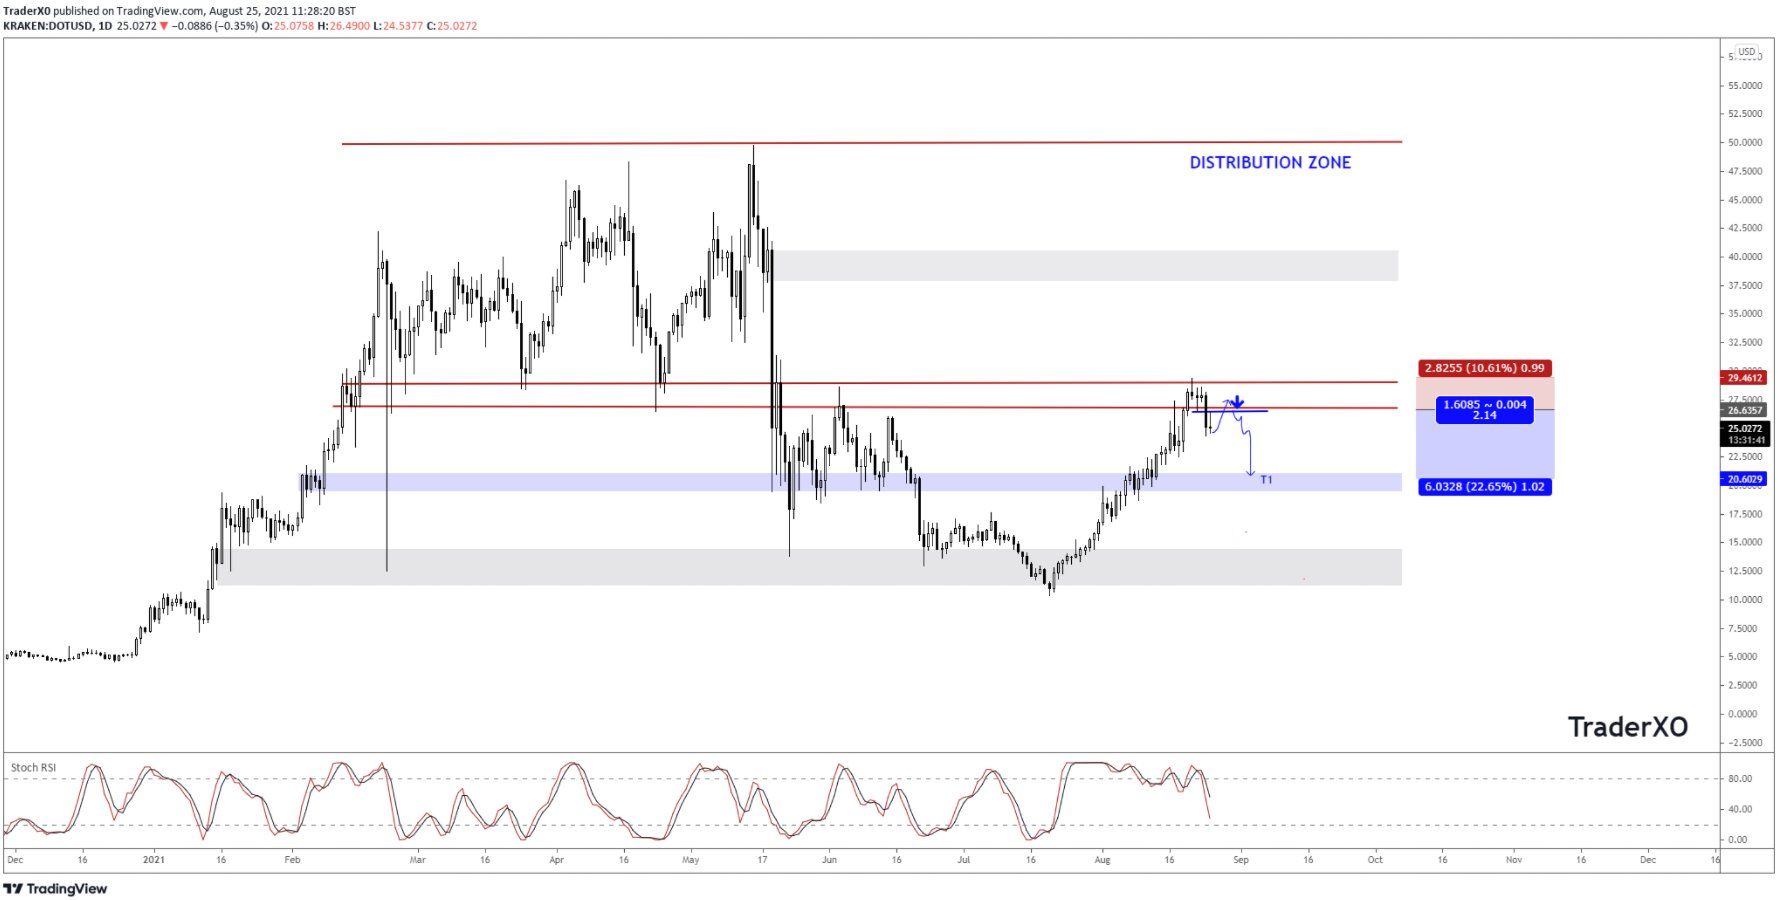
Cryptocurrency trader @Trader_XO outlined a DOT chart, stating that the token is facing strong resistance at $28. As seen above, DOT was initially rejected by the area but has since broken out. The next resistance area outlined at $41 coincides with that in the previous chart.
DOT/BTC
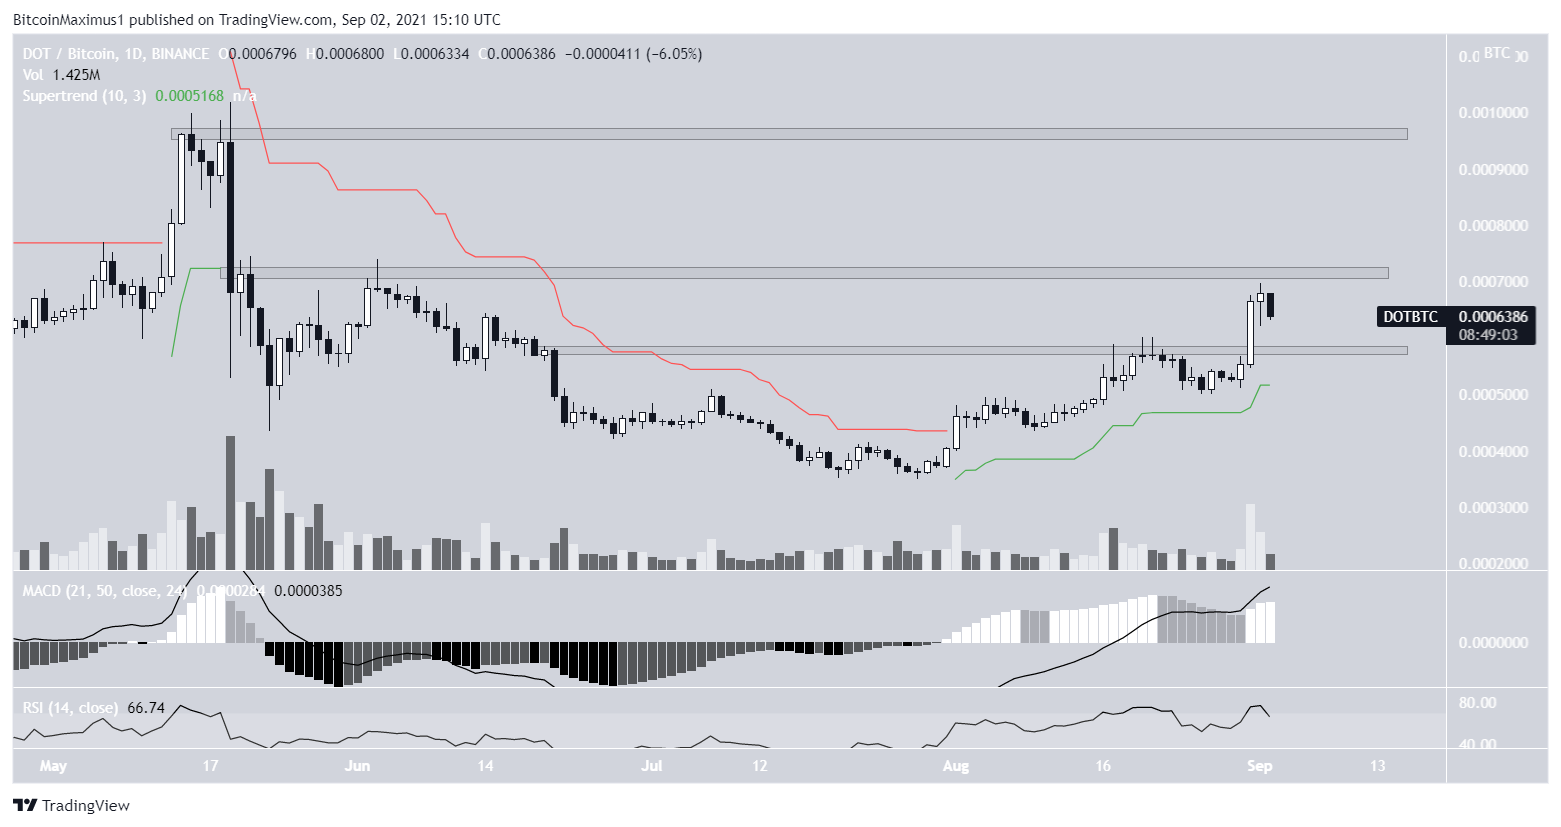
Similar to the USD pair, DOT/BTC has been moving upwards since July 28. On Aug 31, it reached a high of 69,000 satoshis.
While it has been decreasing since, it’s still trading above the 58,000 satoshi area, which is now expected to act as support.
Furthermore, technical indicators are bullish. The MACD and RSI are both increasing and the supertrend is bullish.
The closest resistance area is found at 72,000 satoshis. A breakout above this level could take the token all the way to 96,000 satoshis.
For BeInCrypto’s latest Bitcoin (BTC) analysis, click here.
