


Pi Network’s price is hanging by a thread. Currently trading just above $0.44, the token is at risk of dropping 10% to the $0.40 zone.
But while most indicators flash red, one key signal is hinting that bulls might still be watching. If PI price manages to reclaim $0.47, this bearish setup may be completely invalidated.
Supertrend Flashes Red
The Supertrend indicator, often used to spot the market’s direction, has been sitting above PI’s daily candles since mid-June. In simple terms, when the Supertrend appears above price action and is shaded red, it signals a strong downtrend; think of it as a warning light telling traders, “Don’t buy just yet.”
This red zone has kept expanding downward, suggesting sellers remain firmly in control.
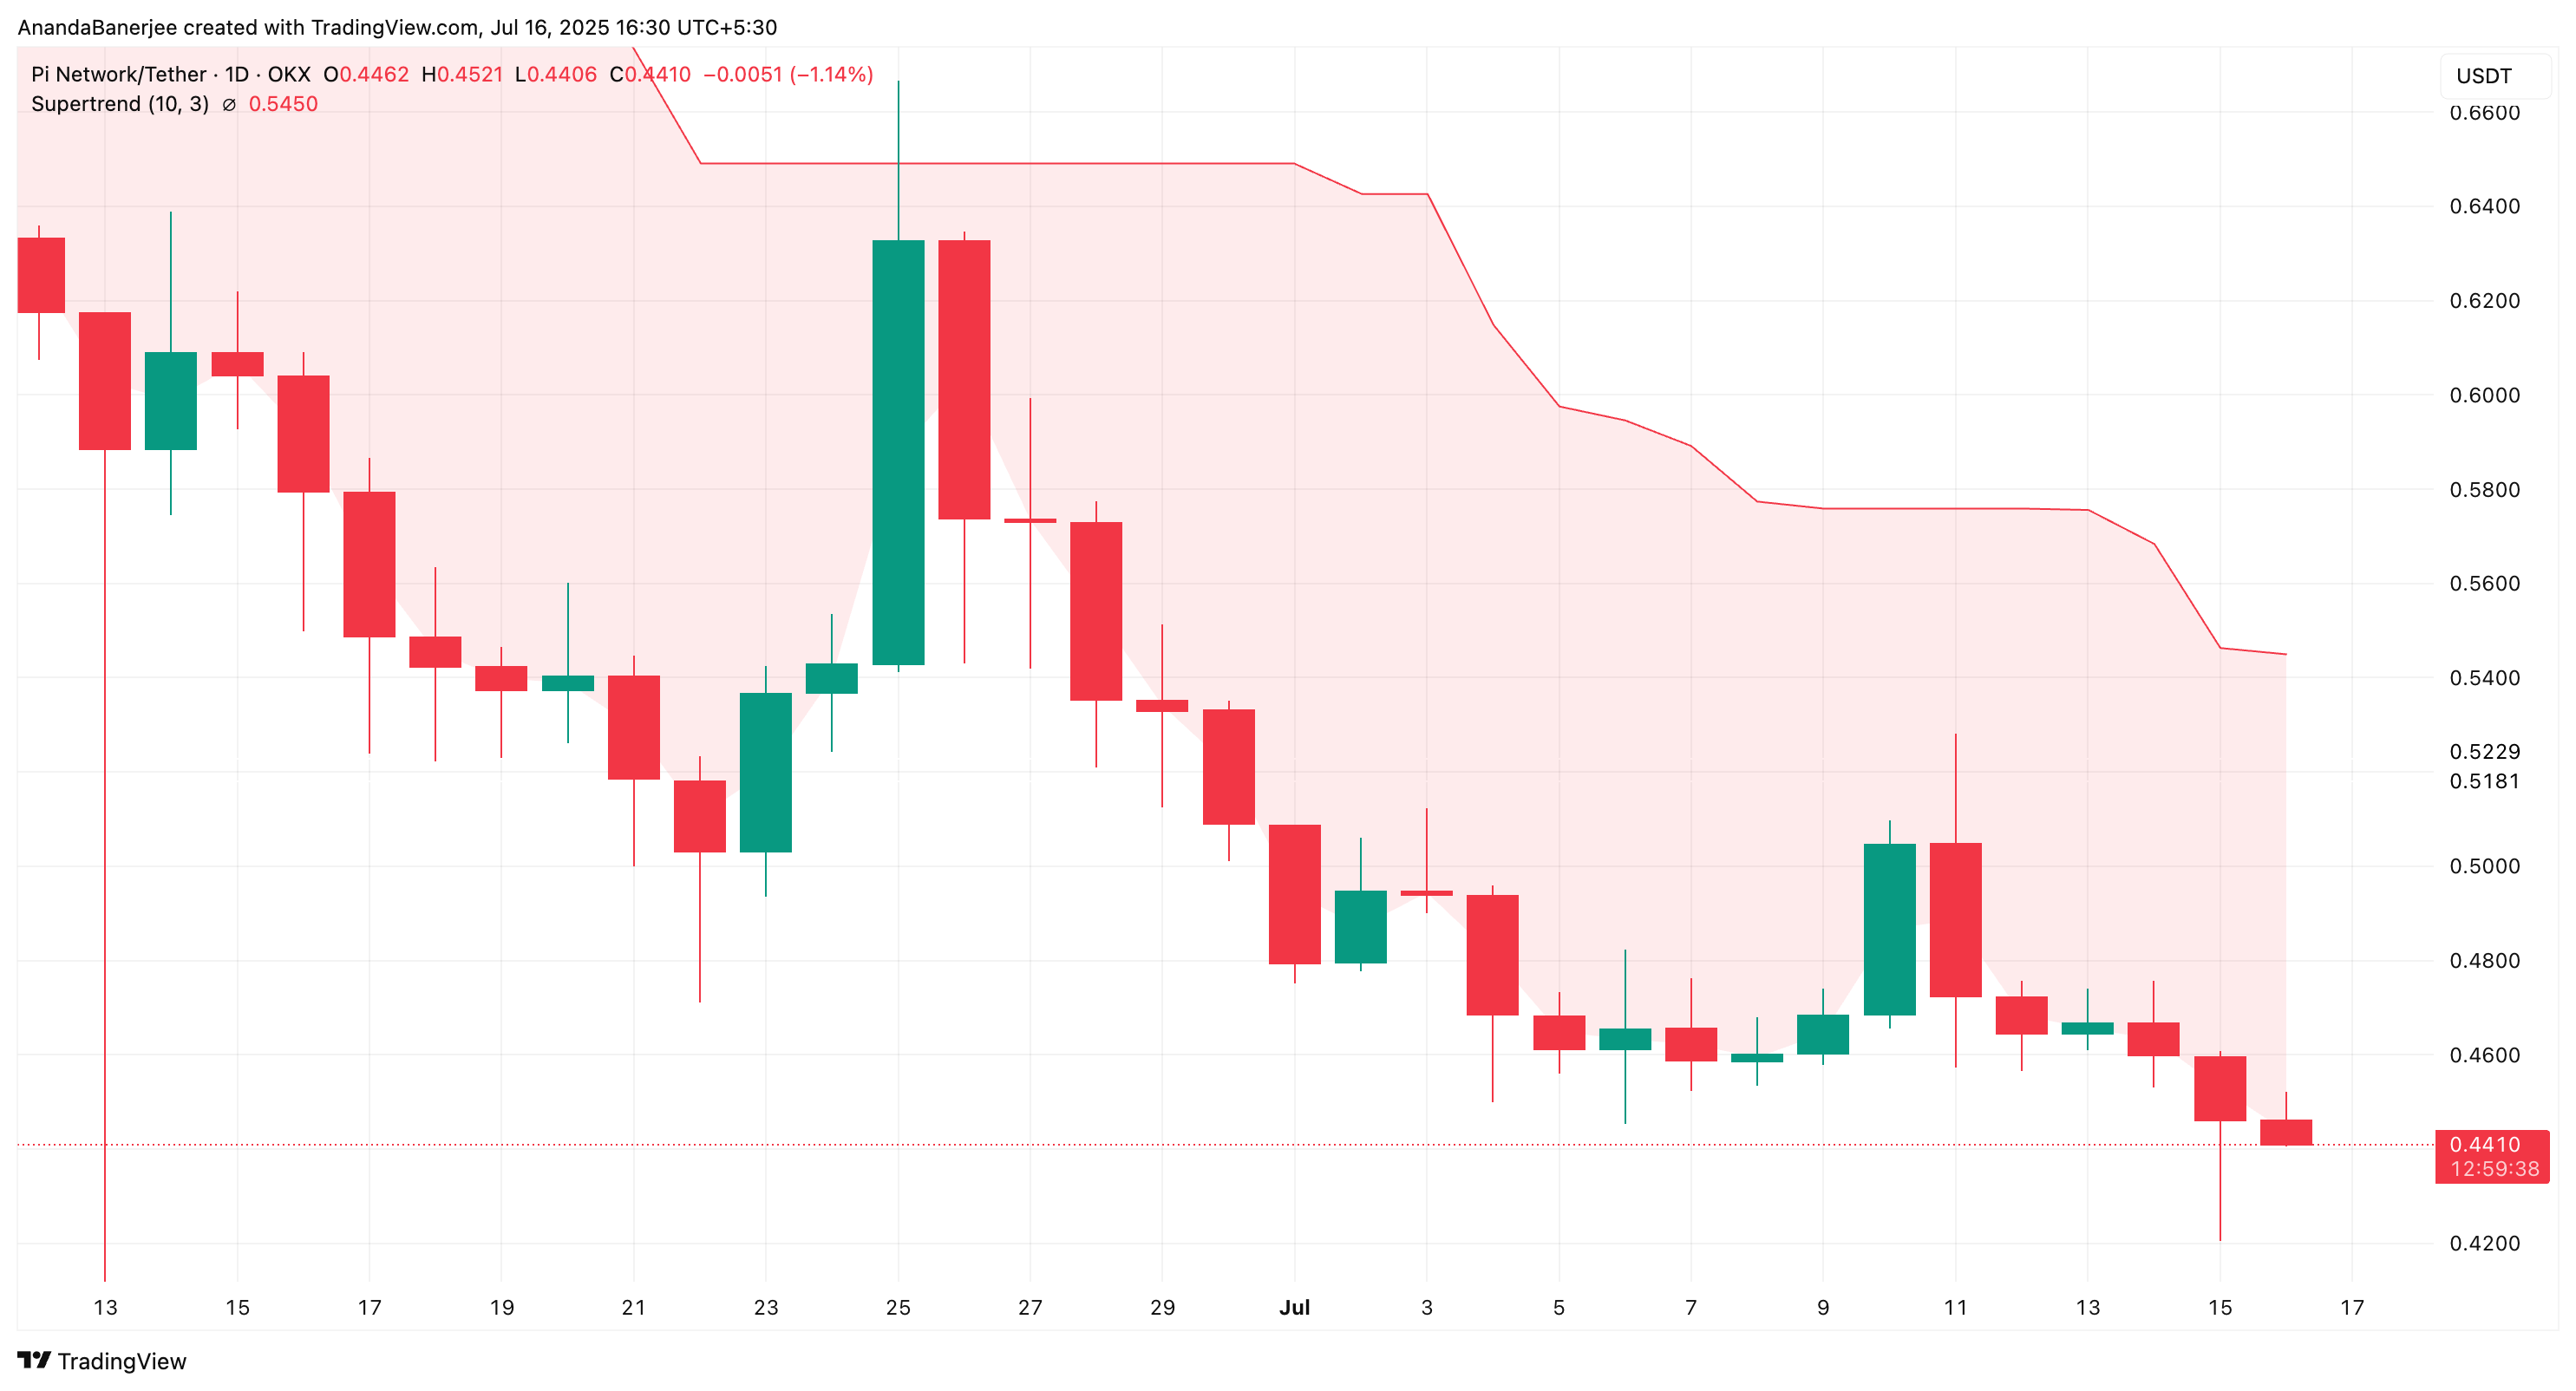
At the time of writing, the Supertrend’s resistance lies above $0.5450, far above the current price. Unless PI closes above that threshold, the signal remains bearish.
RSI Bullish Divergence is the Only Hope
Now for the twist. Despite the bearish price trend, the Relative Strength Index (RSI) is showing signs of hidden bullish divergence.
PI’s price has been making lower lows, between late June and July 15, but RSI, a momentum tracker, is forming higher lows. This mismatch often suggests that while price looks weak, buying pressure is quietly building under the surface.
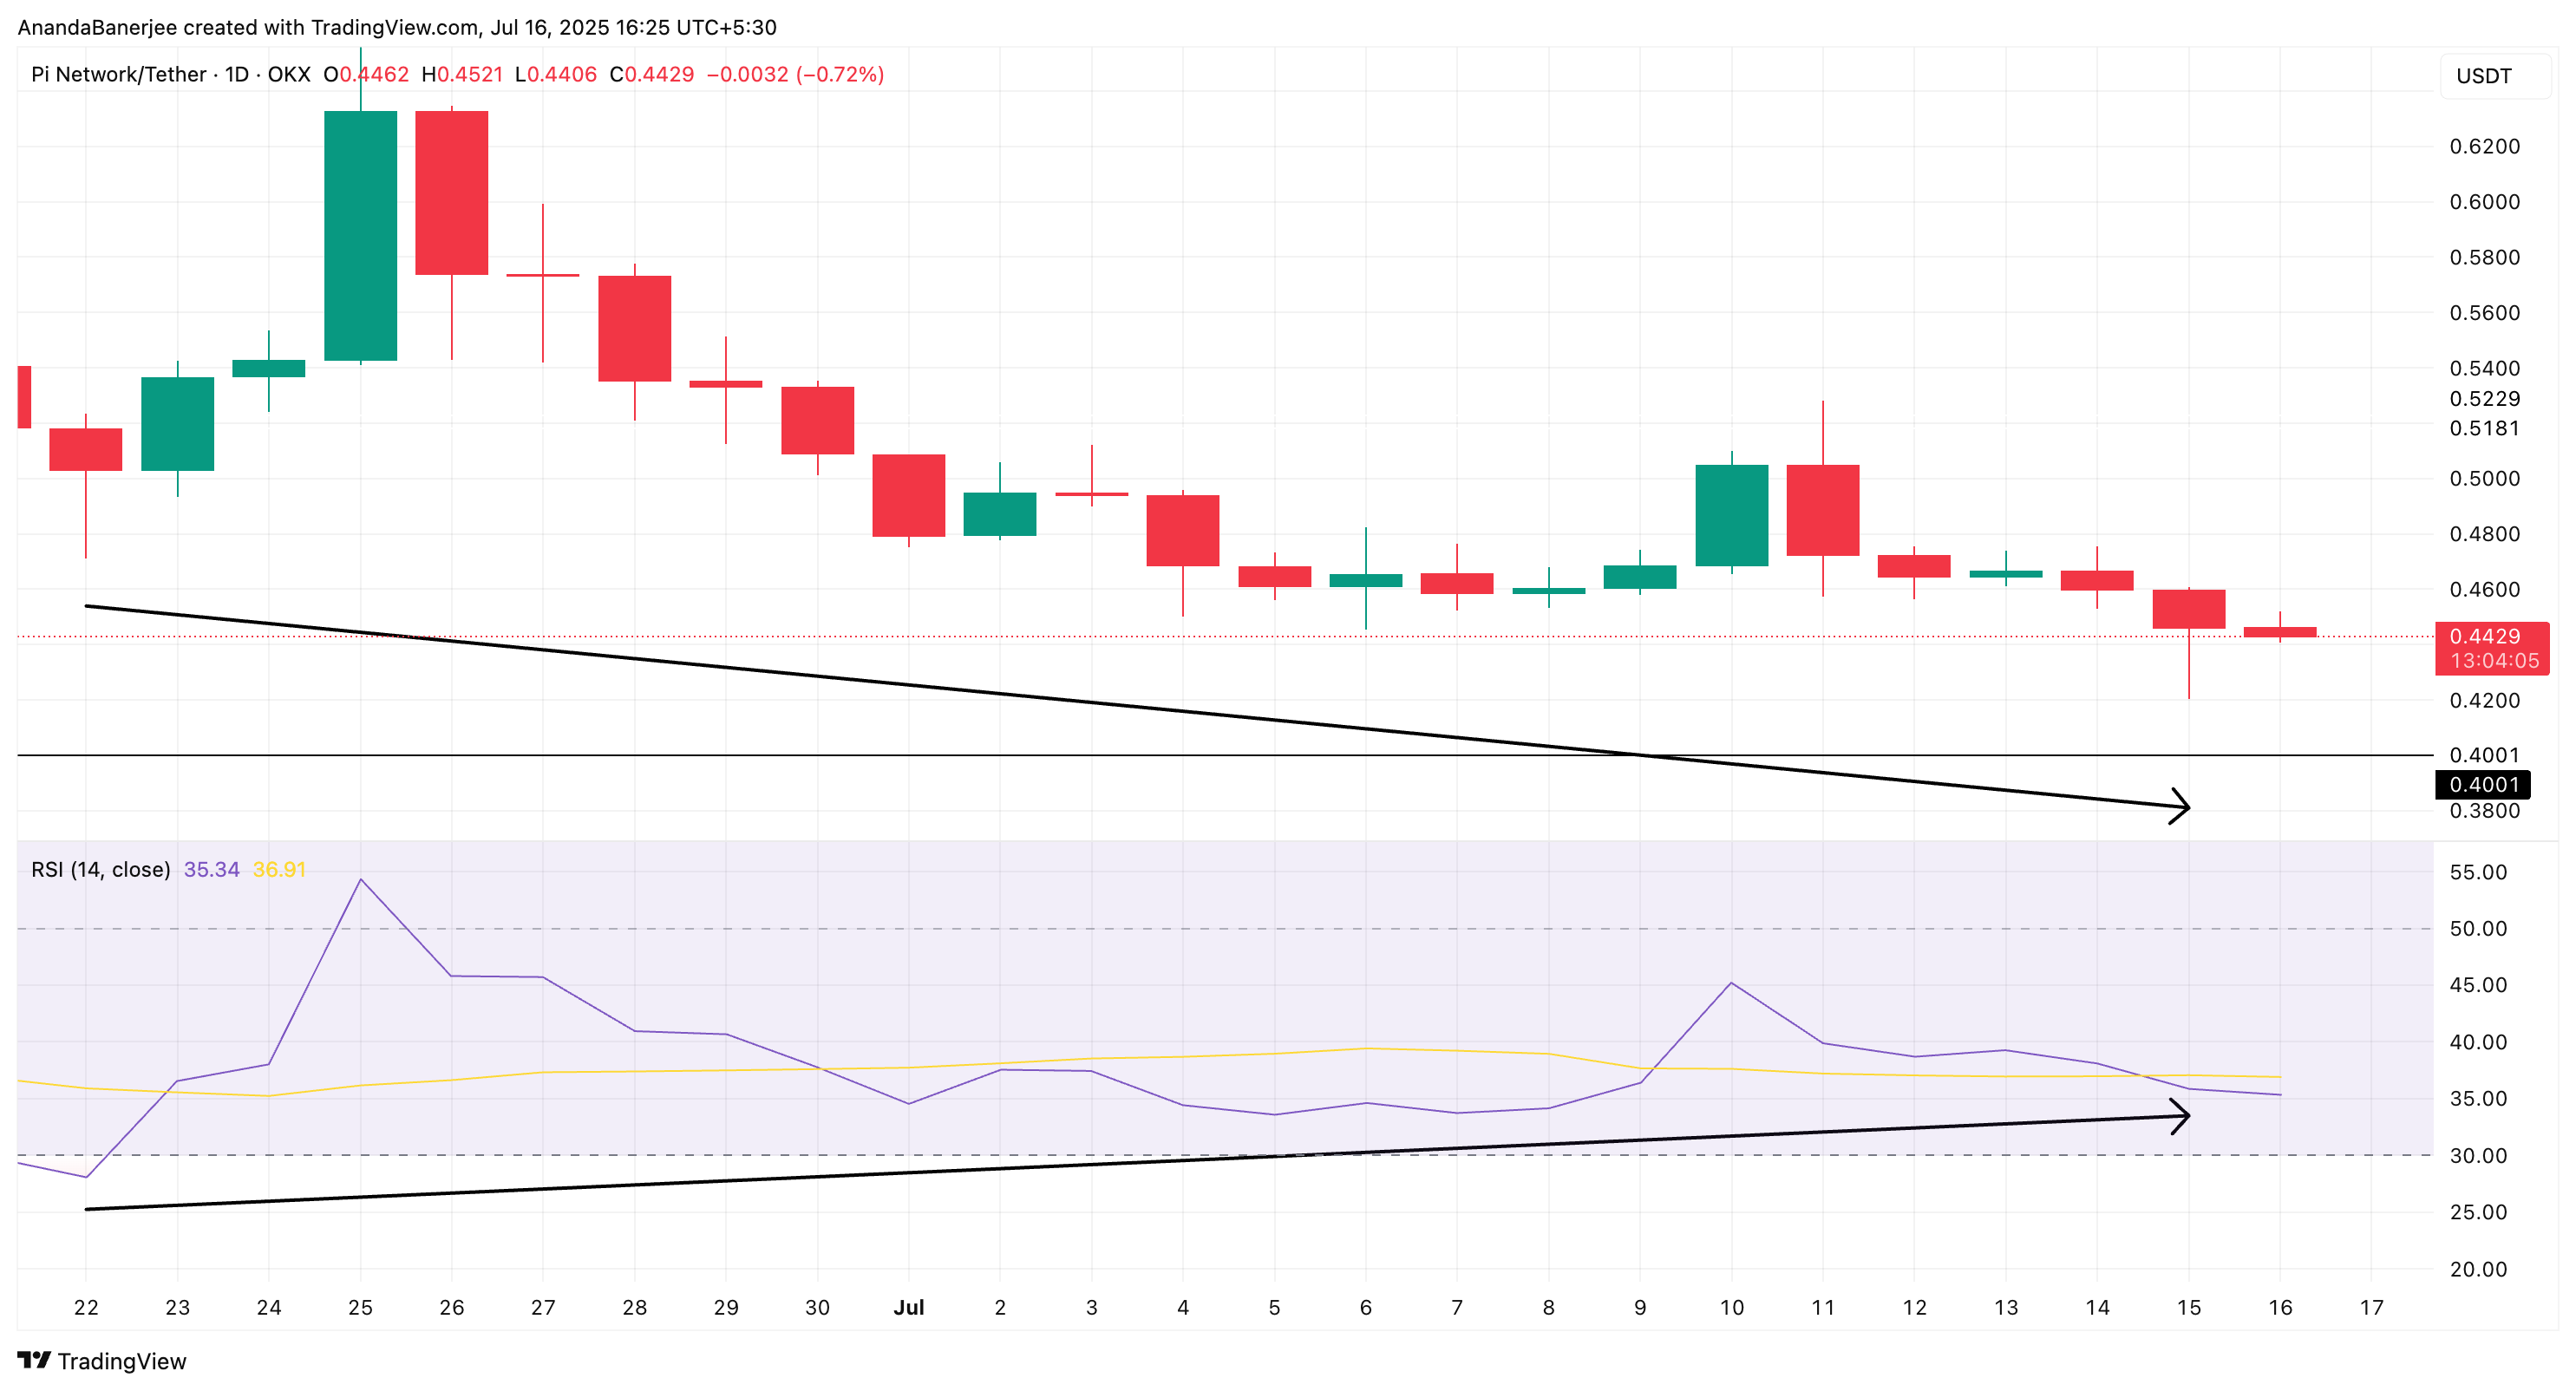
The Relative Strength Index (RSI) measures momentum by tracking how fast and how much a coin’s price has changed — values below 30 suggest it’s oversold, while values above 70 mean it’s overbought. PI, for now, is nearing the 36 levels on the RSI, indicating that it may soon enter oversold territory. If the market sentiments remain bullish, coin/token prices often turn up after entering the oversold zone.
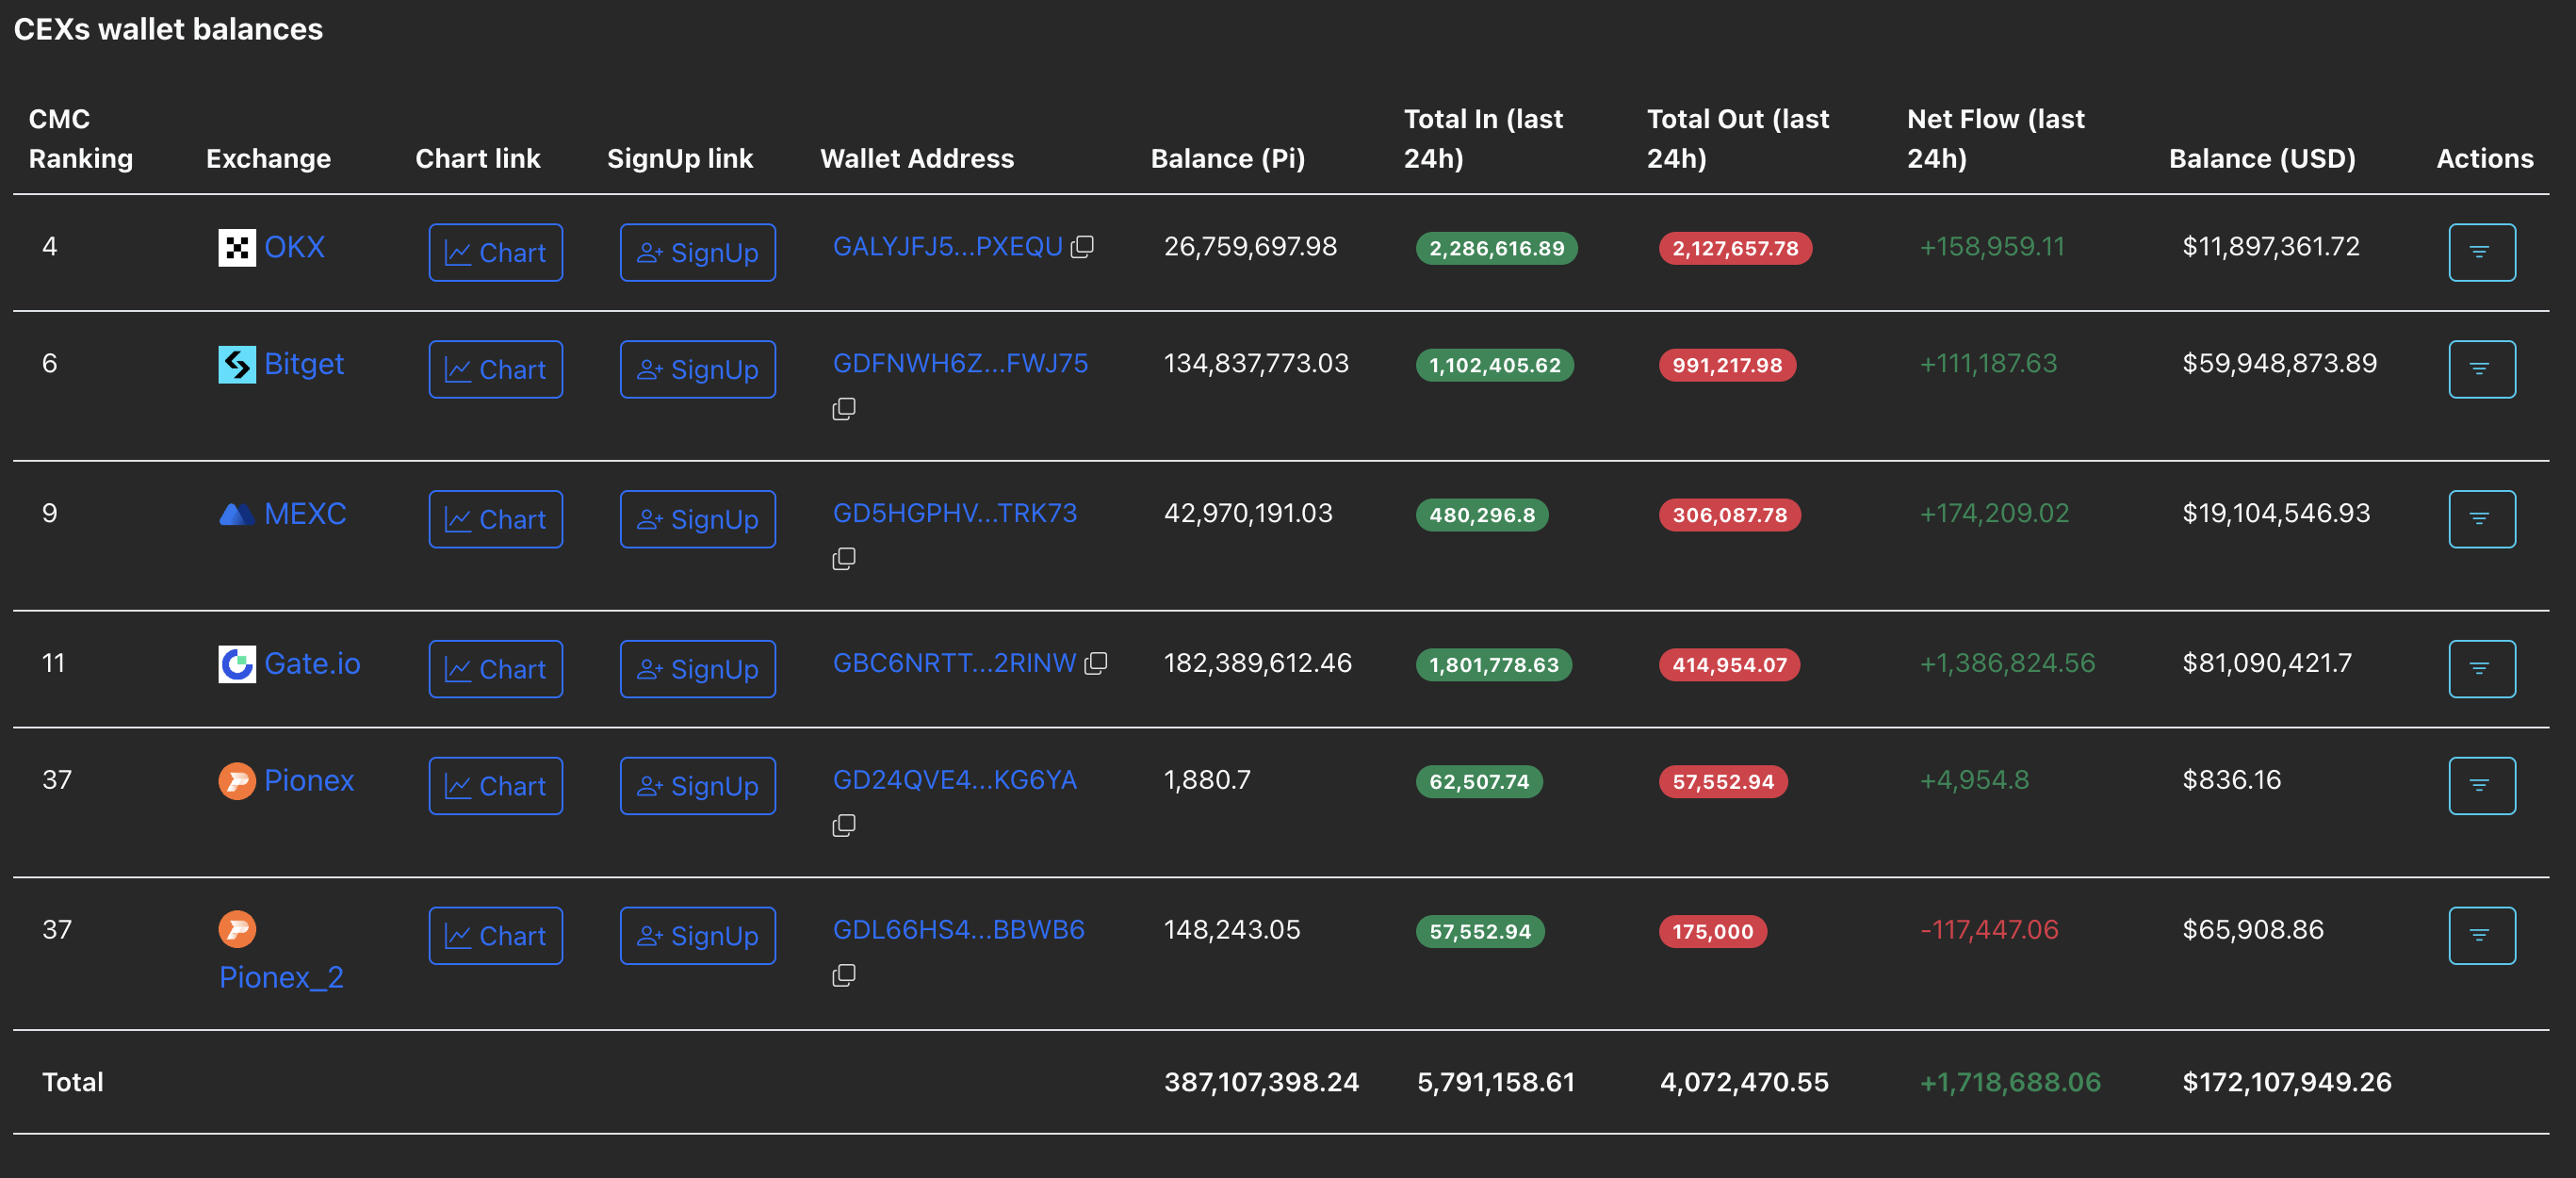
Exchange Flows Still Not Encouraging
While momentum may be improving, exchange inflows tell a different story. Over the past 24 hours, more than 5.7 million PI entered CEX wallets, according to PiScan data. That typically suggests selling pressure is still active, as traders move assets onto exchanges to potentially sell.
PI Price Analysis Hints at a 10% Dip
From a price structure standpoint, Pi Coin has lost its 0.23 Fibonacci level at $0.47 and is now consolidating around the $0.44 mark. The next major support is at $0.42, and if that breaks, the market could tumble another 10% from current levels.
This Fibonacci retracement pattern is plotted from the last swing high ($0.0067) to the recent swing low ($0.4200) and helps chart the downside risk, or rather bearish bias.
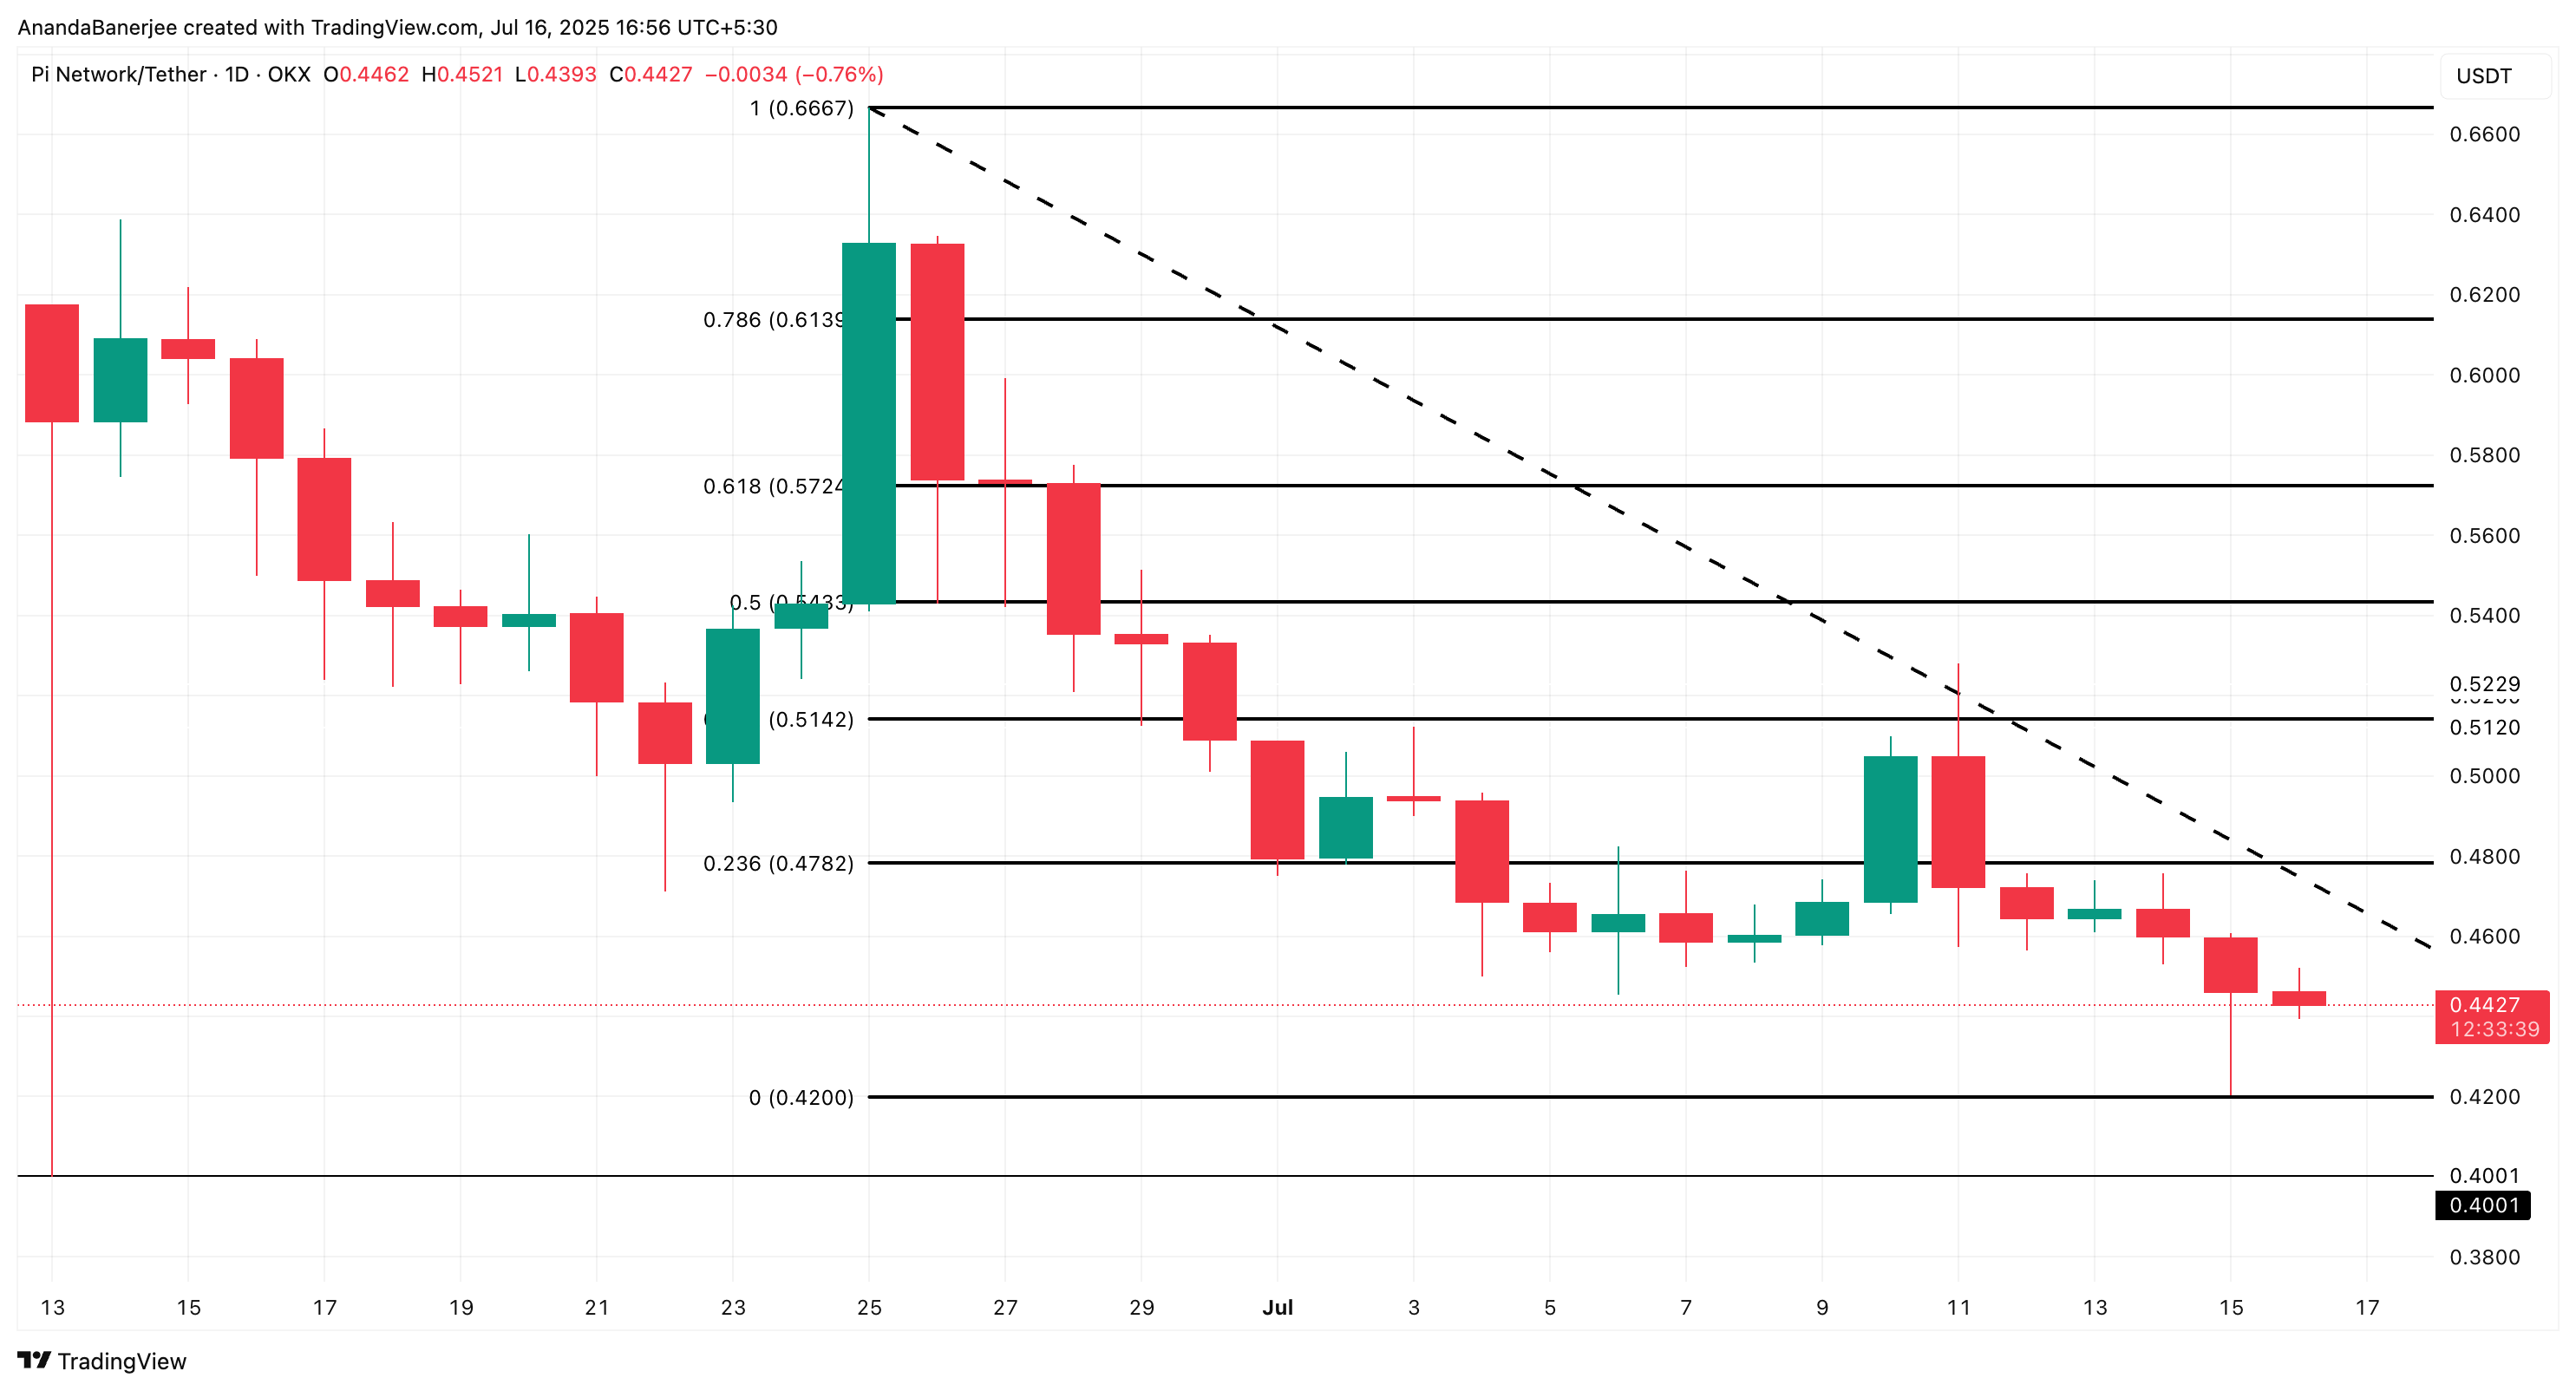
If the PI price manages to flip $0.47 into support, reclaiming the Fib, then bulls could regain short-term control. But until that happens, the trend remains down. A clear uptrend will surface if PI manages to break past $0.5142.
PI price risks a 10% crash toward $0.40 unless the bullish divergence plays out. For now, sellers are in control, but momentum indicators suggest this may not last forever.


