
PENDLE has experienced a strong wave of accumulation following its decline to a year-to-date low of $1.81 on March 11. Since then, the token has traded within an ascending parallel channel, signaling a sustained rally.
Today, PENDLE is up 15%, leading the market’s gains. With strengthening buying activity, the altcoin is poised to continue its rally.
PENDLE Soars 135% in Two Months
PENDLE has traded within an ascending parallel channel since March 11, reflecting its growing price over the past two months. At press time, the altcoin exchanges hands at $4.16, climbing 135% from the $1.81 price bottom.
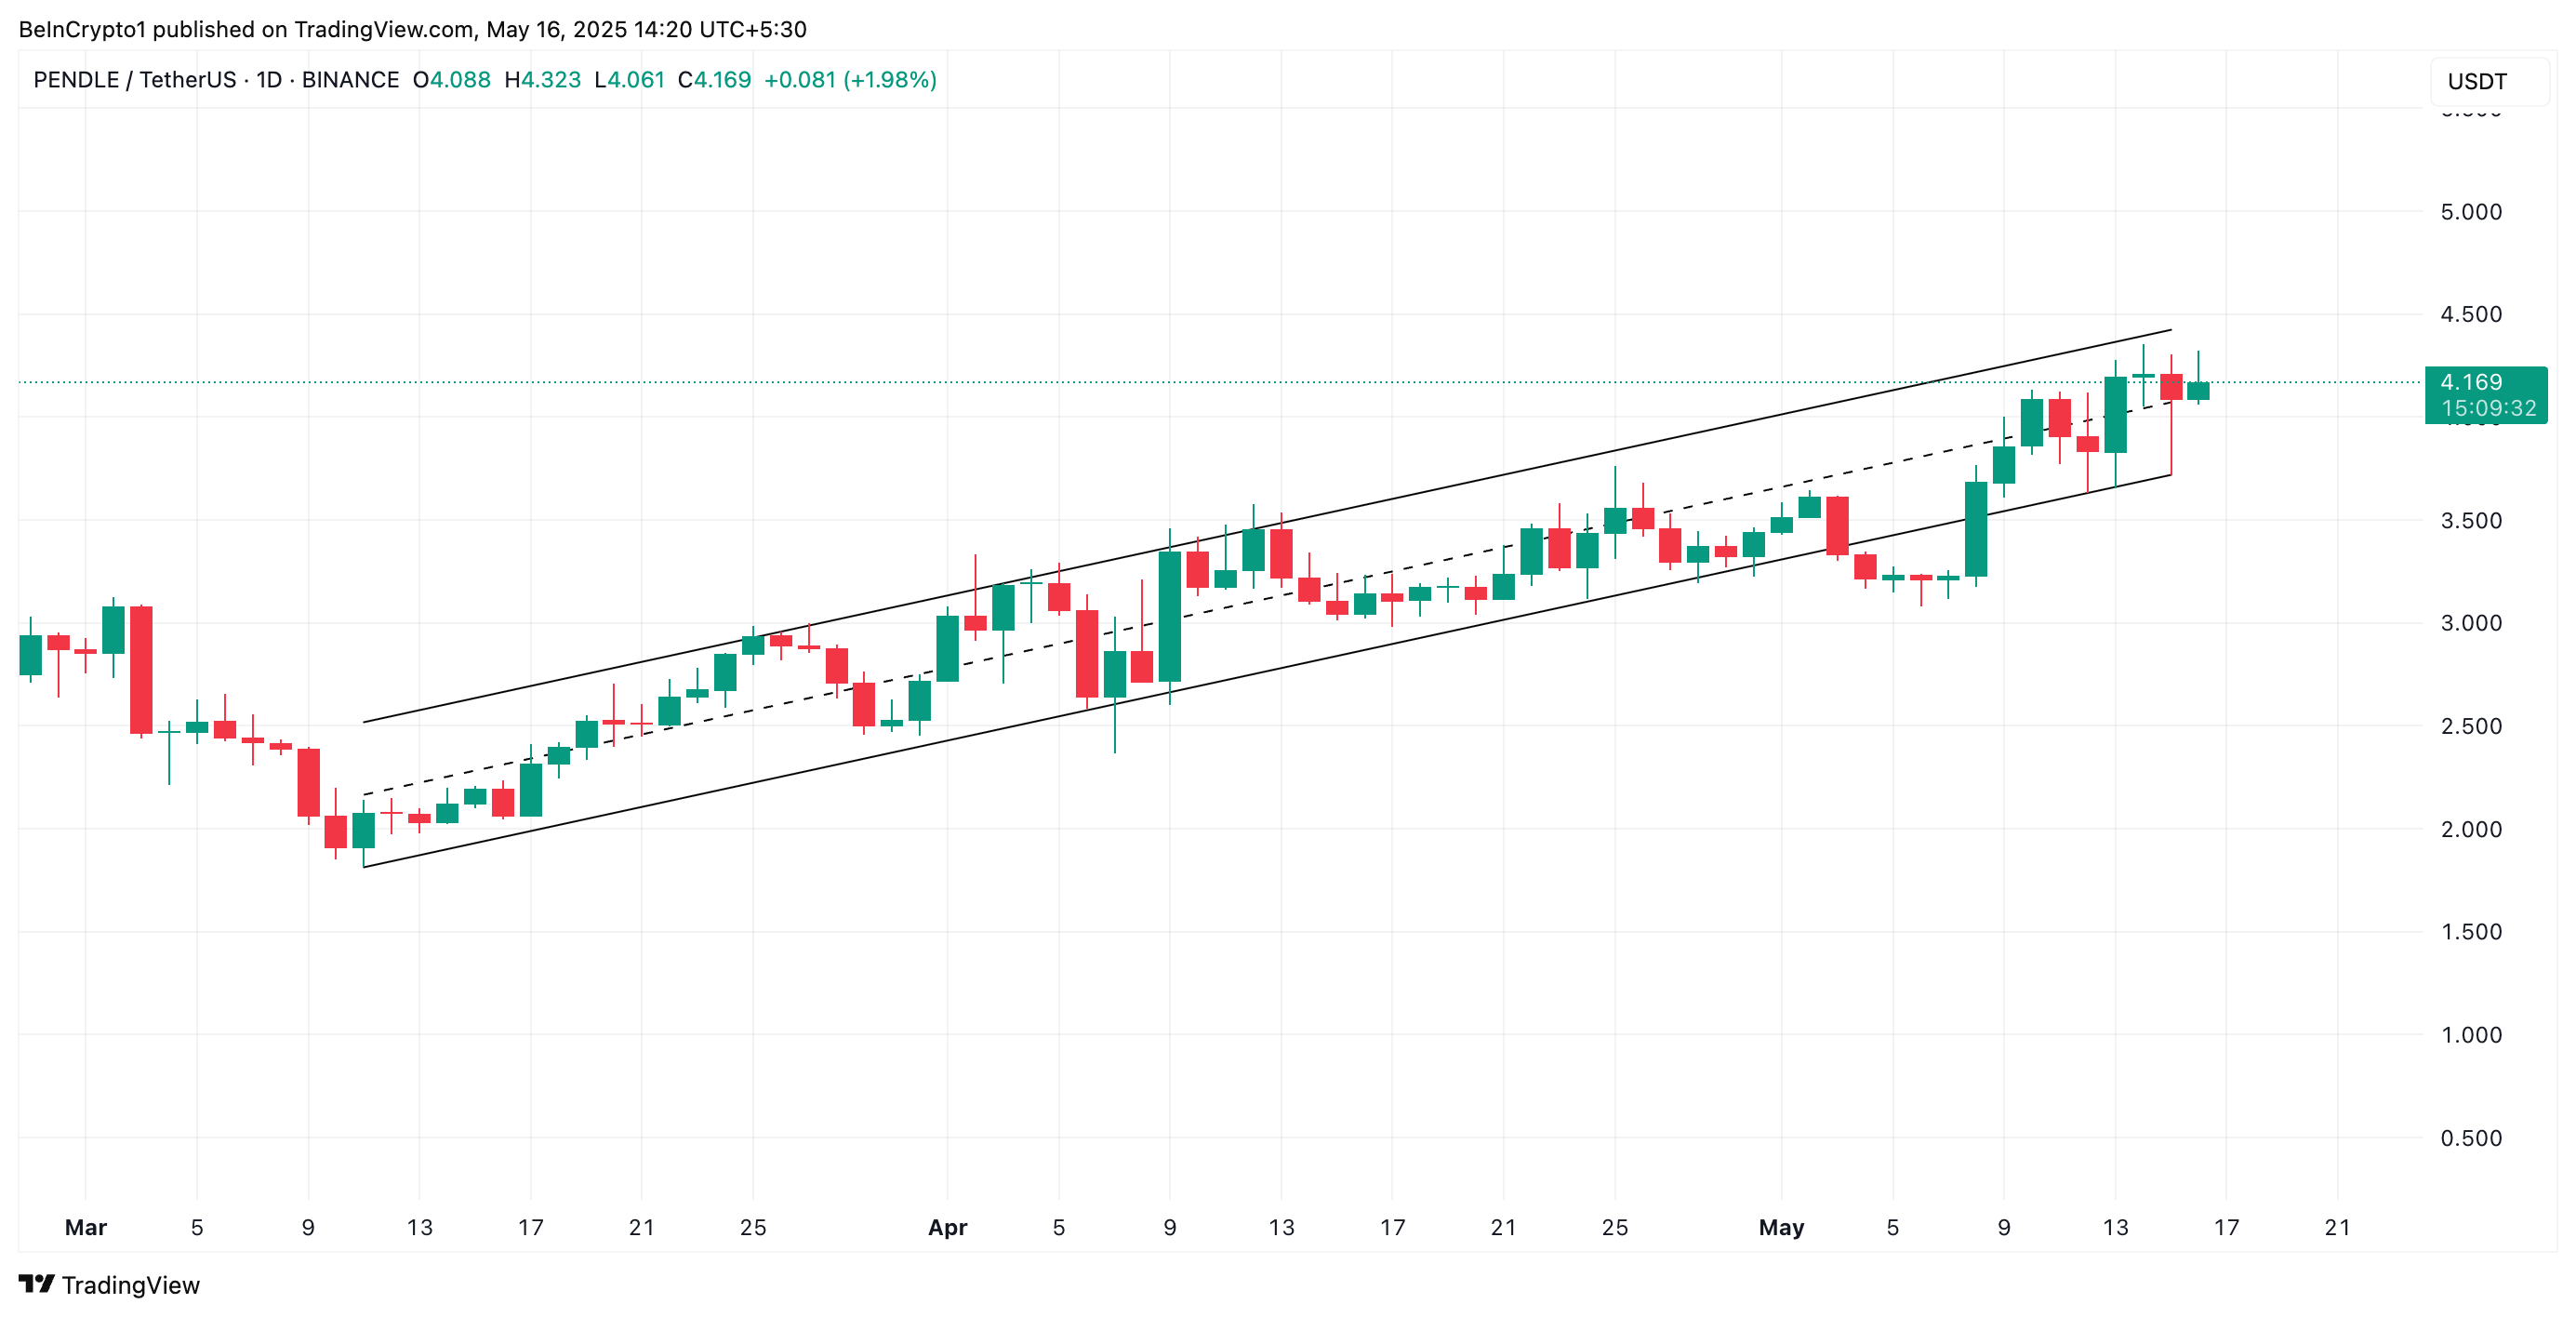
An ascending parallel channel is formed when an asset’s price moves between two upward-sloping, parallel trendlines, indicating consistently higher highs and higher lows. PENDLE’s rally within the channel suggests that its buyers continue to push the price upward while confidently maintaining control over pullbacks.
Moreover, the setup of the token’s Moving Average Convergence Divergence (MACD) supports this bullish outlook. PENDLE’s MACD line (blue) currently lies significantly above its signal line (orange).
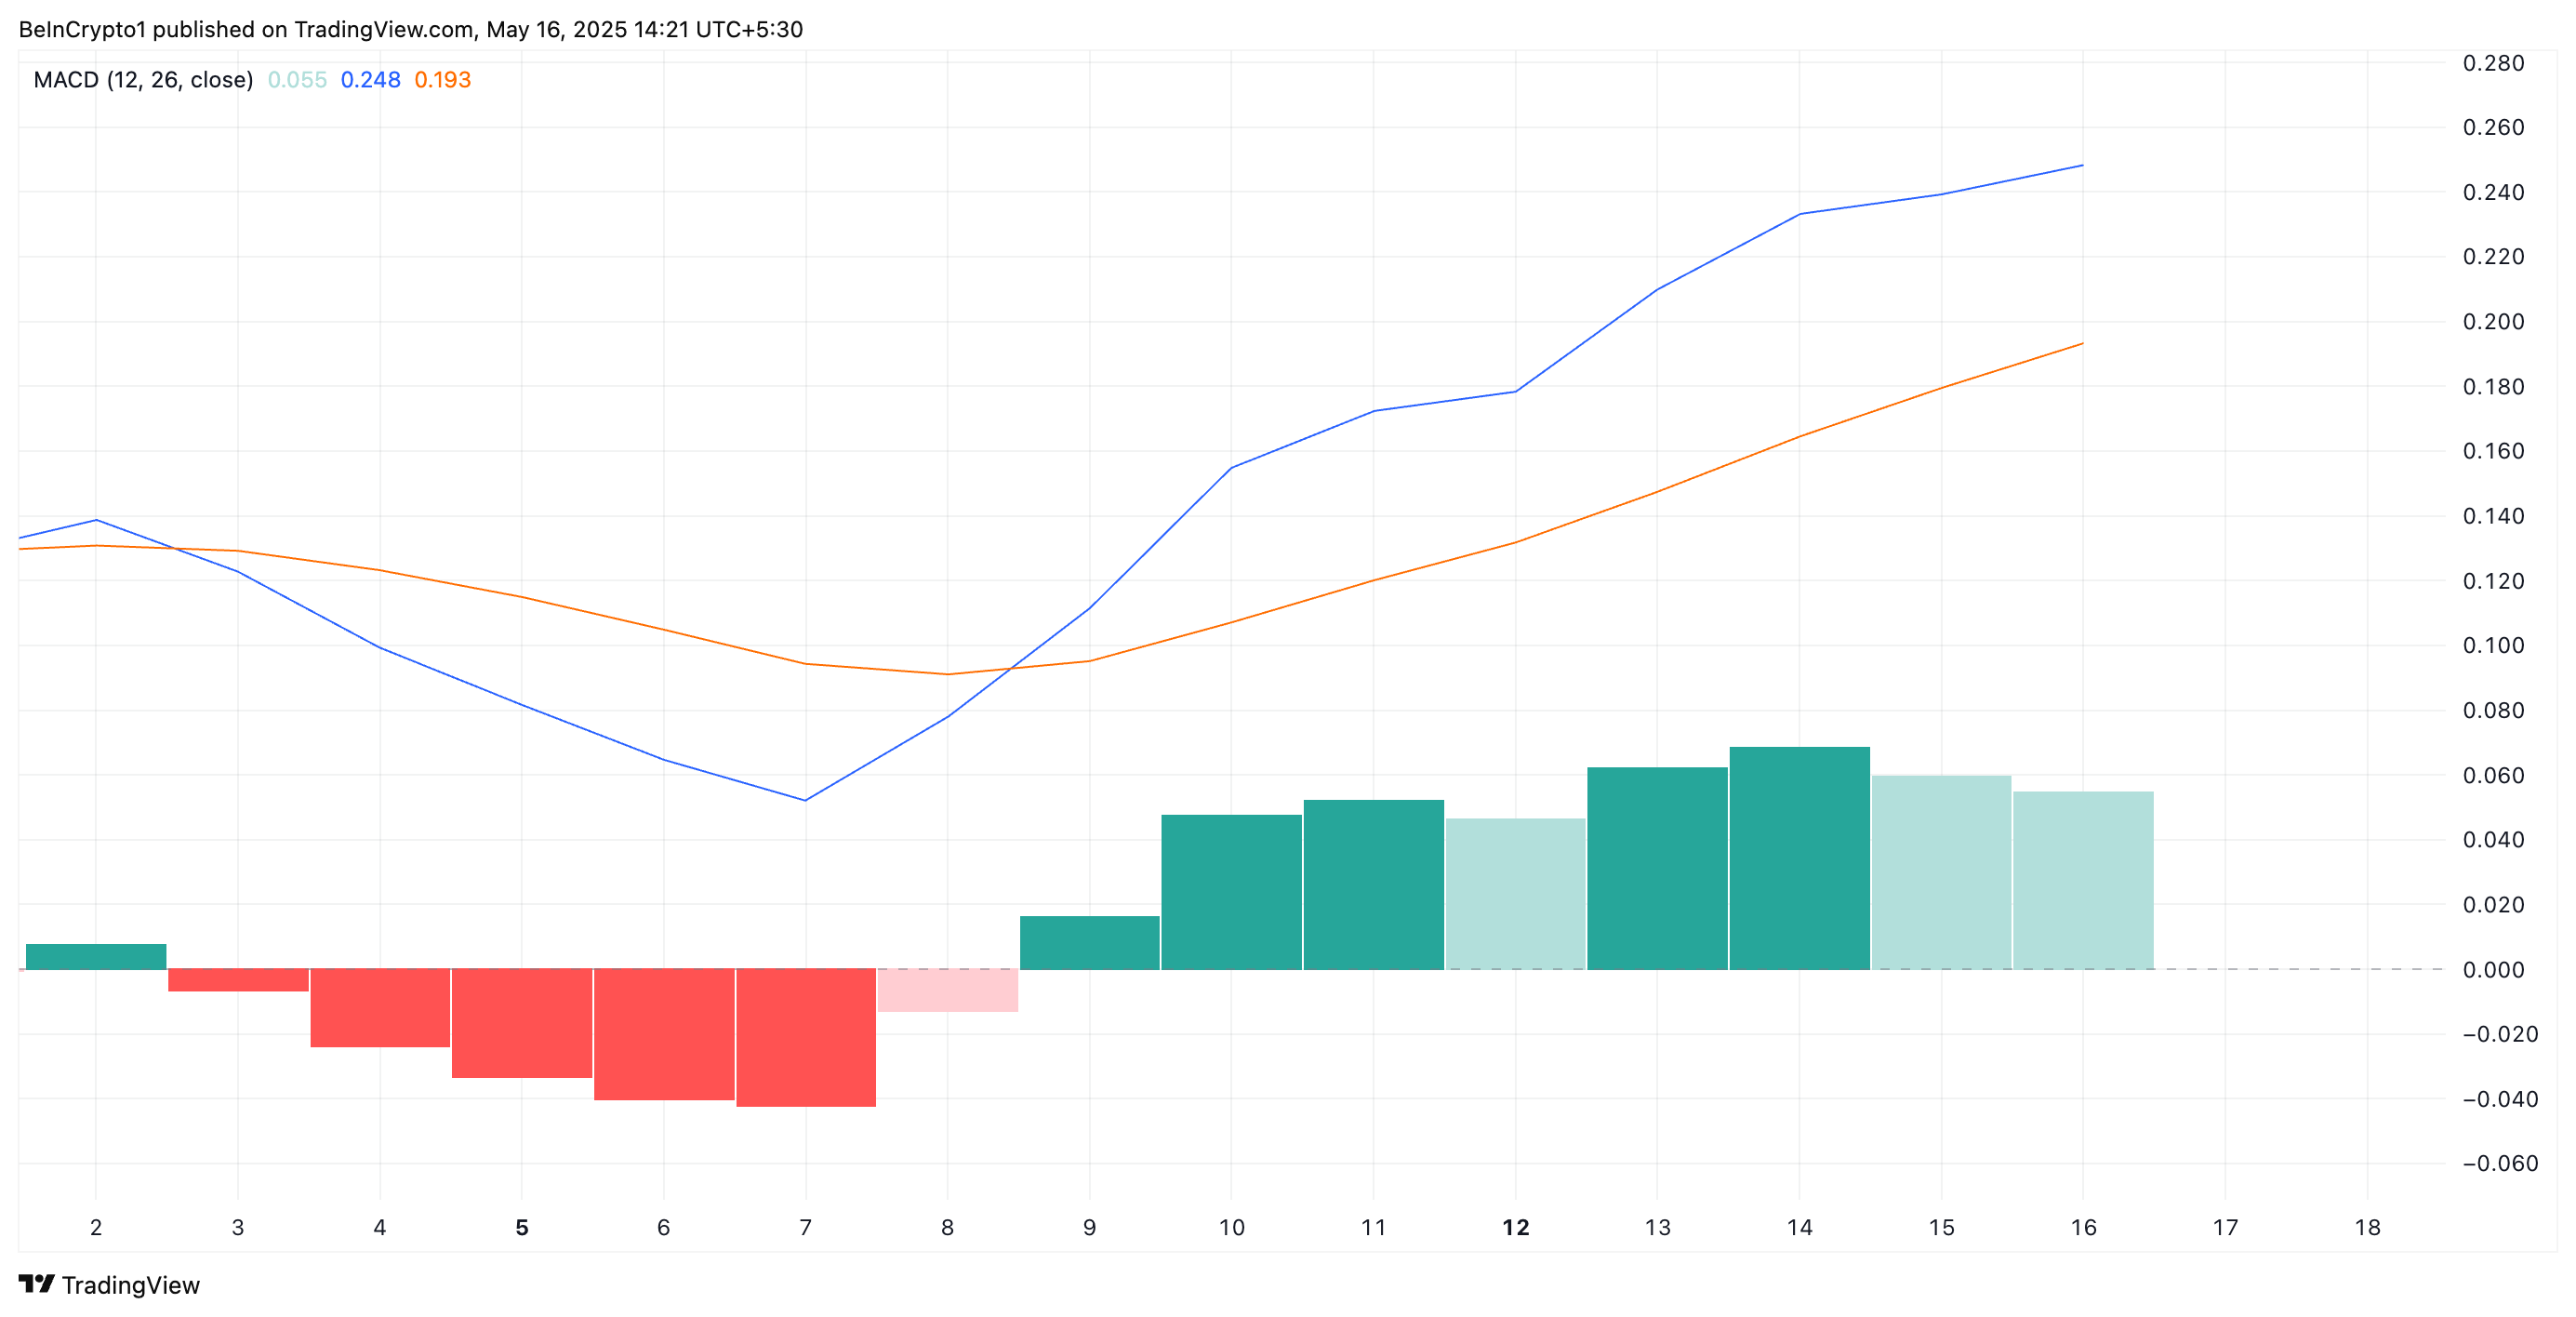
The MACD indicator identifies an asset’s price trends and changes in its momentum. Traders use it to spot potential buy or sell signals through crossovers between the MACD and signal lines.
As in PENDLE’s case, when the MACD line rests above the signal line, it is a bullish signal. It indicates that buying activity exceeds selloffs among traders and hints at a sustained price rally if bullish conditions persist.
Furthermore, PENDLE’s triple-digit rally has pushed it above the Leading Spans A and B of its Ichimoku Cloud, confirming the buying pressure in the market.
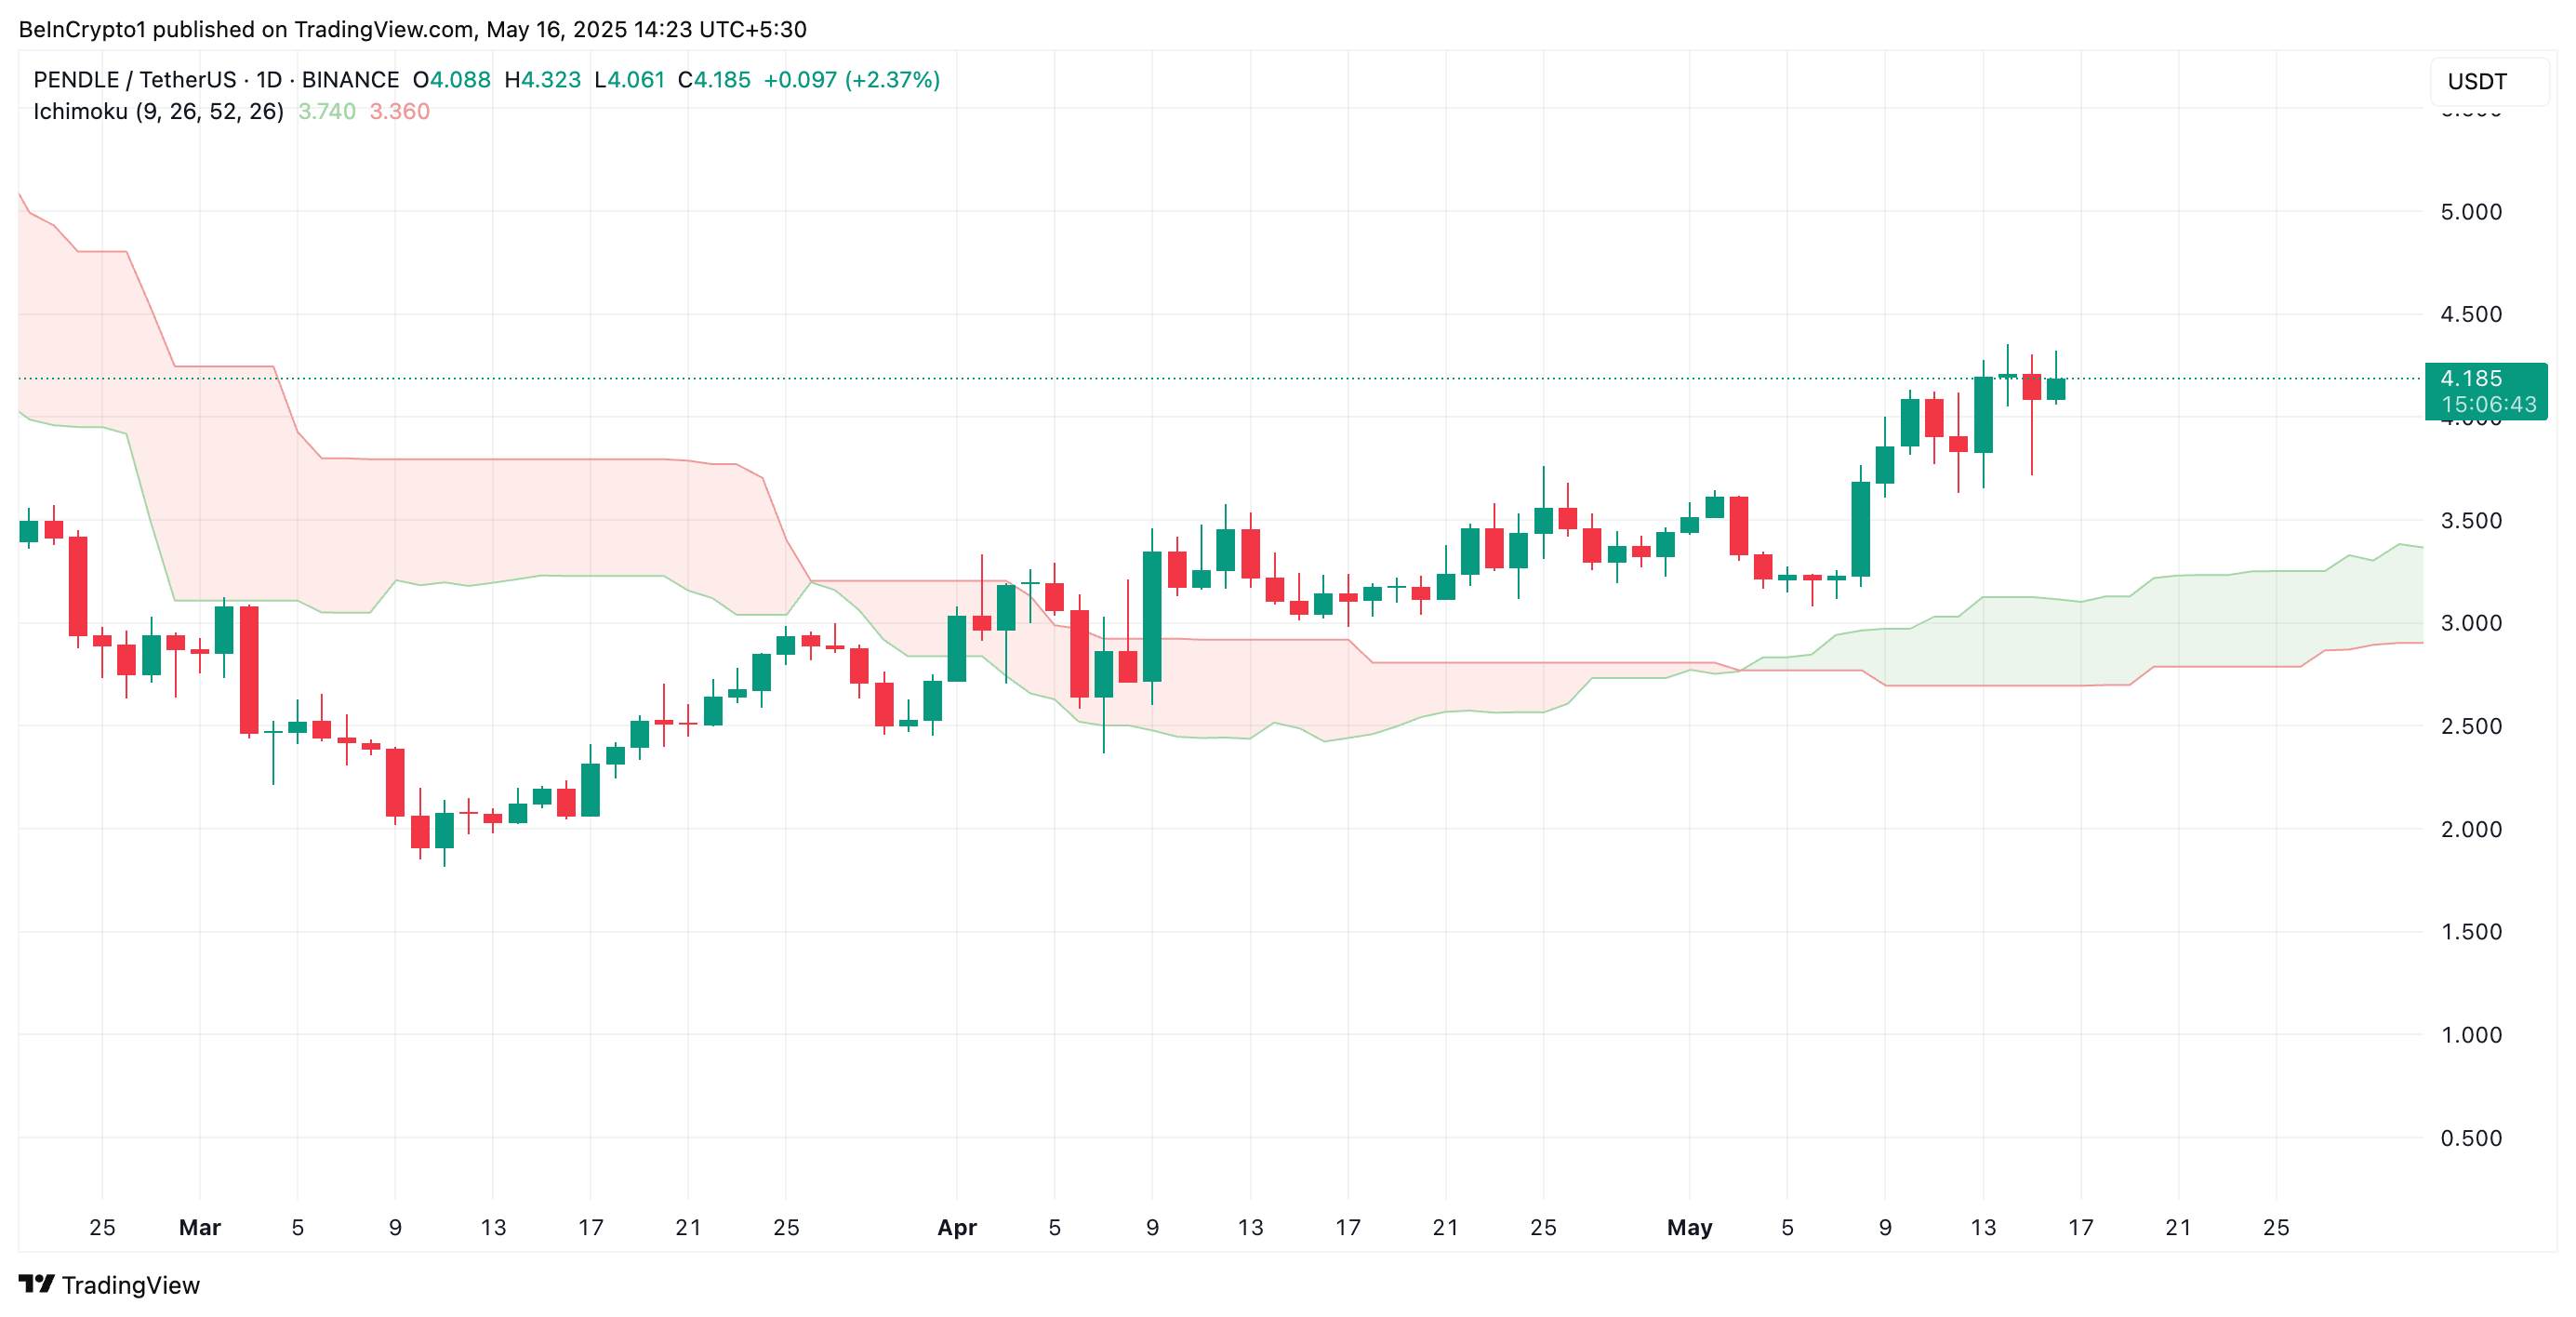
The Ichimoku Cloud tracks the momentum of an asset’s market trends and identifies potential support/resistance levels. When an asset trades below this cloud, it reflects a downtrend. In this scenario, the cloud acts as a dynamic resistance zone, reinforcing the likelihood of continued decline if the price remains below it.
On the other hand, breaking above the cloud suggests a strong bullish trend, which signals that buyers have gained control. This means PENDLE will likely continue its upward trajectory in the short term.
PENDLE Battles $4.48 Resistance — Will the Bulls Push Through?
PENDLE trades at $4.16 at press time, resting just below the key resistance at $4.48—the barrier standing between it and the $5 price region. If buying pressure strengthens and PENDLE flips this resistance into a support floor, it could propel the token toward $5.10, a high last seen on January 6.
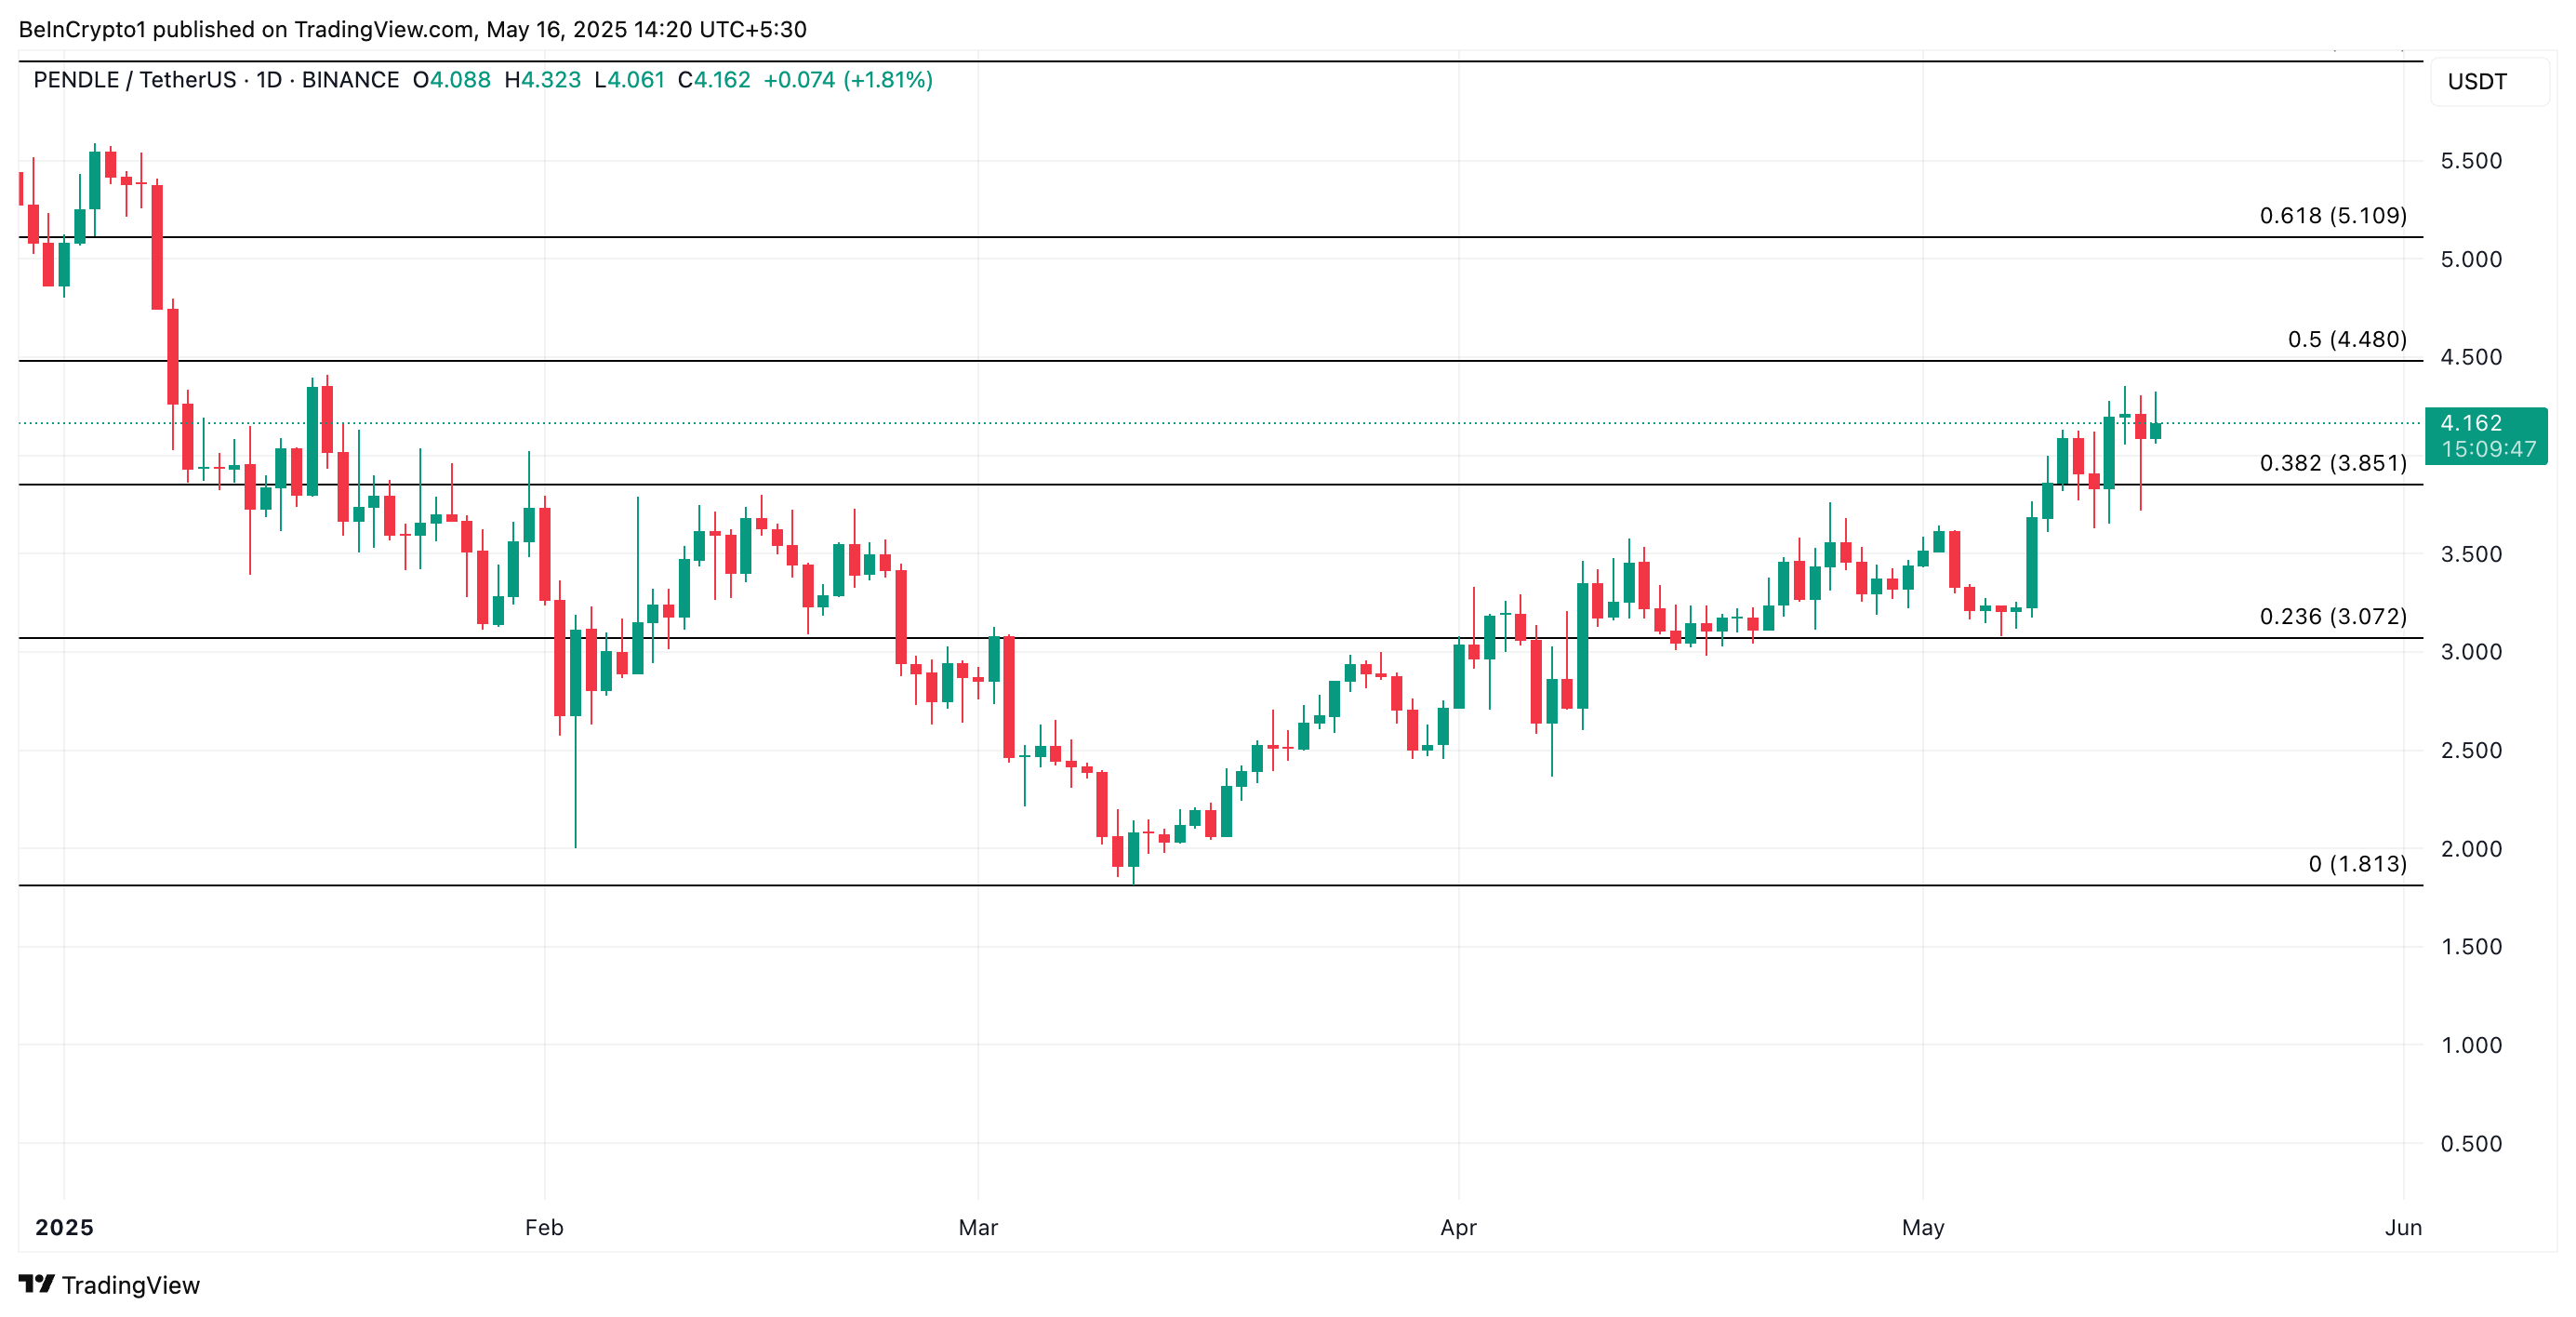
However, if profit-taking sets in, this bullish projection would be invalidated. In that case, the token’s price could fall to $3.85. Should the bulls fail to defend this level, the PENDLE token may extend its decline further to $3.07.
