

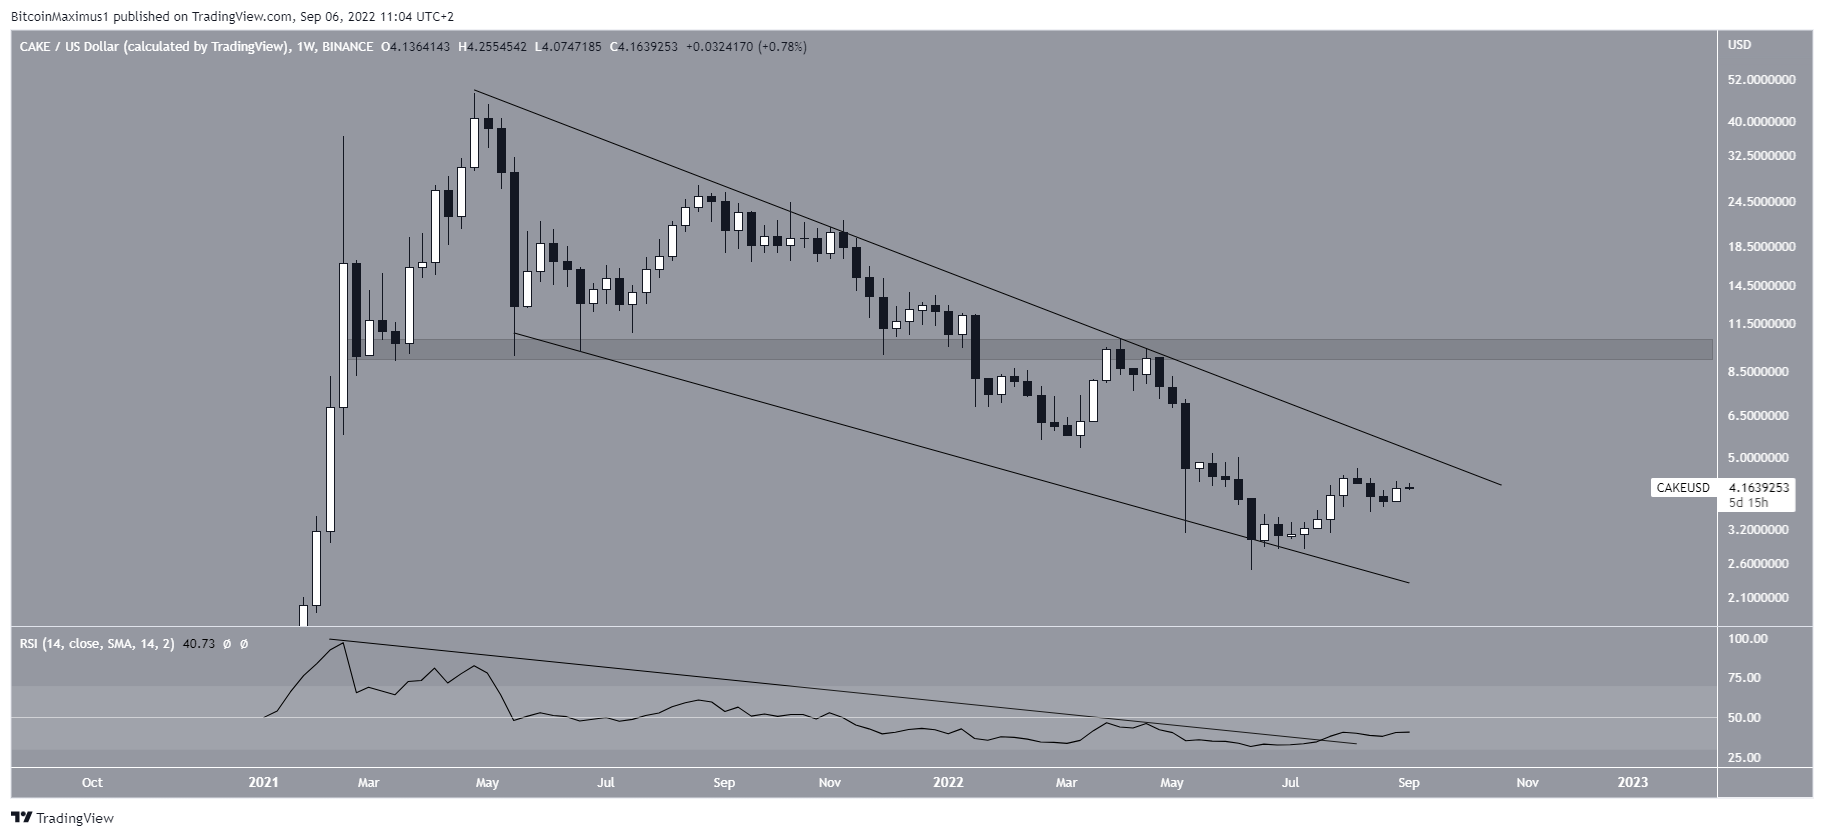
PancakeSwap (CAKE) is trading inside a long-term bullish pattern, but it has yet to confirm that it will break out from it.
CAKE has been falling underneath a descending wedge since reaching an all-time high price of $47.21 in April 2021. The downward movement has so far led to a low of $2.48 in June.
The price bounced afterward, in turn validating the support line of the wedge. Moreover, the upward movement caused a breakout from the descending resistance line of the weekly RSI (black line). This is considered a sign of a bullish trend, which would be confirmed with an increase above 50.
The increase comes after a significant burn, in which more than four million coins were burnt.
Additionally, the descending wedge is considered a bullish pattern, further increasing the possibility of a breakout. If one occurs, the closest resistance area would be at $10.
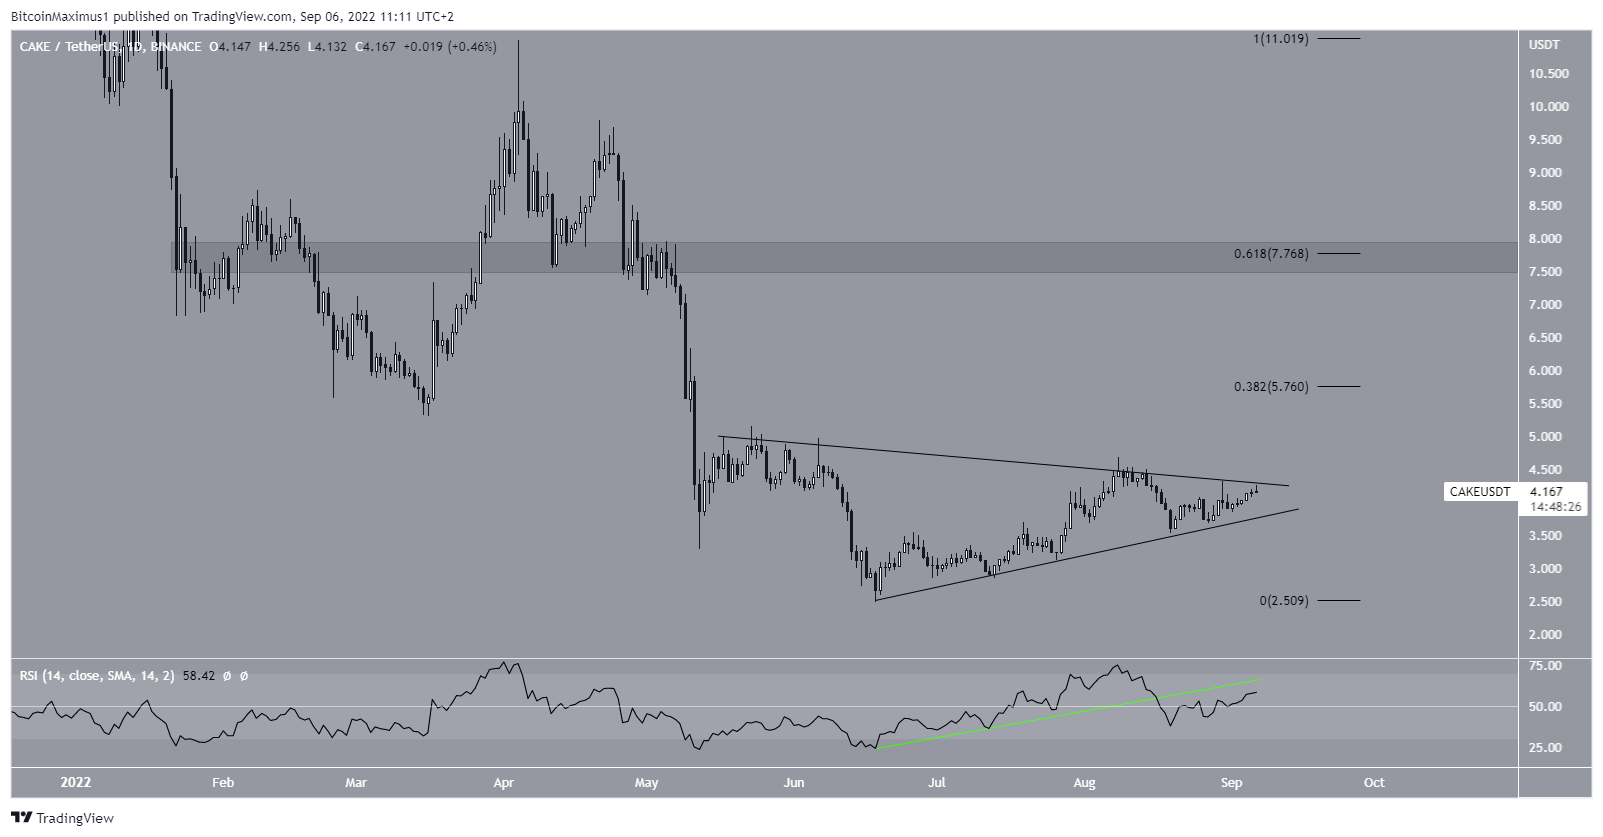
Potential breakout
The daily chart shows that CAKE has been increasing inside a symmetrical triangle since its June lows. The symmetrical triangle is considered a neutral pattern, meaning that both a breakdown and a breakout could occur.
Additionally, the daily RSI provides a neutral outlook. The indicator has broken down from an ascending support line (green) but then reclaimed the 50 line. So, readings from the RSI are mixed.
Whether the price breaks out or down from the triangle will likely determine the direction of the future trend. A breakout from the triangle would take CAKE to the closest resistance area at $5.75. This would also coincide with the resistance line from the previous long-term wedge. If successful in moving above it, there would be crucial resistance at $7.75.
Conversely, a breakdown from the triangle would take the price towards new lows.
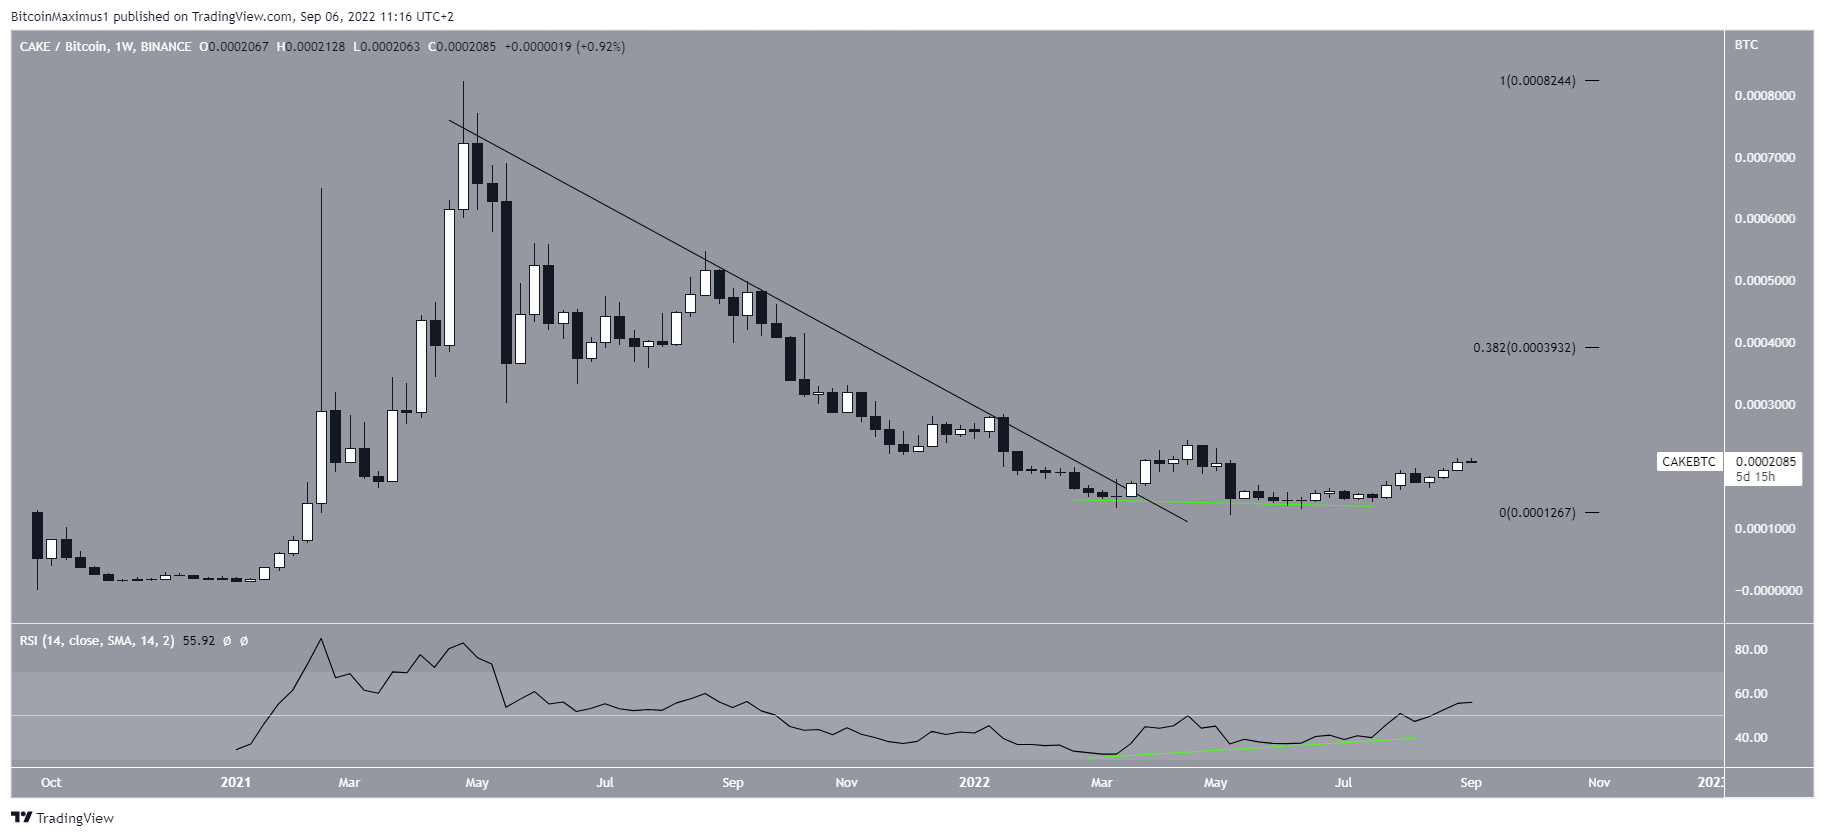
CAKE/BTC
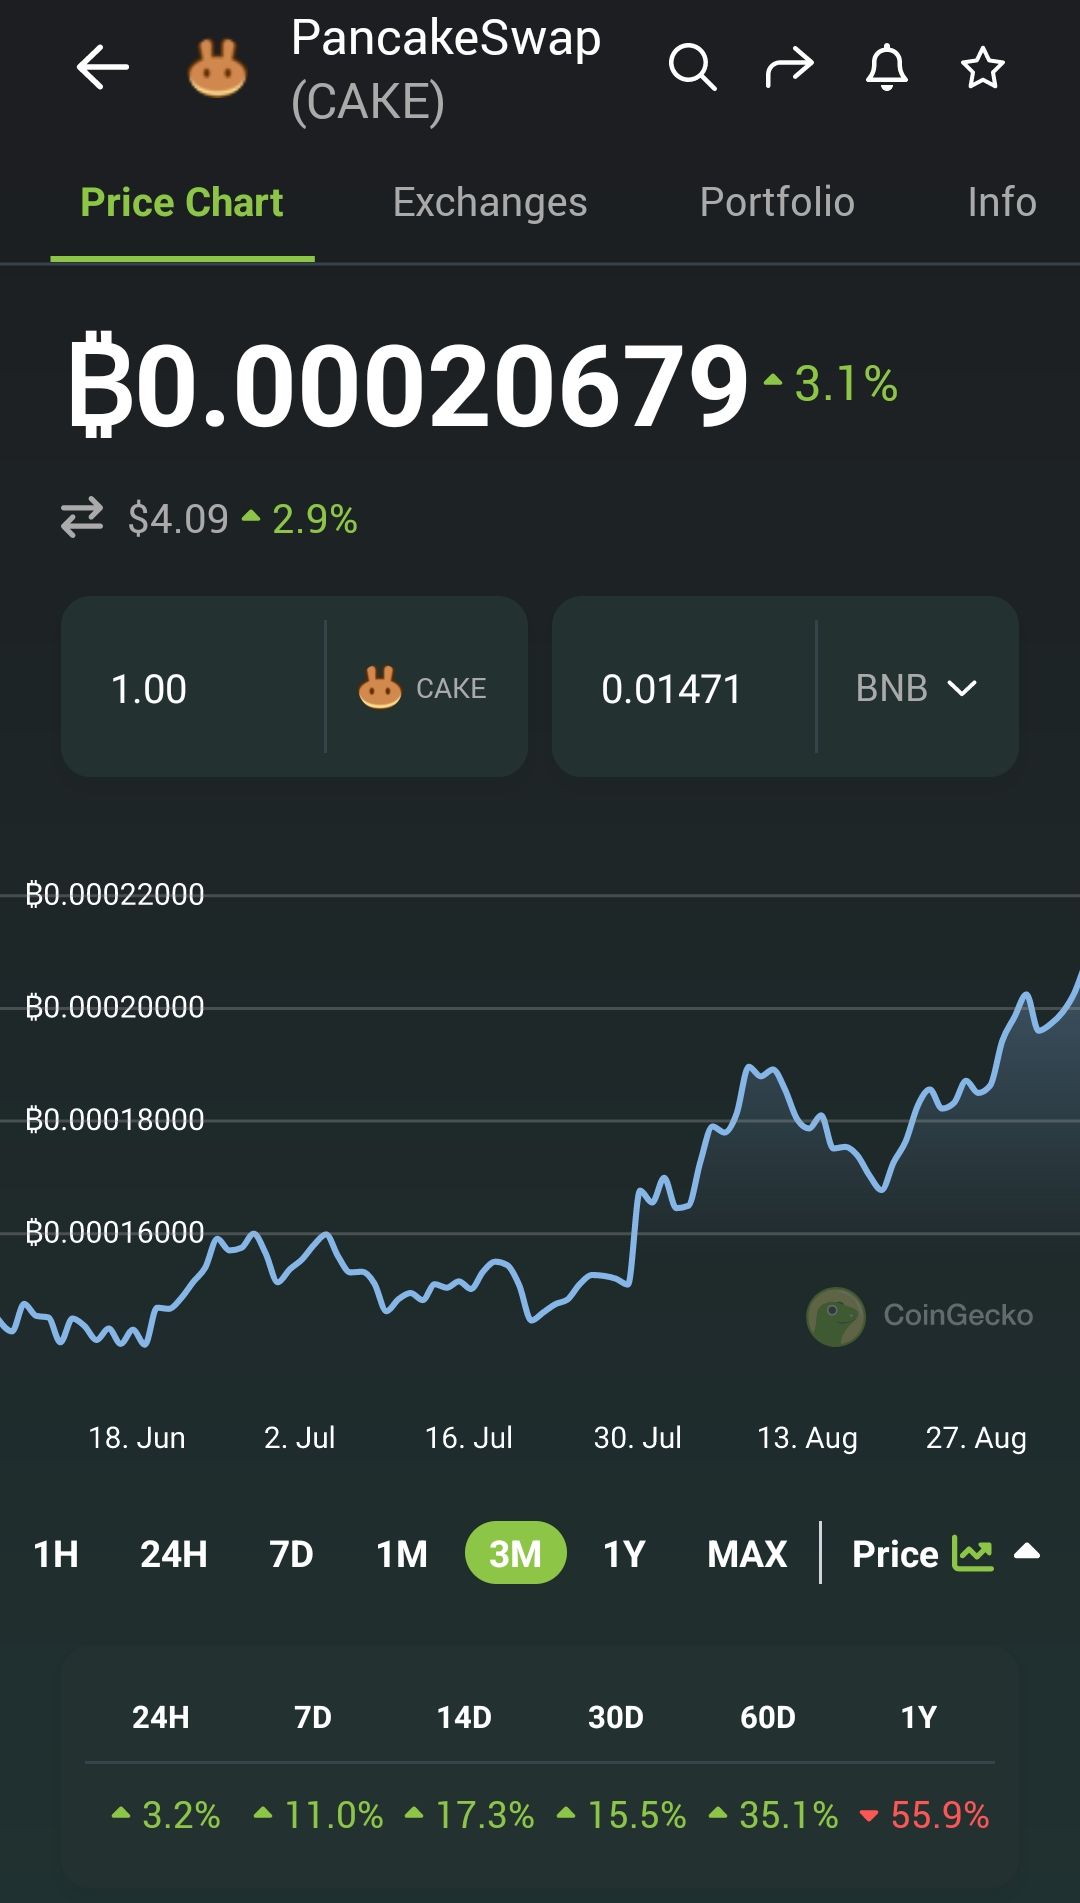
Decentralized finance (DeFi) analyst @Overdose_AI tweeted a chart of CAKE, showing that the price has outperformed Bitcoin (BTC) over the past two weeks.
The CAKE/BTC chart is significantly more bullish than its USD counterpart. The main reason for this is the bullish divergence in the weekly RSI (green line) and the breakout from a long-term descending resistance line. Both of these events are often succeeded by sharp upward movement.
If the upward movement continues, the closest resistance area would be at 39,300 satoshis. This is the 0.382 Fib retracement resistance level when measuring the entire downward movement.
For Be[in]Crypto’s latest Bitcoin (BTC) analysis, click here
Disclaimer
In line with the Trust Project guidelines, this price analysis article is for informational purposes only and should not be considered financial or investment advice. BeInCrypto is committed to accurate, unbiased reporting, but market conditions are subject to change without notice. Always conduct your own research and consult with a professional before making any financial decisions. Please note that our Terms and Conditions, Privacy Policy, and Disclaimers have been updated.
