PancakeSwap (CAKE) has bounced since reaching a new all-time low price on Jan 22, but has yet to confirm the possibility of a bullish trend reversal.
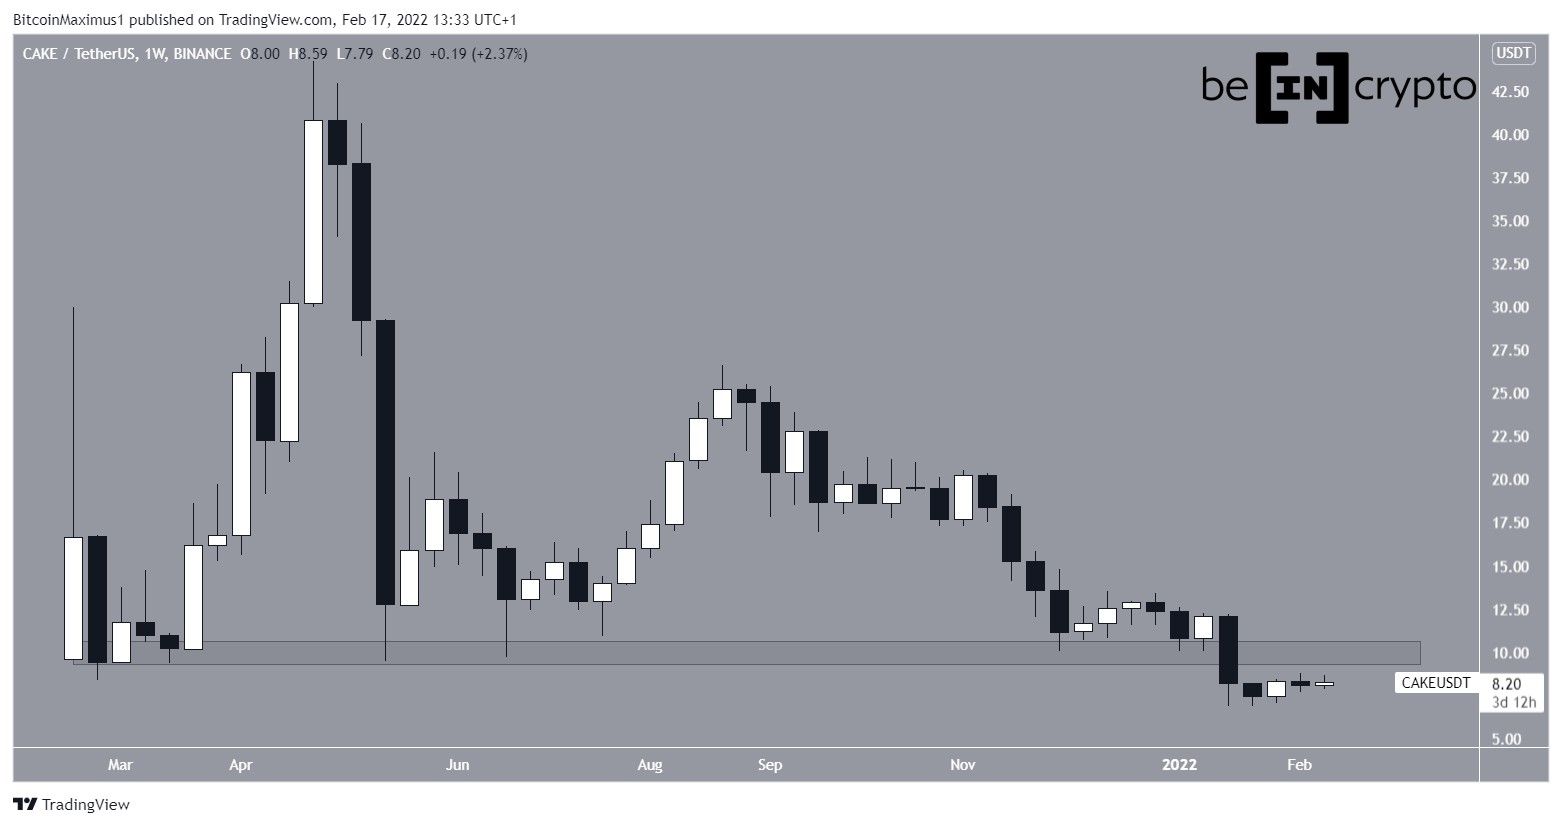
CAKE has been falling since reaching an all-time high price of $44.28 on April 30. On June, the price bounced at the $10 horizontal support area and initiated a bounce, which however was short-lived.
During the week of Jan 17-24, 2021, the price broke down from the $10 horizontal level. This was a notable event since it caused a drop to a new all-time low.
While the price has bounced since, it is still trading below this level. Until the level is reclaimed, the trend cannot be considered bullish.
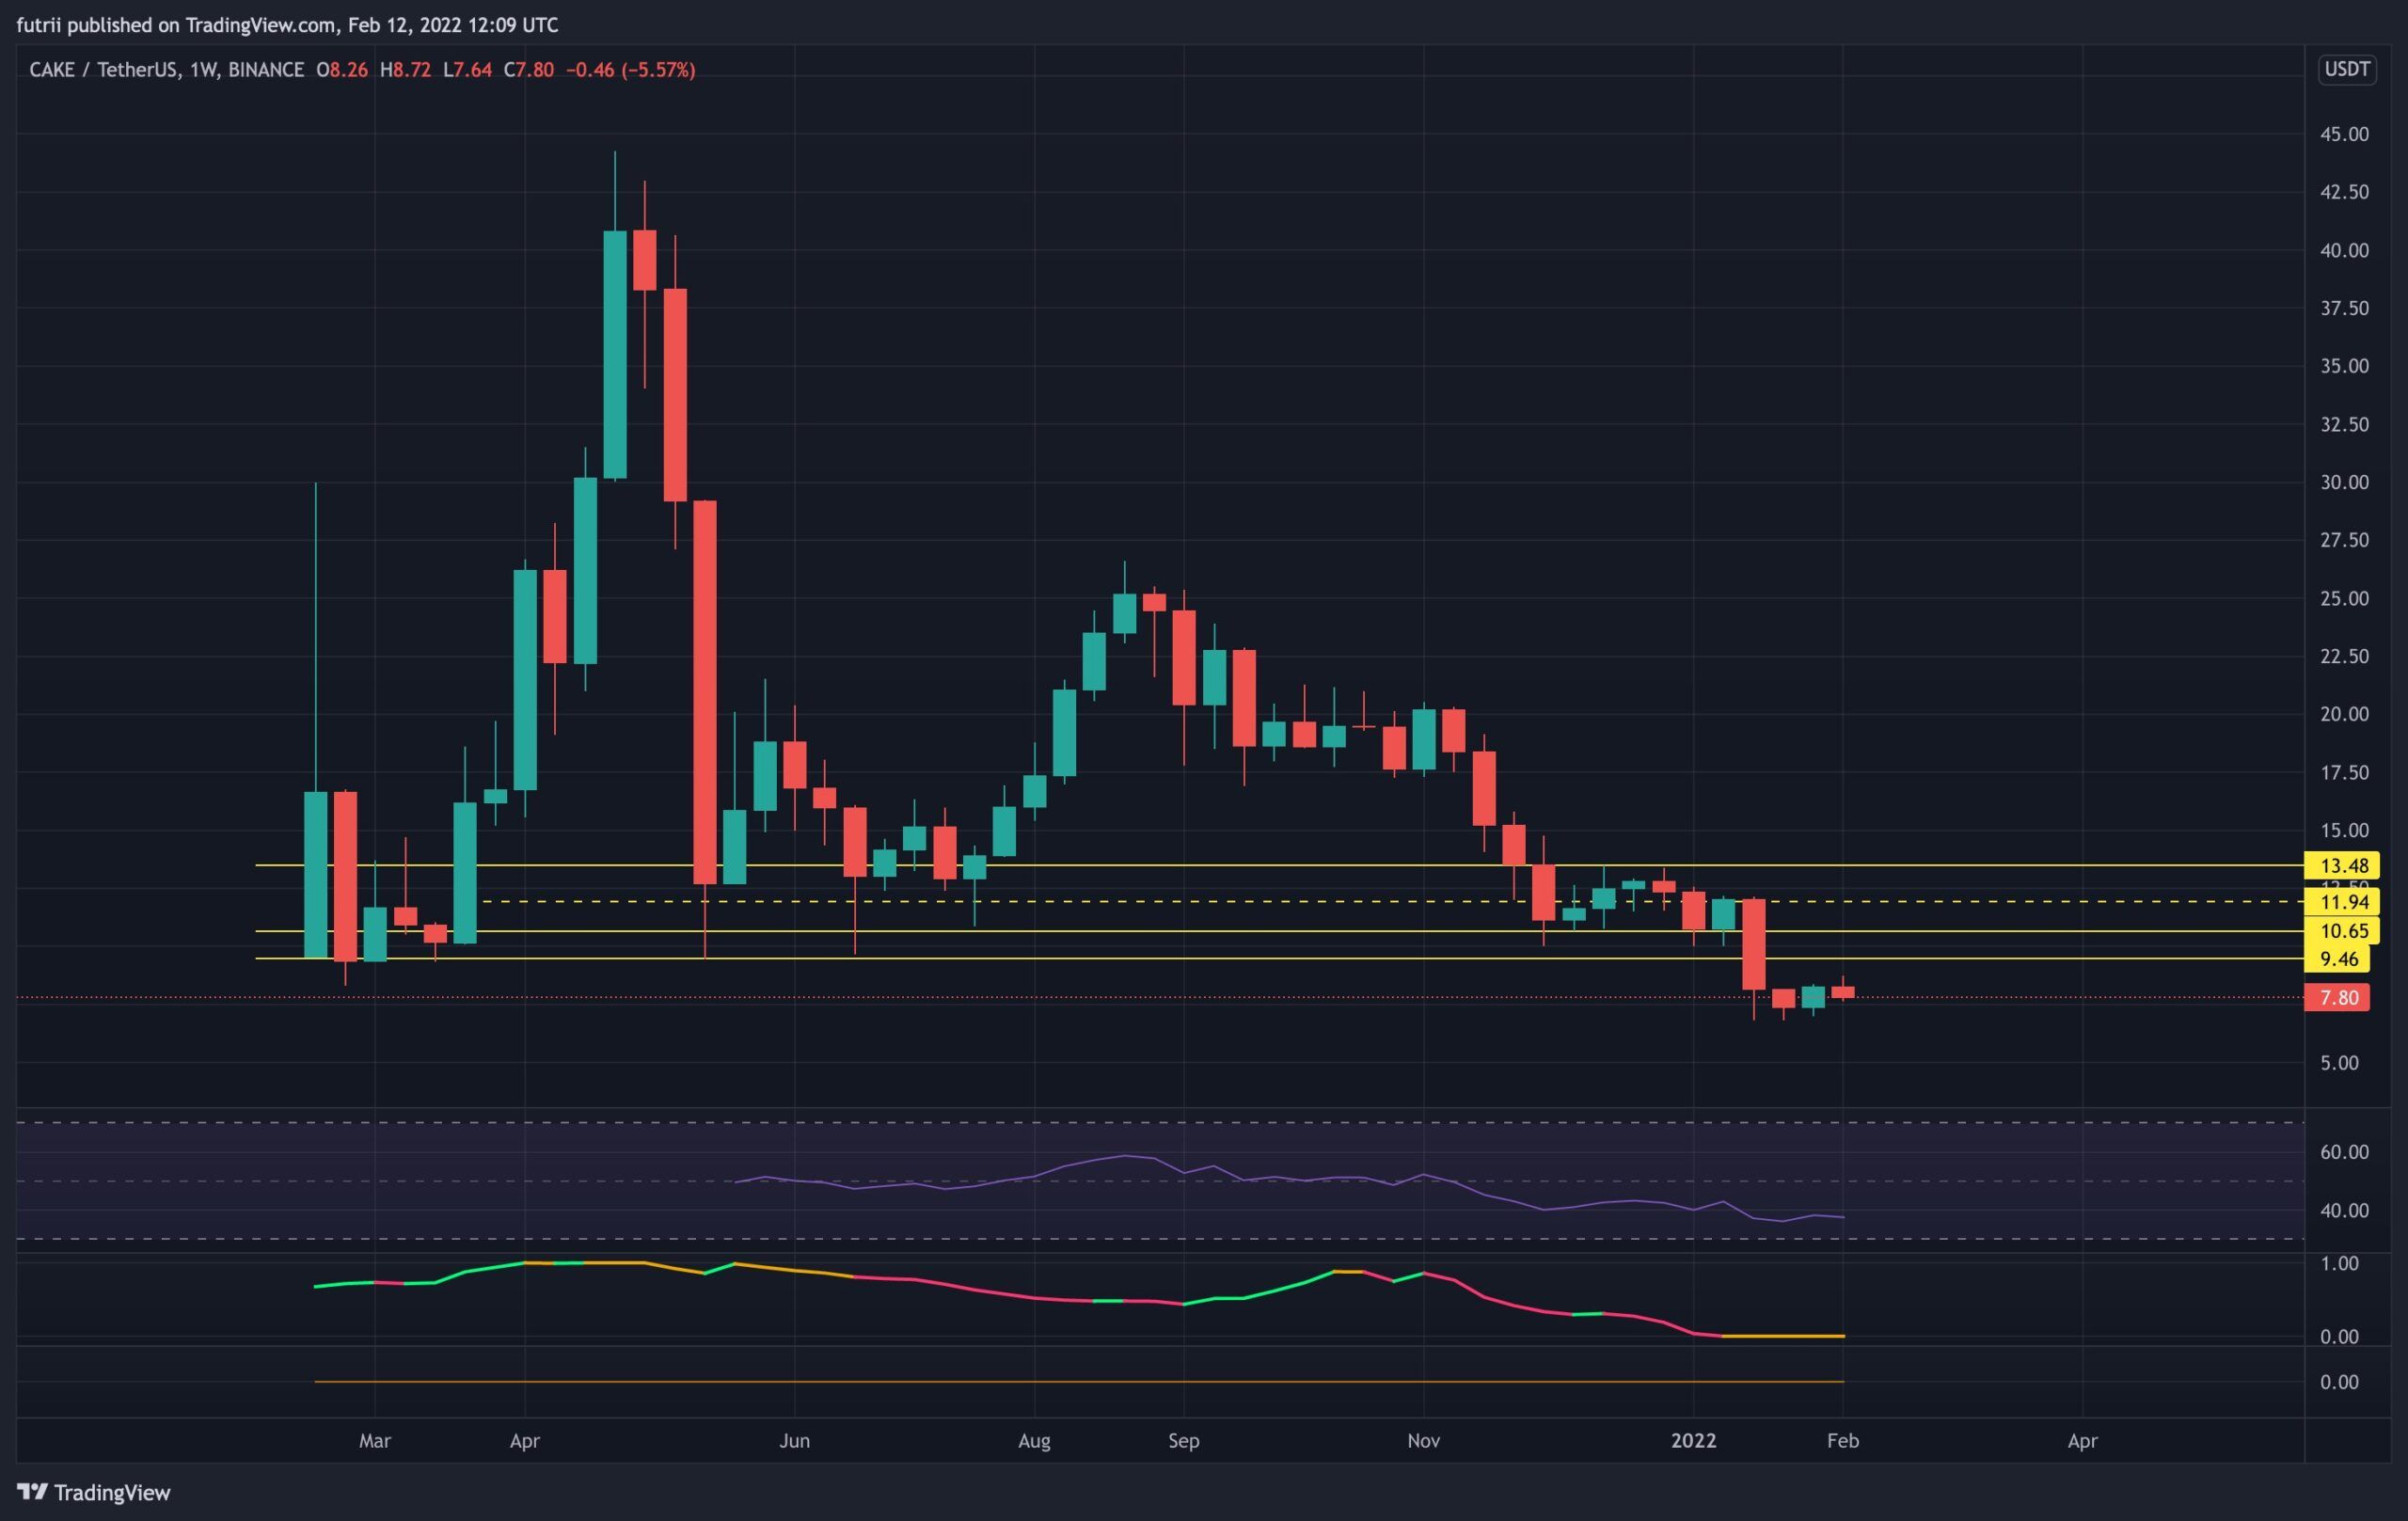
Cryptocurrency trader @Futrii tweeted a chart of CAKE, which shows that the price has fallen below several important horizontal levels in the way to a new all-time low.
Current CAKE pattern
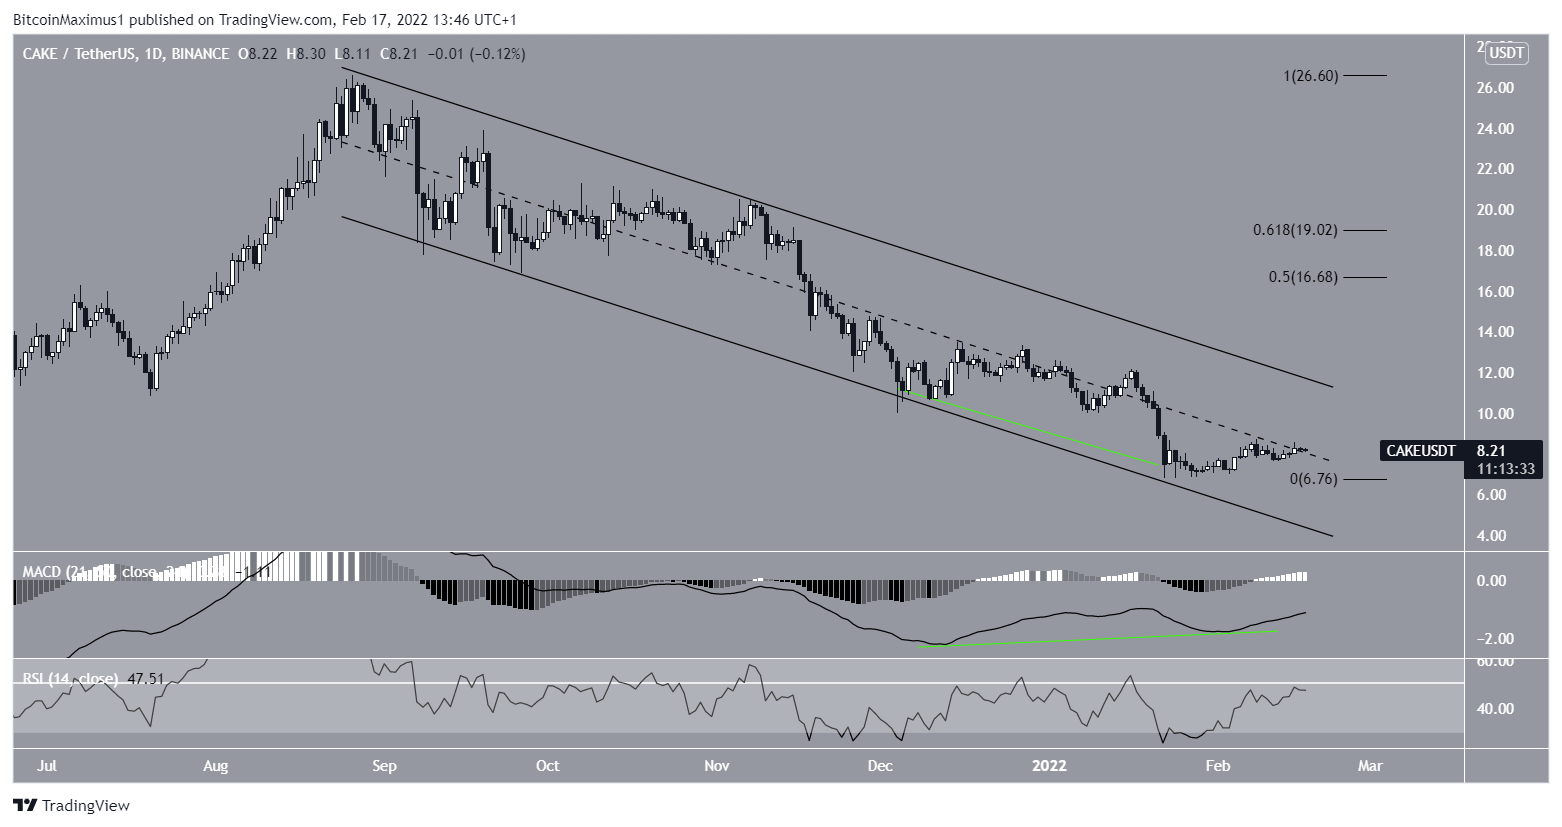
The daily chart shows that CAKE has been decreasing inside a descending parallel channel since Aug 26. Such channels usually contain corrective movements. Therefore, a breakout from it would be the most likely scenario. Nevertheless, CAKE is still in the lower portion of the channel, suggesting that the potential upward movement has not yet begun.
In addition to this, there is a very significant bullish divergence that has developed in the MACD (green line). Such divergences very often precede significant upward movements.
However, the RSI, which is a momentum indicator, is still below 50. In order for the bullish trend to be confirmed, the RSI has to move above this level.
If a breakout from this channel occurs, the closest resistance area would be between $16.70 and $19. This area is created by the 0.5 – 0.618 Fib retracement resistance levels.
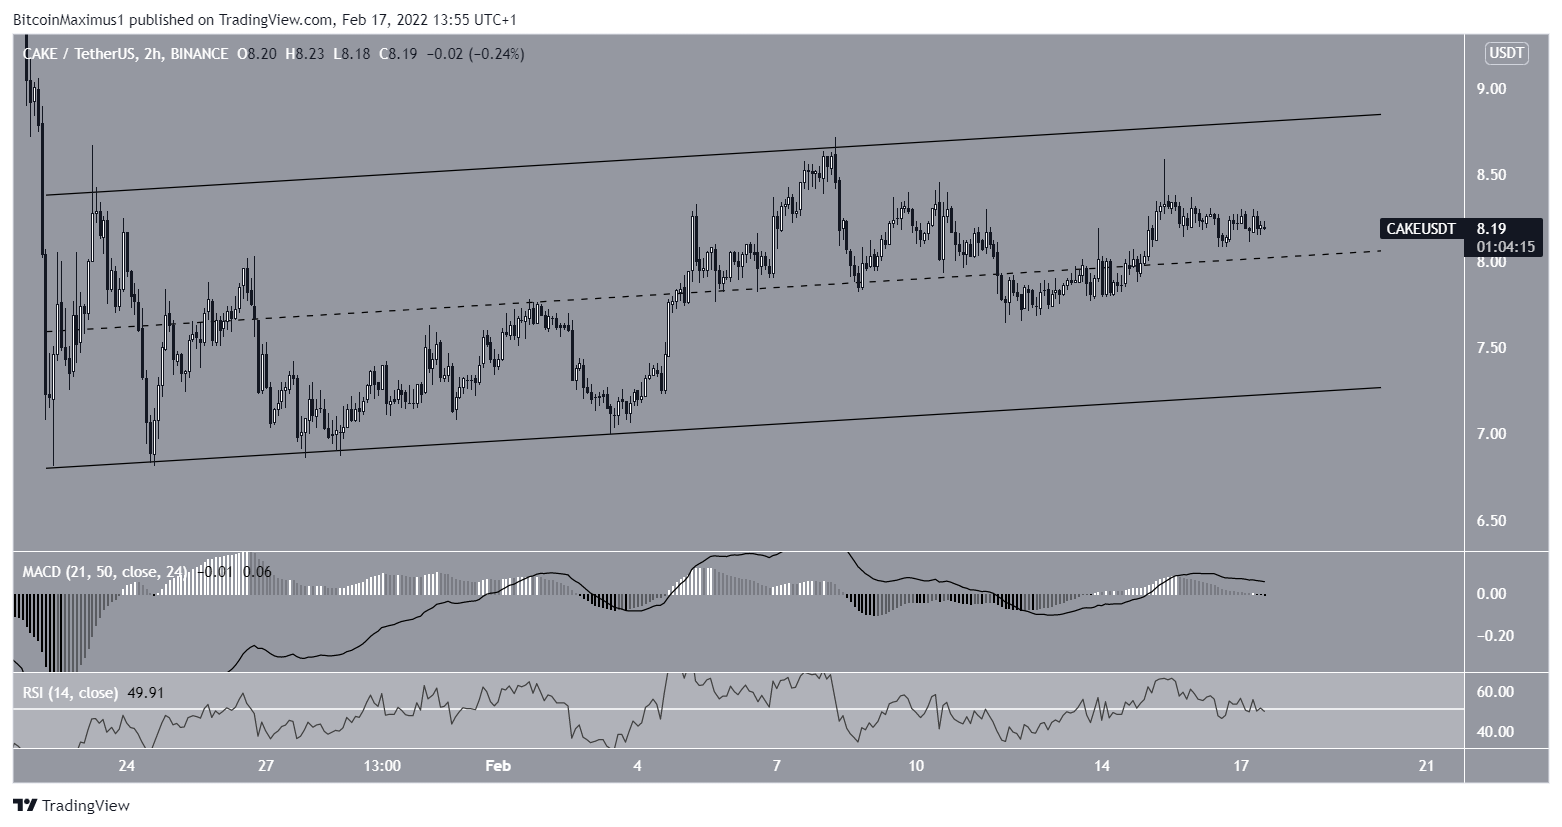
Short-term movement
The two-hour chart for CAKE shows no discernible patter besides an ascending parallel channel, whose resistance line has not been validated sufficient times.
Furthermore, technical indicators provide neutral readings, since the RSI is at 50 and the MACD is close to 0.
The resistance line of this channel coincides with the middle of the long-term channel and is close to the $10 horizontal level. This supports the outlook from the longer-term time-frames, which suggests the trend cannot be considered bullish until CAKE reclaims these levels.