


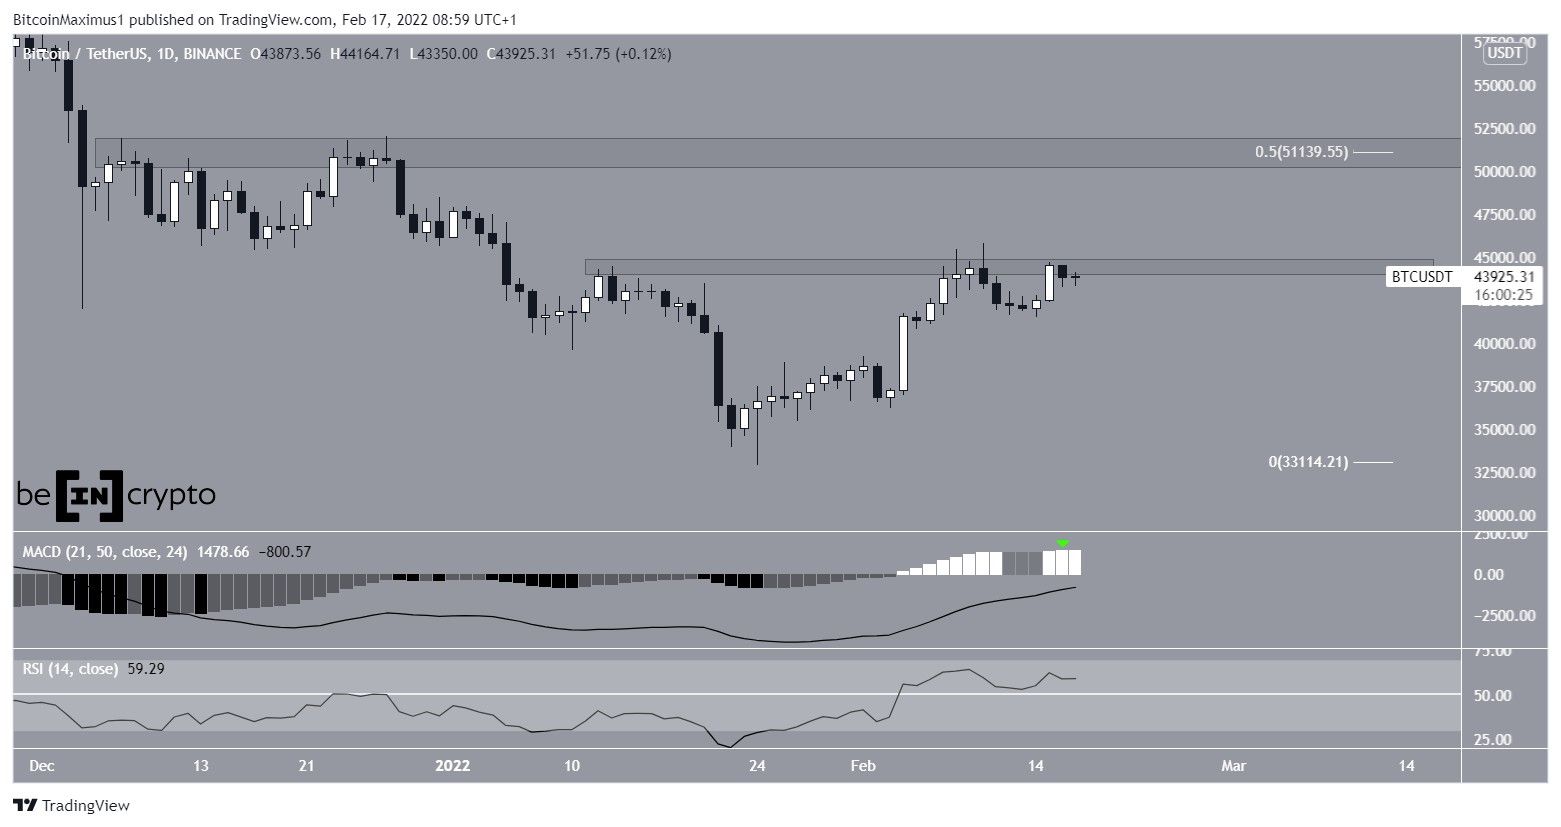
Bitcoin (BTC) is in the process of potentially making yet another attempt at breaking out above the $44,300 resistance area.
On Feb 16, BTC reached a close of $44,583, just above the $44,300 horizontal resistance area, before decreasing slightly the next day. Despite the drop, technical indicators are still bullish, since both the RSI and MACD are increasing. The MACD has created higher successive bars while the RSI is above 50. Both of these are signs of a bullish trend.
If a breakout transpires, the next closest resistance area would be found at $51,140
Breakout attempt
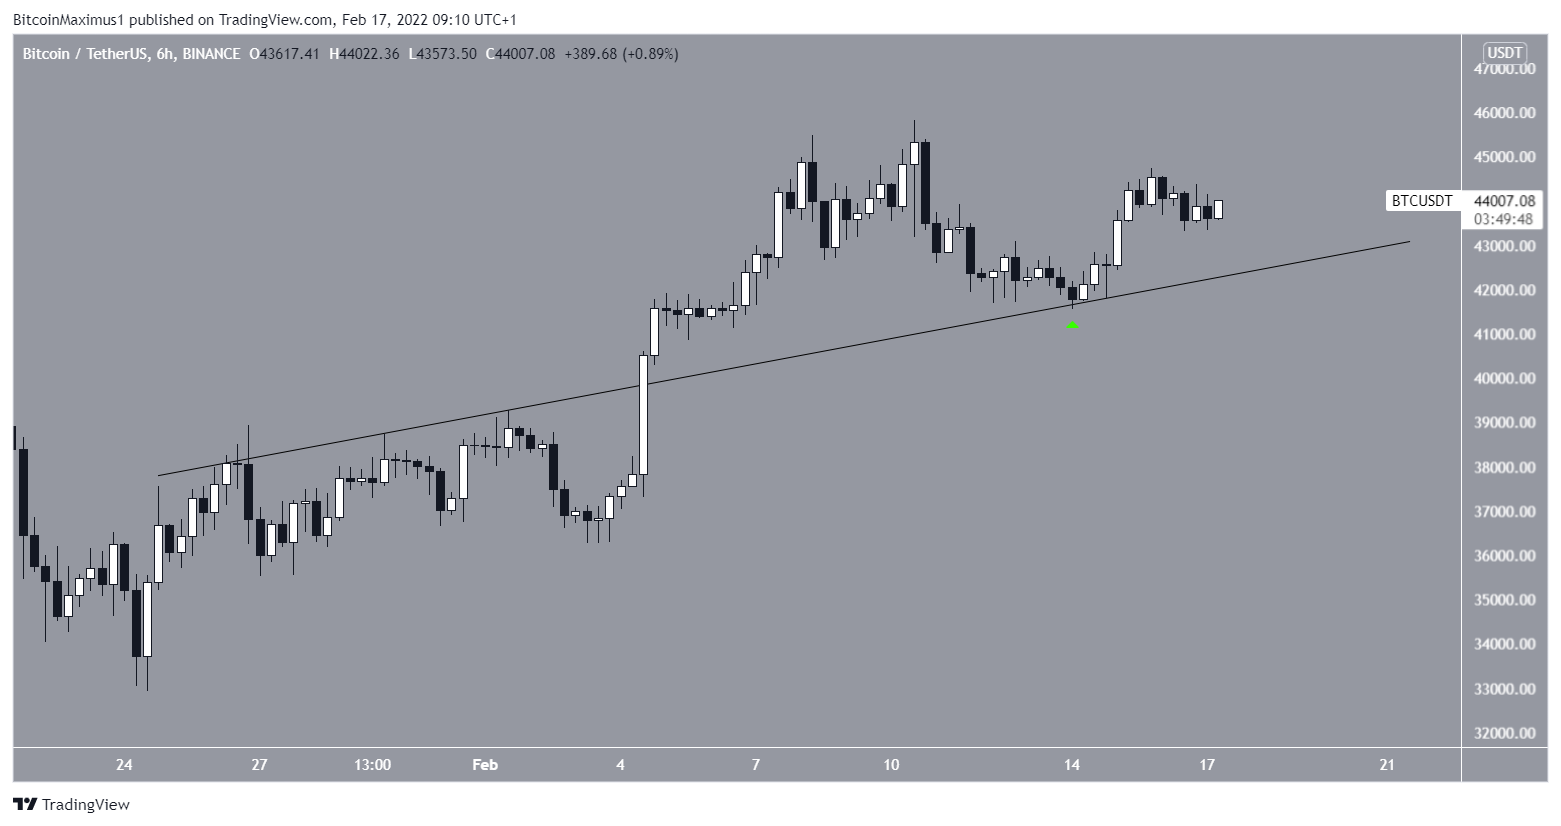
The six-hour chart shows that BTC broke out from an ascending resistance line on Feb 4. Following this, it returned to validate the line as support on Feb 14 (green icon) and the price has been mostly increasing since.
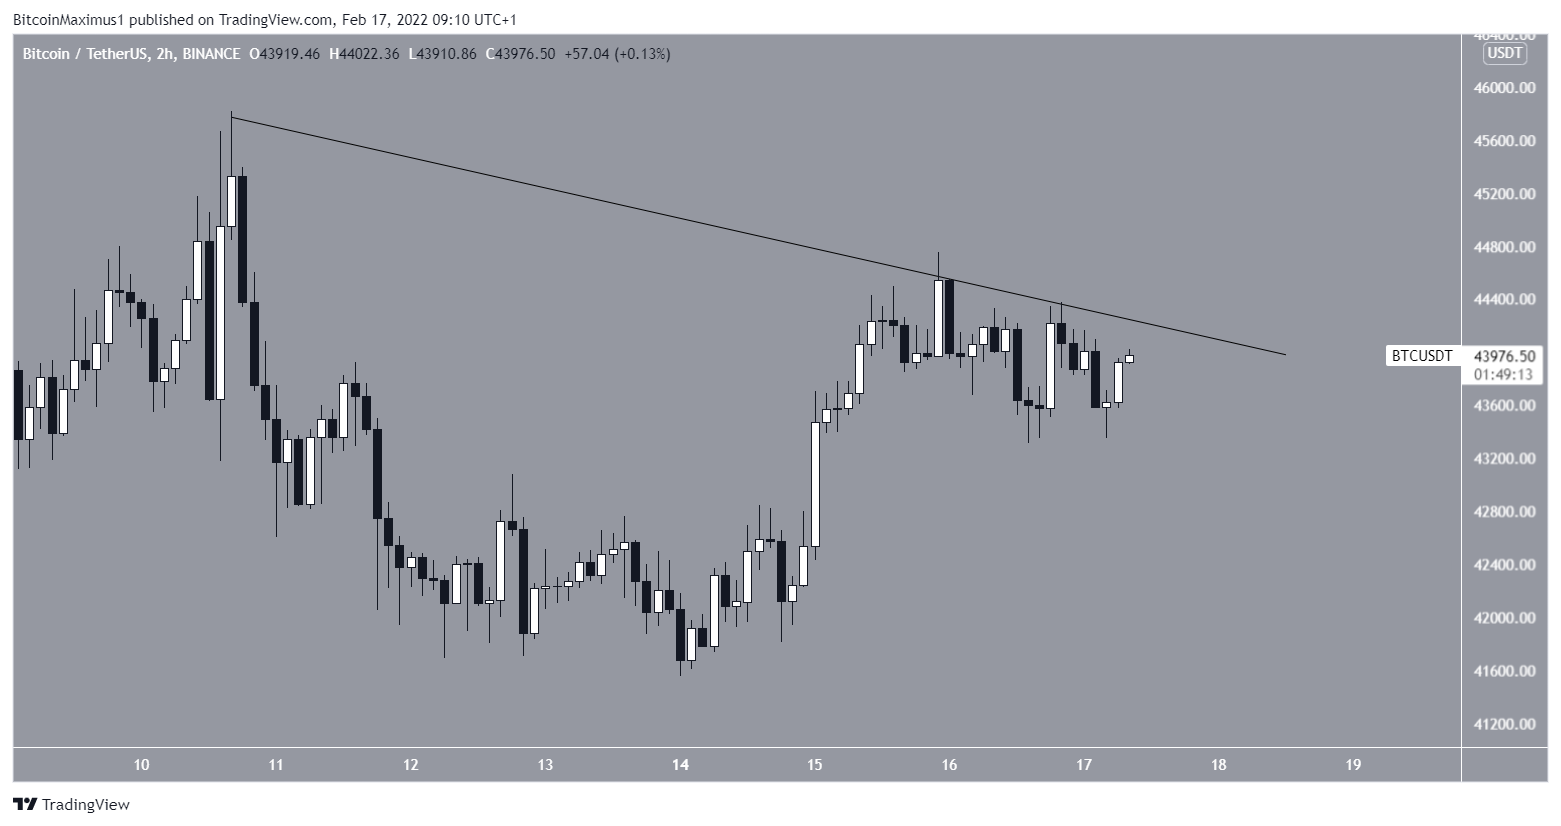
The two-hour chart shows that BTC is still trending beneath a short-term descending resistance line, which so far has been validated multiple times. A breakout above this resistance would also cause a breakout from the previously outlined horizontal resistance area.
BTC wave count analysis
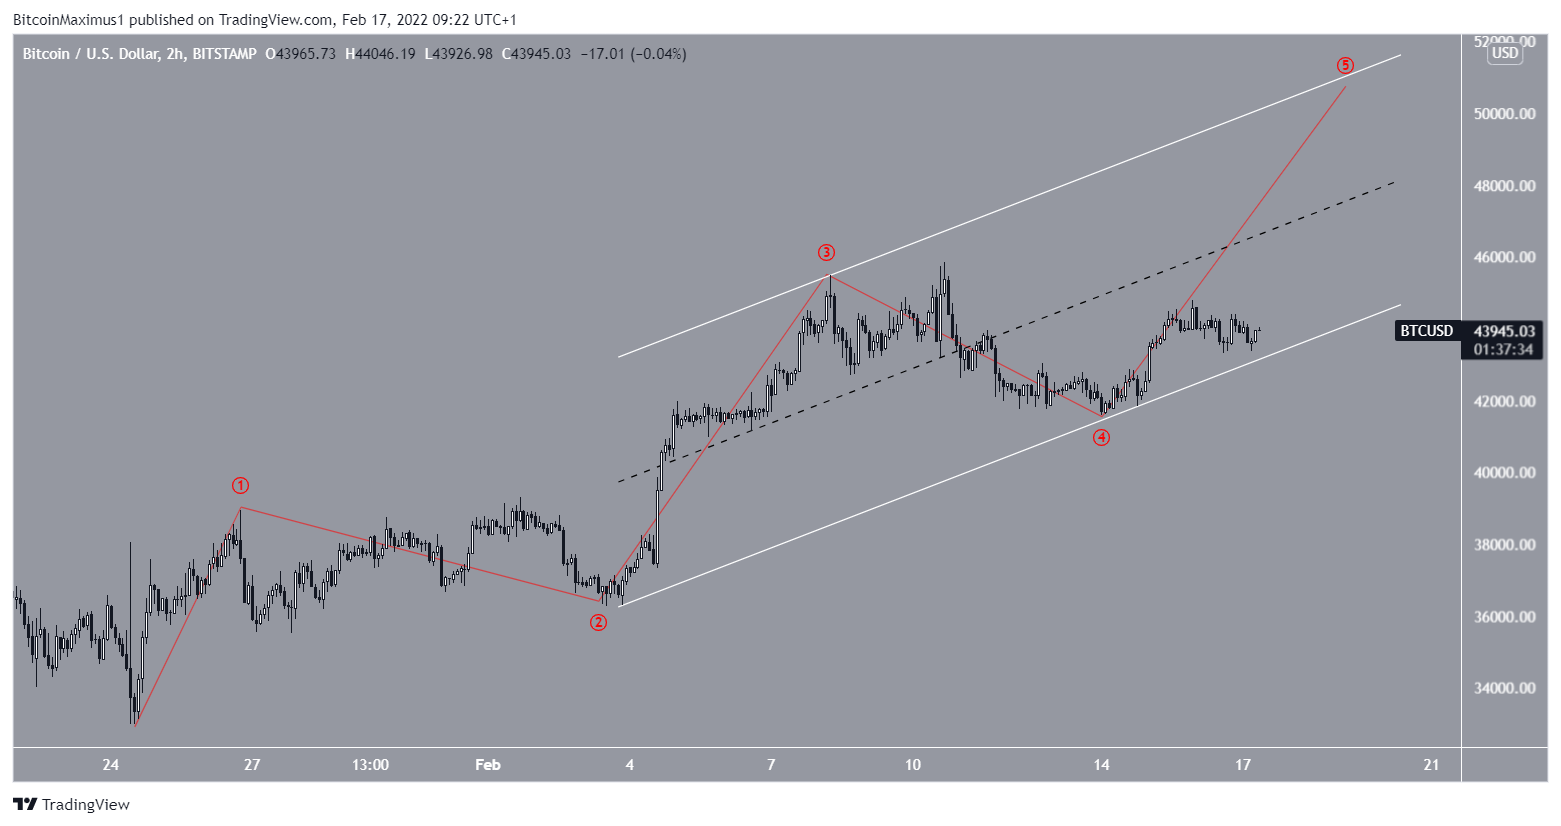
The wave count suggests that BTC is in wave five of a five-wave upward pattern (red) that began on Jan 24. Since neither waves one nor three have extended, it would make sense for wave five to do so.
A decrease below $43,000 would put this wave count in doubt since it would cause a breakdown from the wave 2-4 trendline (white). The resistance line of this trendline channel is currently at $51,000, coinciding with the previously outlined horizontal resistance area.
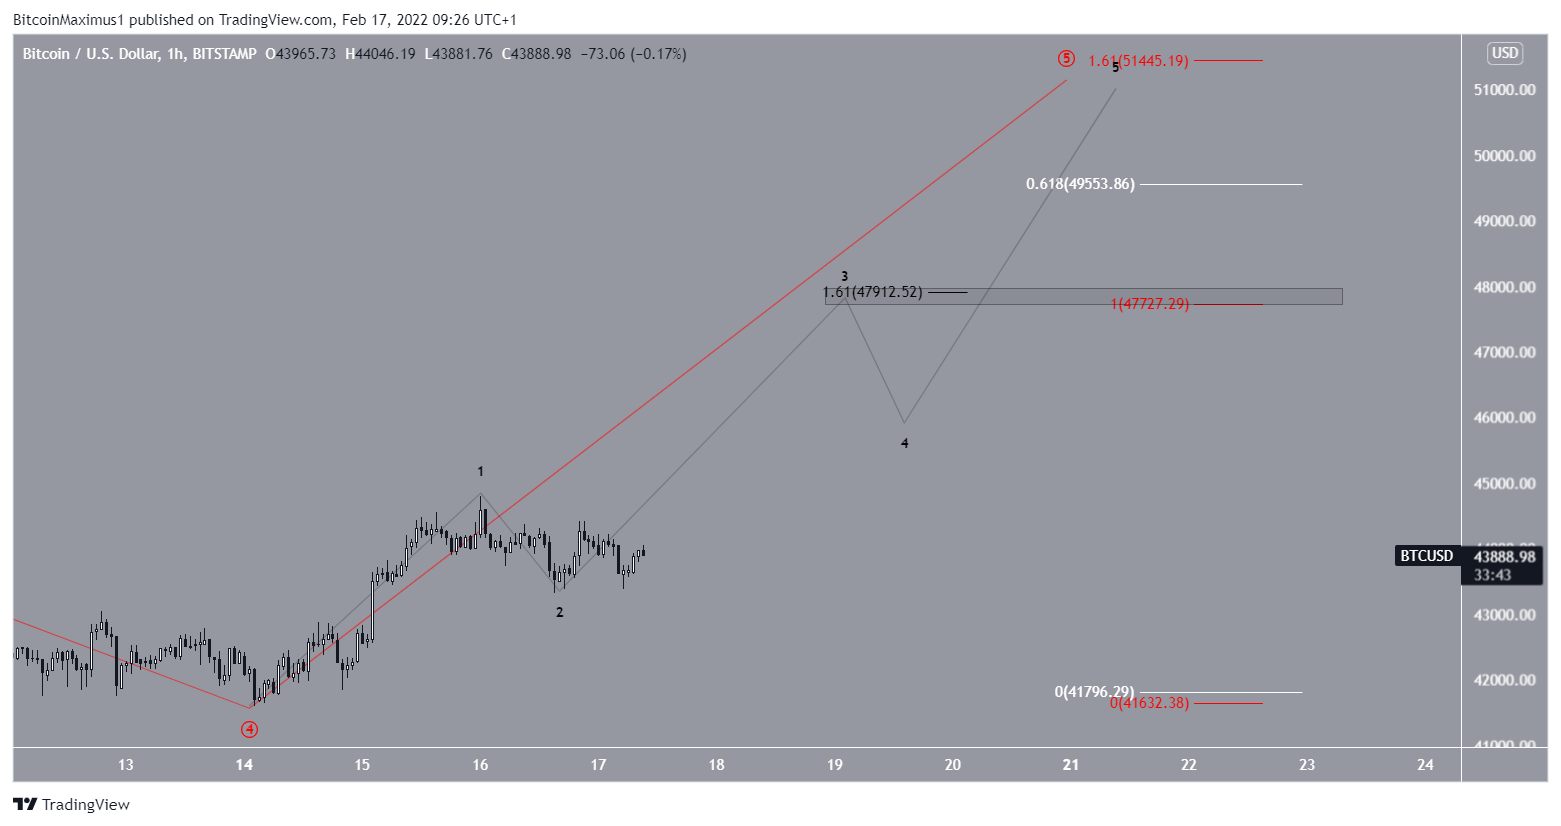
The one-hour chart shows that BTC has completed sub-waves one and two of this same upward move (black).
There are several targets for the completion of this pattern.
The first target is found between $47,700-$47,900. This range is created by an external retracement on wave four (black) and would give waves one and five a 1:1 ratio.
However, since wave five is the most likely to extend, targets at $49,553 and $51,445 would make more sense.
The latter, which would give waves one and five a 1:1.61 ratio, would also have confluence with horizontal and diagonal resistance levels.
For BeInCrypto’s previous Bitcoin (BTC) analysis, click here


