
Bitcoin (BTC) has been moving downwards since April 14, in what is likely a long-term wave four.
BTC is trading inside a short-term descending parallel channel, from which a breakout is expected.
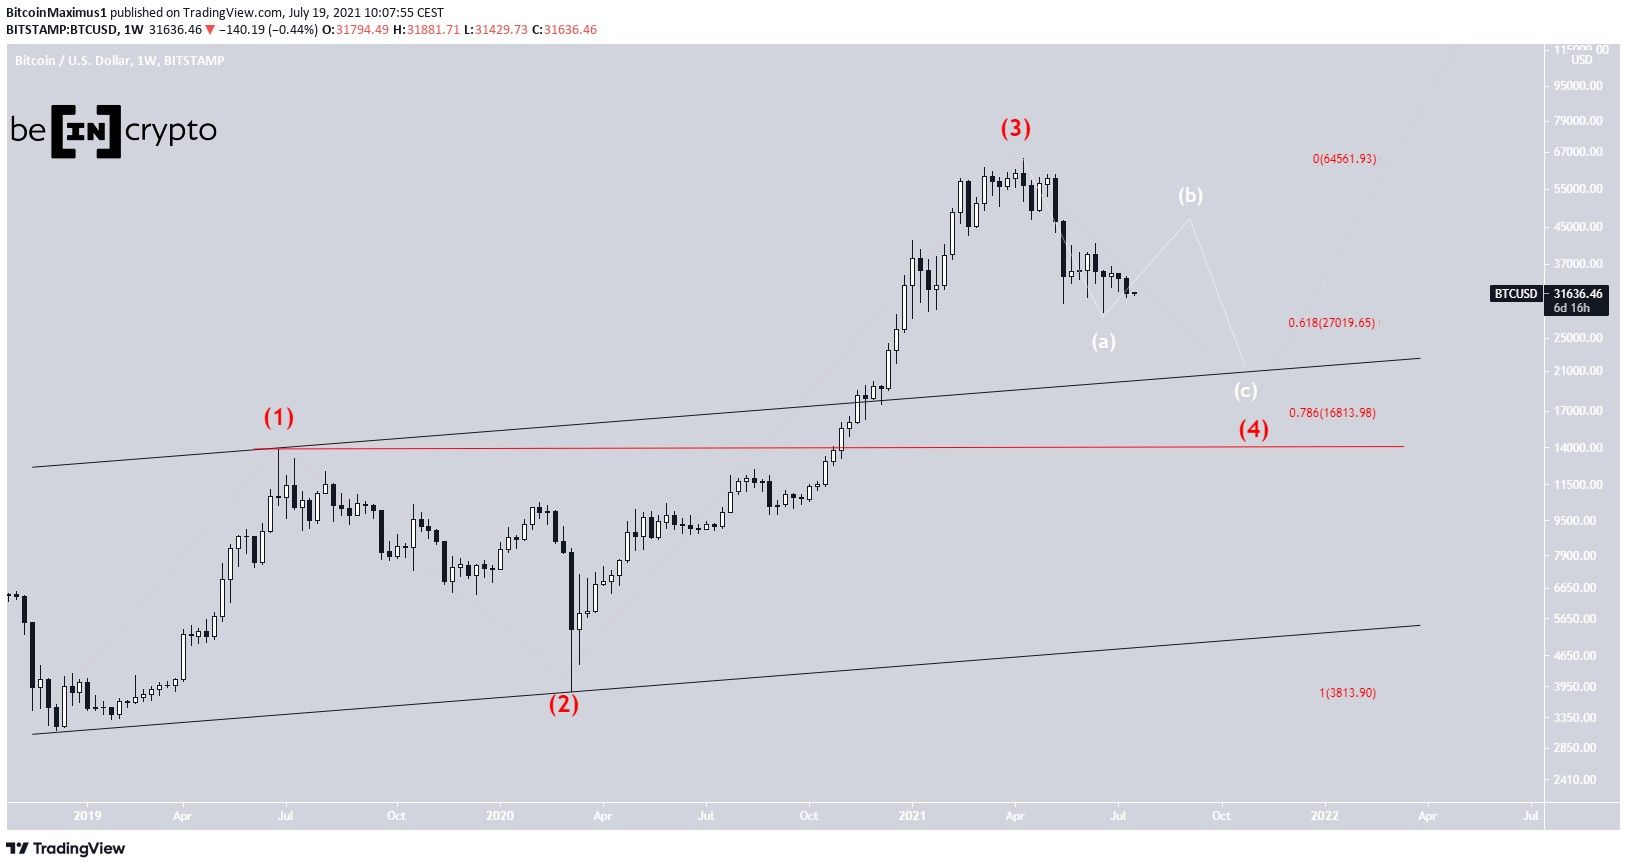
Long-term BTC count
BTC has been moving downwards since it reached an all-time high price of $64,895 on April 14. It’s likely that the high was the top of a long-term wave three (red) of a bullish impulse that began in December 2018.
If this is true, it would mean that the price is now in wave four of the same bullish impulse.
The two most likely levels for the completion of this wave are found at $27,000, and $16,800. These targets are the 0.618 and 0.786 Fib retracement support levels. The latter would also complete a fourth wave pullback.
The sub-wave count is shown in white, suggesting that BTC is currently in the B wave of an A-B-C corrective structure.
A decrease below the June 2019 high of $11,247 (red line) would invalidate this particular wave count.
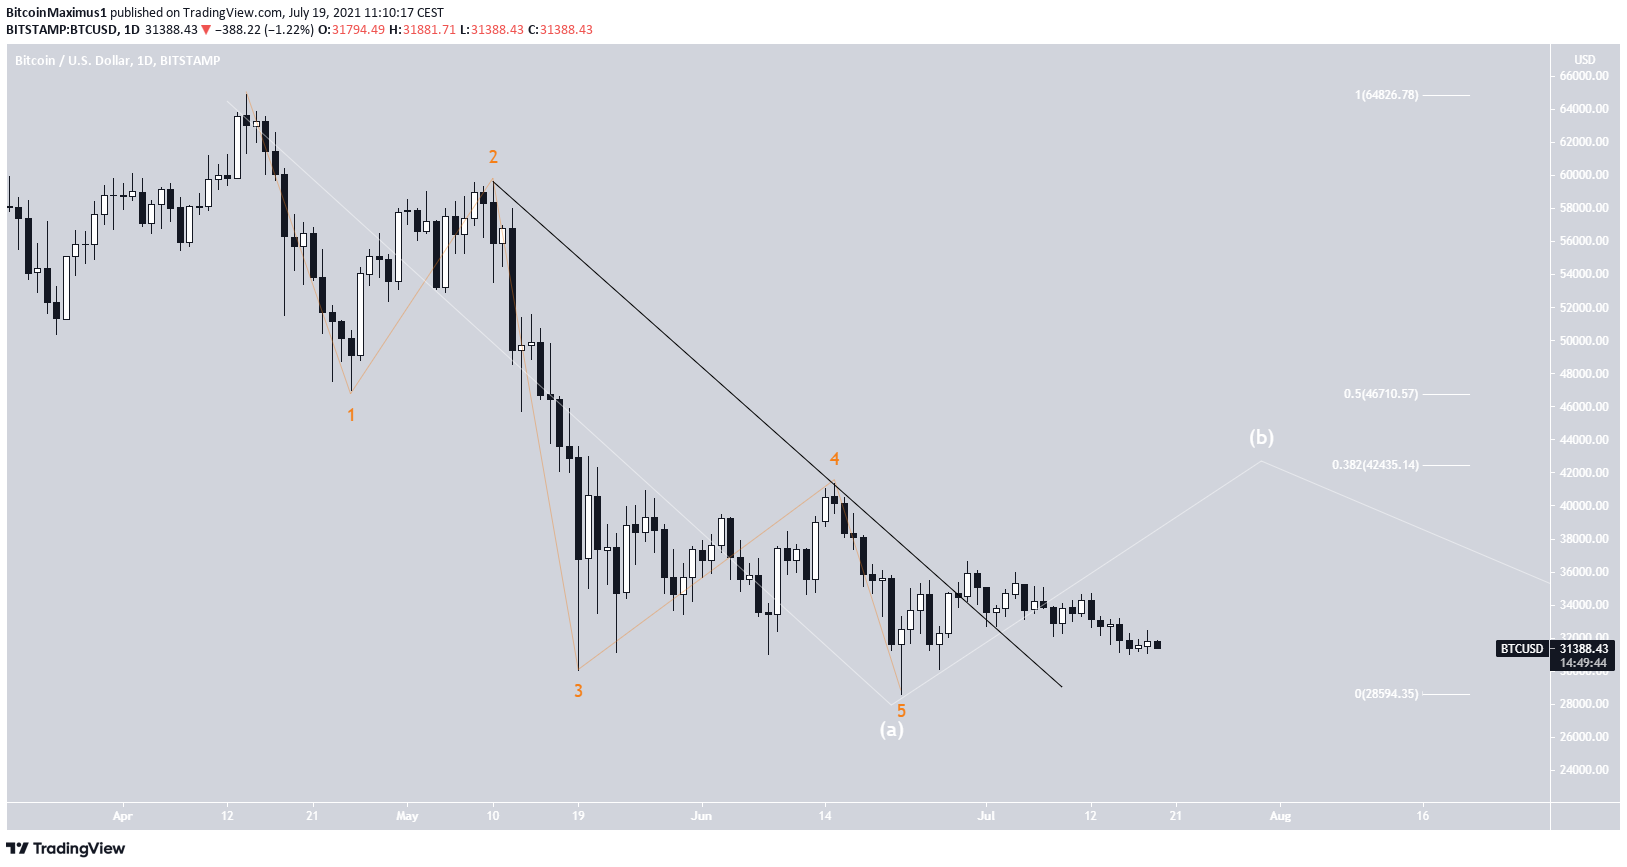
Is the impulse complete?
As for the medium-term count, there are two main possibilities.
The first suggests that the first portion of the drop is complete. This is evident by the completed bearish impulse (orange) that ended with the June 22 low.
The trendline connecting waves 2-4 has been broken. Therefore, it’s doubtful that BTC could still be in the fifth wave.
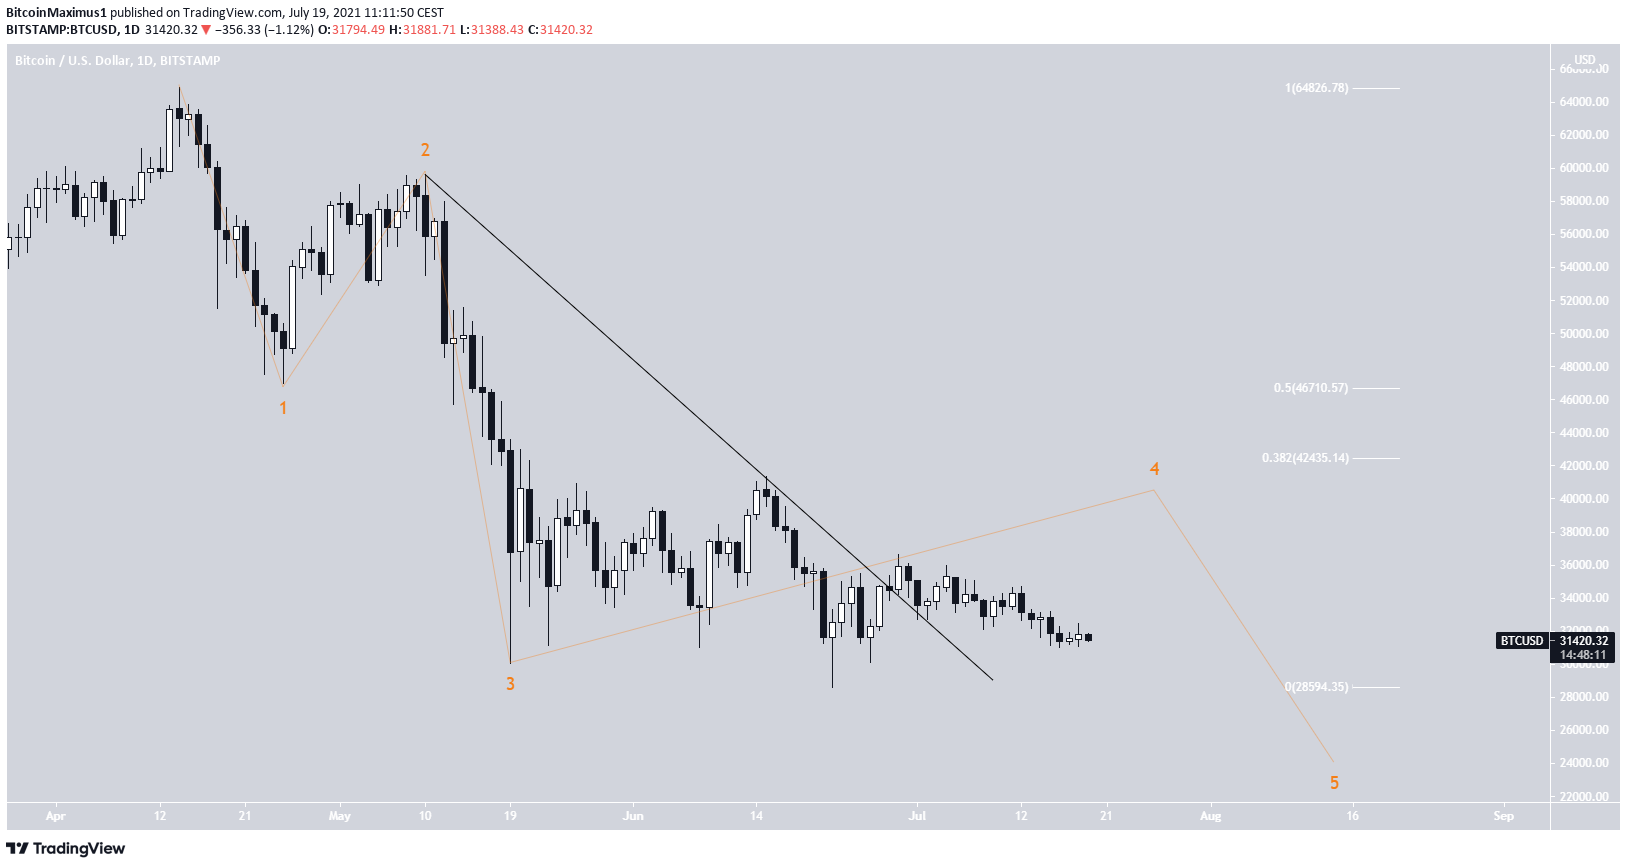
The second potential outlook states that BTC is still in wave four.
If correct, there would likely be another drop after wave four is complete. However, the short-term movement would likely be similar, with a rebound in price being expected soon.
Short-term count
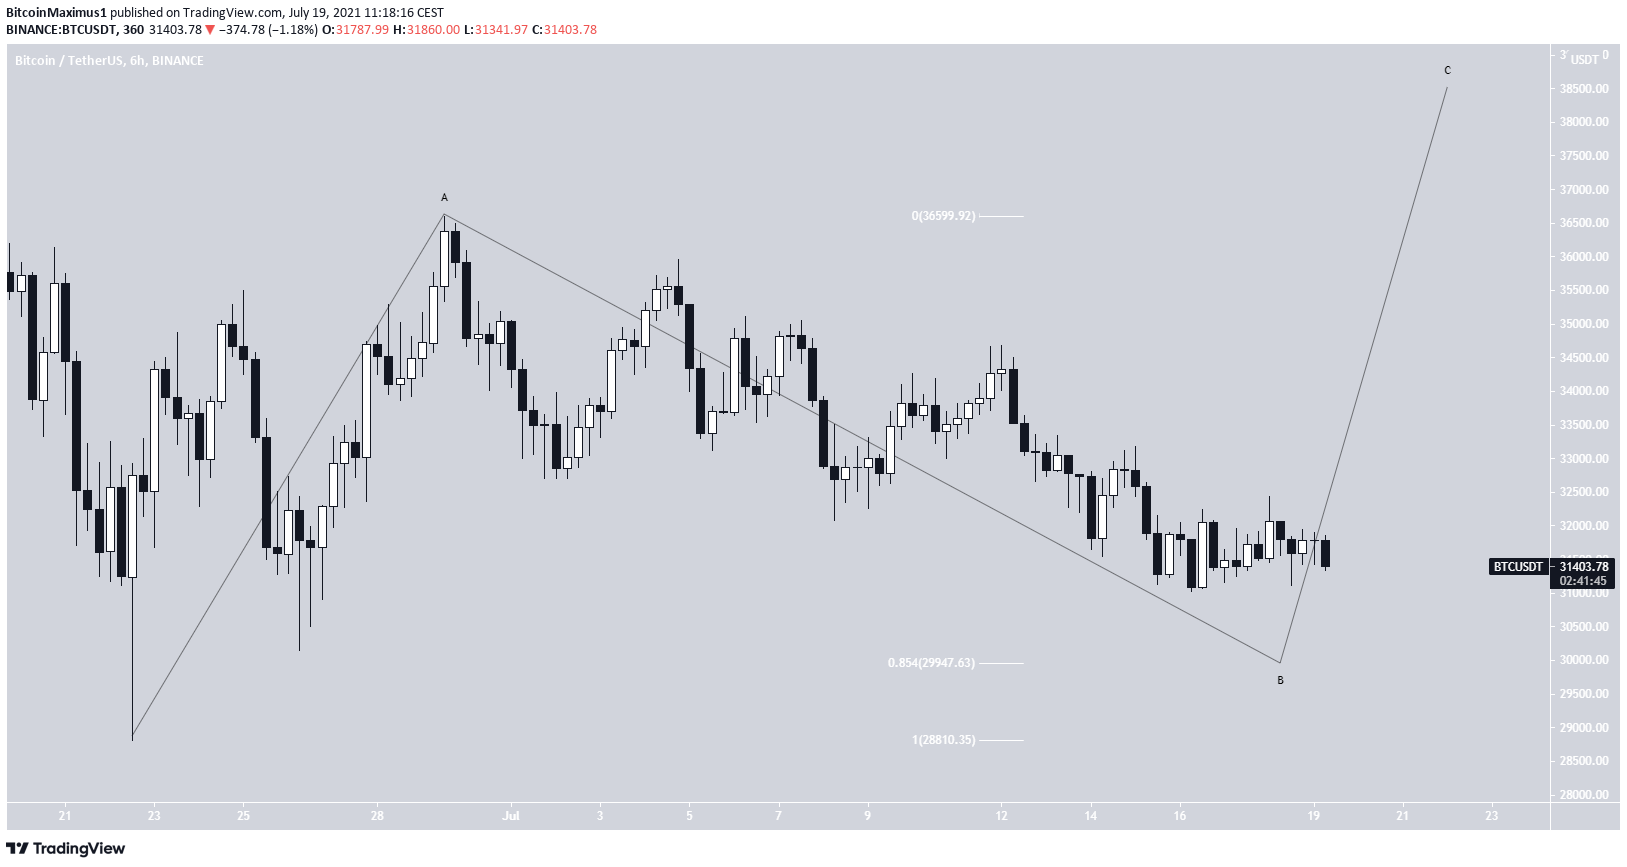
Cryptocurrency trader @AltstreetBet outlined a BTC chart that suggests the price is currently in the B wave of an A-B-C corrective structure.
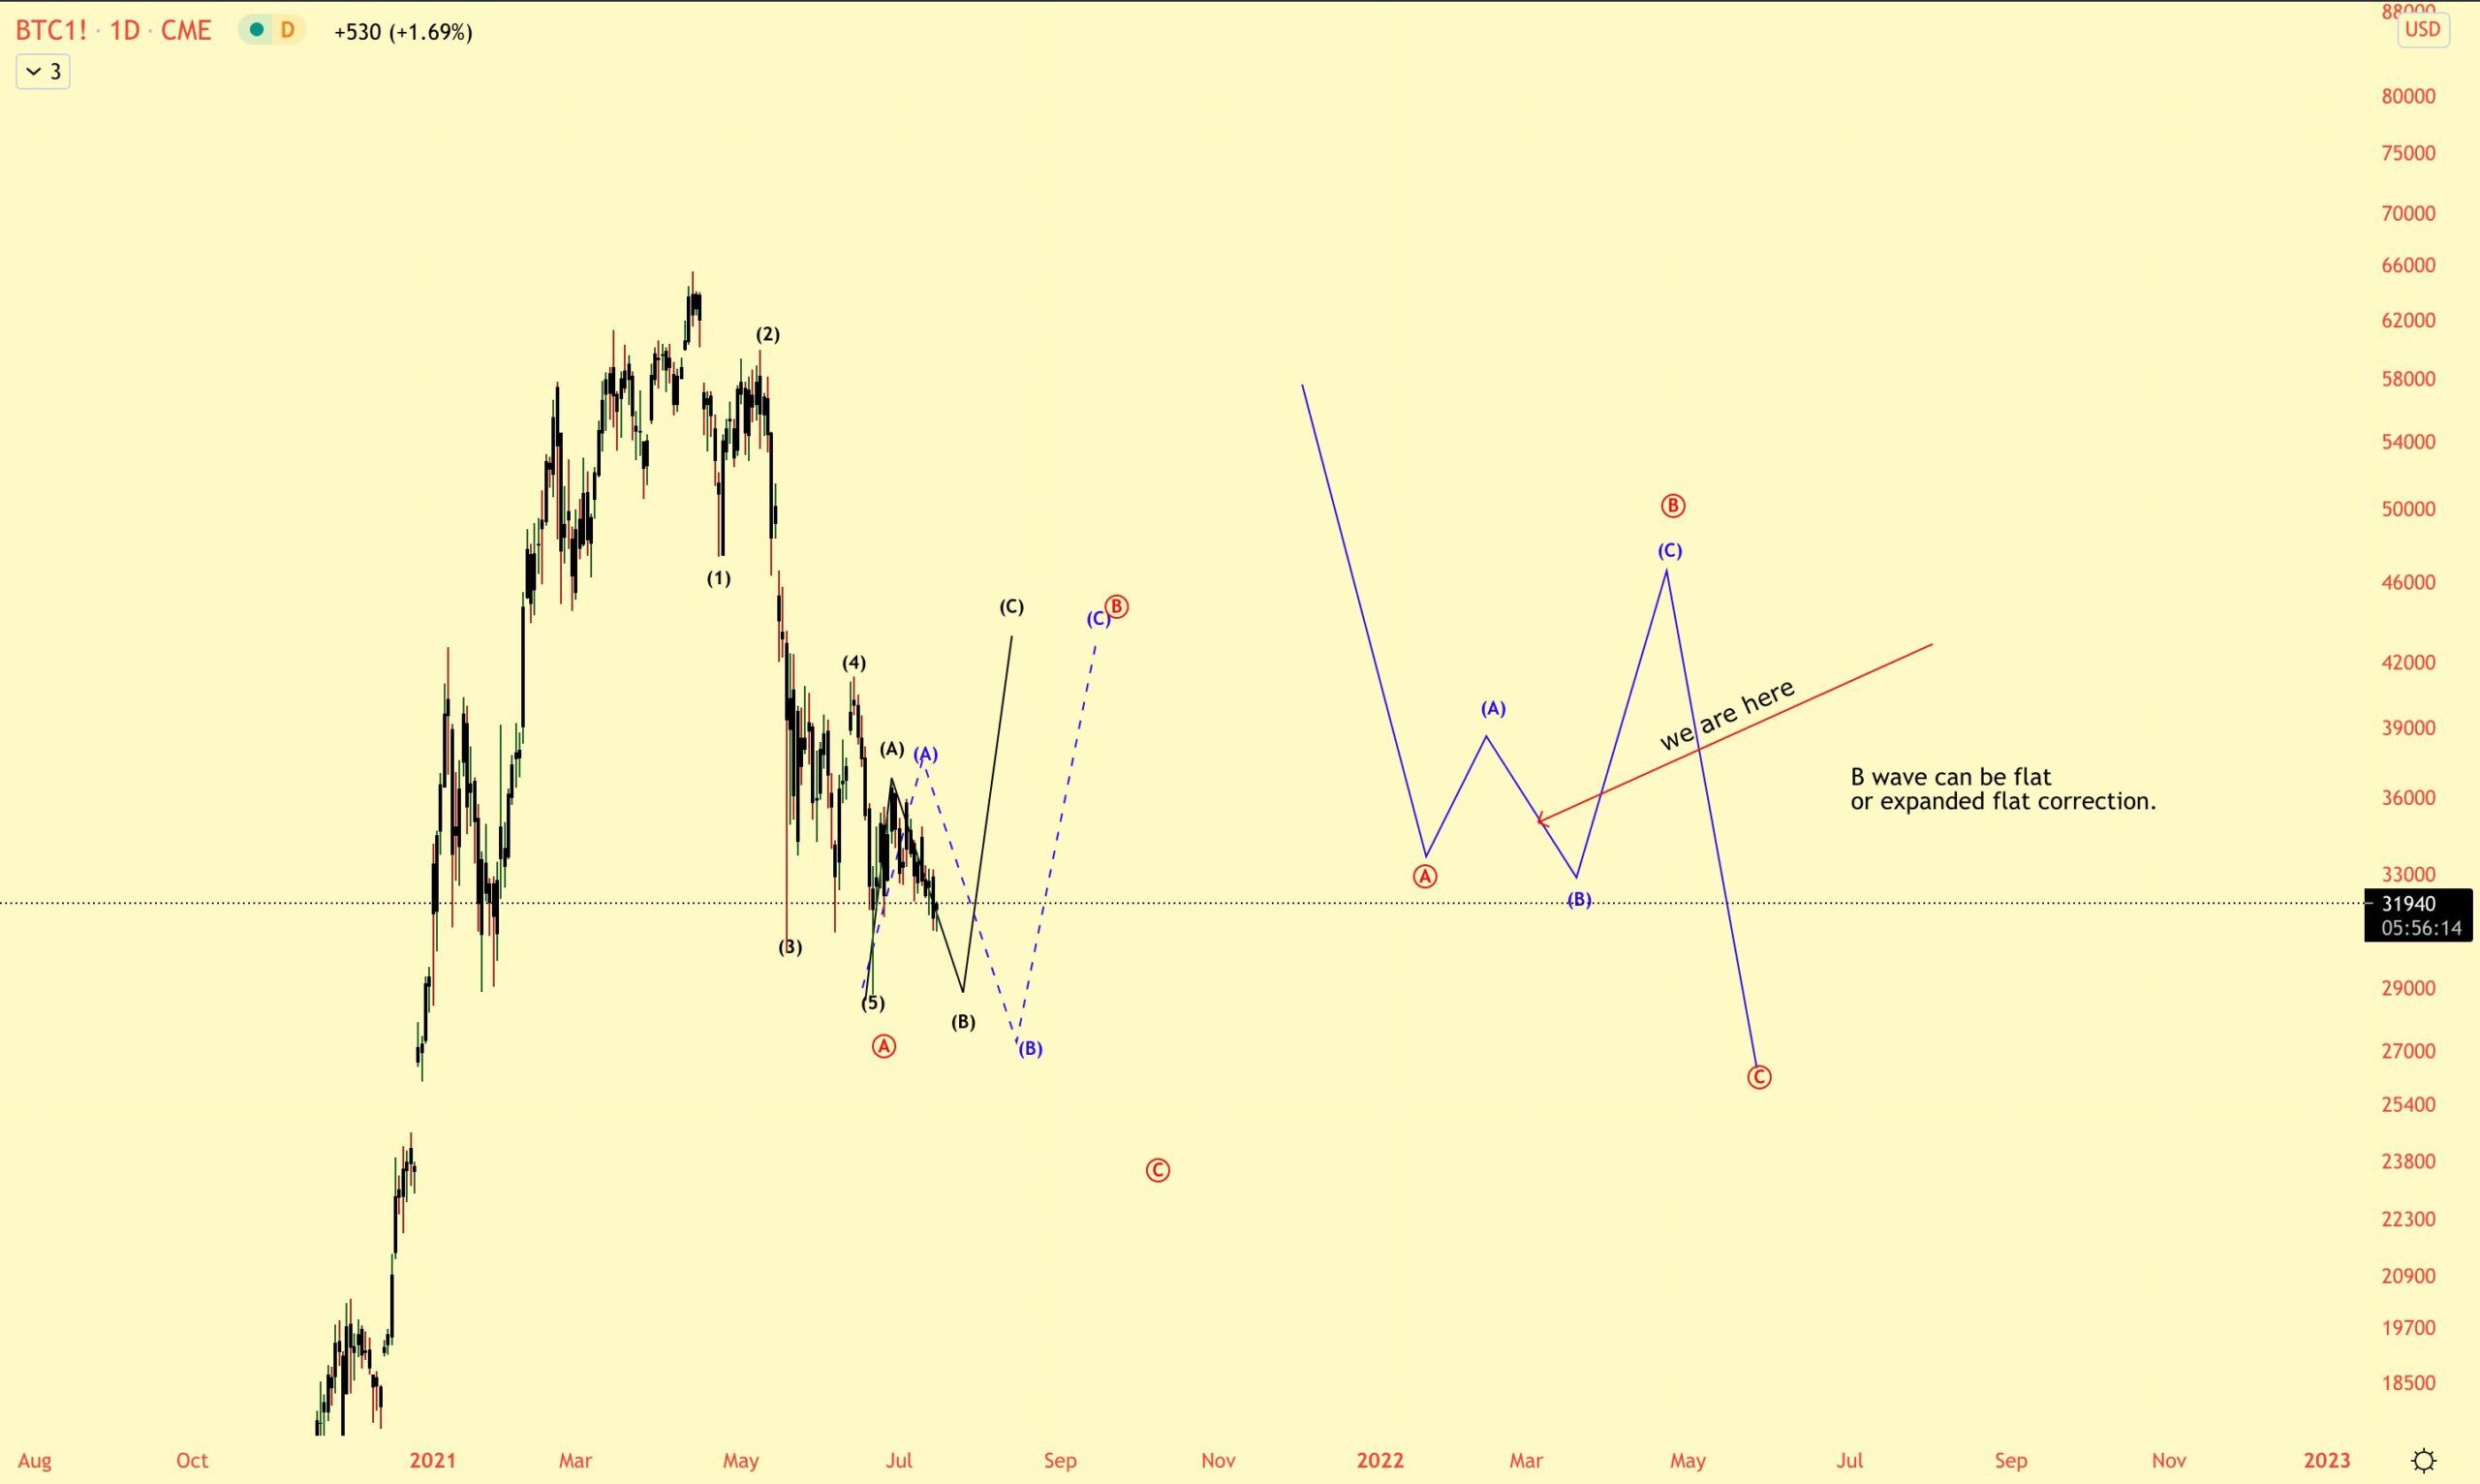
Similar to the daily time frame, there are two main possibilities for the shorter-term count. The first is as outlined in the tweet.
Since the first portion of the upward movement (A wave) was a three wave structure, it means that the movement is a flat corrective structure. Therefore, wave B must retrace at least to the 0.85 Fib retracement support level, and could potentially go slightly lower than the original low.
In this case, BTC could drop to at least $29,950 before bouncing.
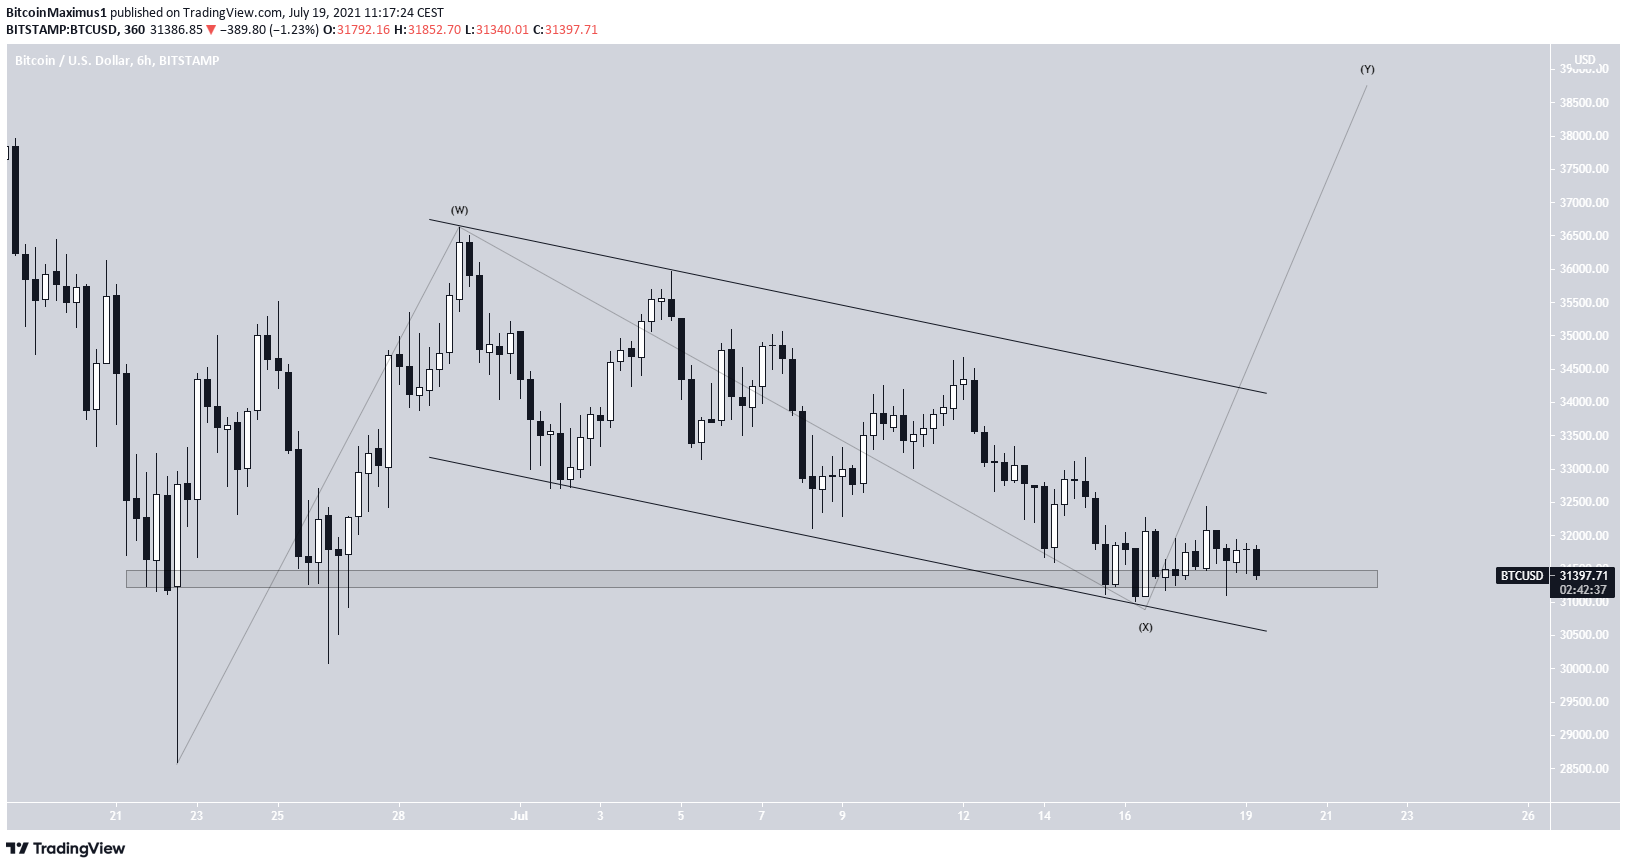
However, a closer look reveals that BTC is trading inside a descending parallel channel, and has been doing so since June 29. Descending parallel channels often lead to breakouts.
In addition to this, it’s trading inside the strong $31,300 horizontal support area. Therefore, it’s possible that BTC will reverse at this level and immediately begin to bounce back.
For BeInCrypto’s latest bitcoin (BTC) analysis, click here.
