


The Bitcoin price has been decreasing since reaching a high of $19,798 on Dec. 17, 2017. While it reached a temporary bottom of $3,122 on Dec. 15, 2018, it is not yet clear whether that was the low marking the beginning of the next market cycle or if the price will make a lower low.
Well-known trader and analyst @Mesawine1 did an admirable job in outlining numerous possibilities for the current correction. The tweet gives a wave count all the way from the all-time high reached in December 2017, specifically focusing on the movement from the December 2017 high to the December 2018 low. According to him, there are four possibilities for the correction.
$btc #elliottwave macro count:
Here are my 4 macro counts with the assumption that the first move down to $3100 is an ABC
I'm not gonna lie. The macro count is tricky. With every count there are some iffy sections. What are your thoughts?
Check it out!#btc #bitcoin #crypto pic.twitter.com/MqFxQPSKBV
— Cryptotoad (@Mesawine1) March 30, 2020
Below, we will take a look at each possibility and discuss the price movement that would invalidate each of them.
End of the Correction
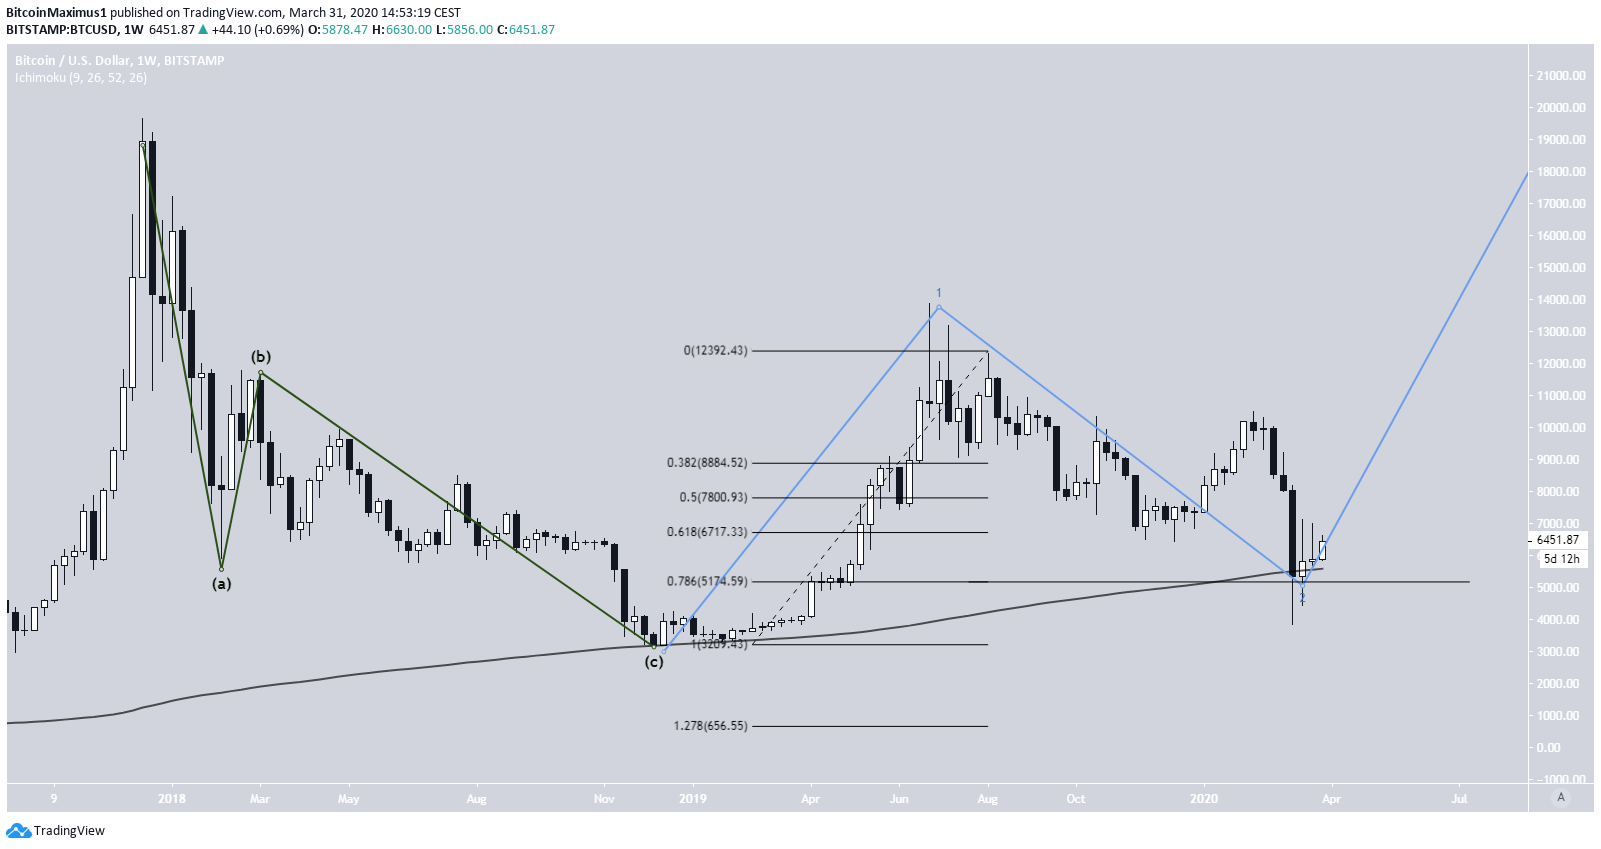
The first possibility assumes that the price completed its correction with the $3,122 low reached on Dec. 15, 2018. The movement afterward has been the first wave of the next five wave Elliott formation, and the price is currently in the second wave, which is corrective.
This is the most bullish scenario out of the four. In order for the possibility to remain valid, the price needs to hold above the 200-week moving average (MA) and the $5,200 support level, which is the 0.786 fib level of the entire upward move. While the price has decreased below this level, it has failed to reach a close below it. As long as it does not do so, this possibility remains valid.
A of Larger A-B-C
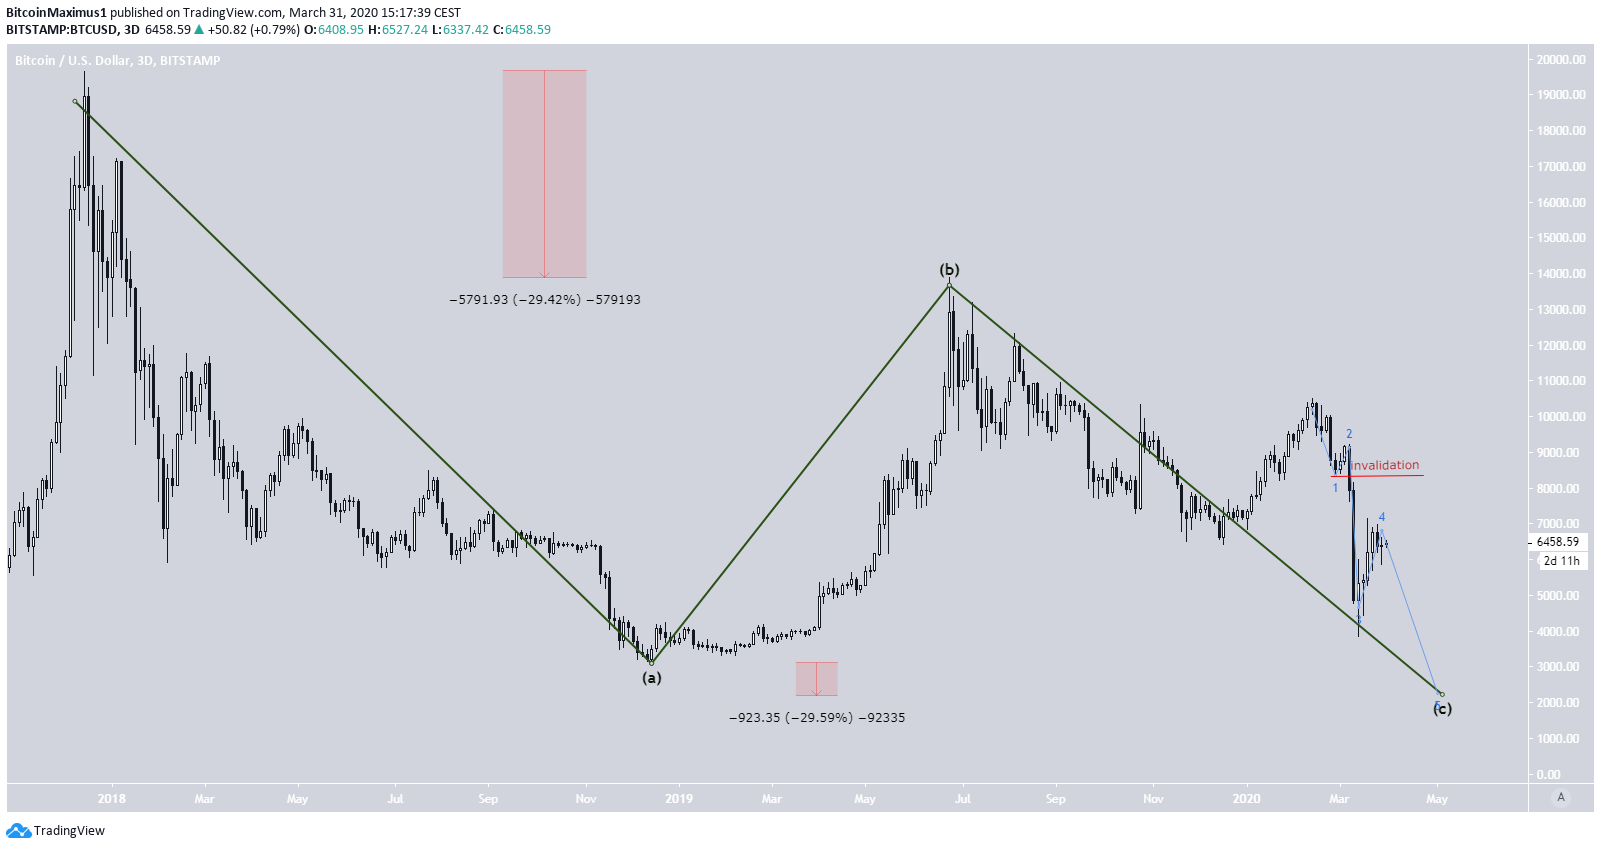
The second possibility is more bearish, suggesting that the price is currently in the C wave of a larger A-B-C correction.
Assuming that the waves A and C have similar lengths, we can use the rate of decrease from the top of wave A to the top of wave B, and project it to the bottom of wave A, in order to find the bottom of wave C. Doing so gives us a low of $2,200.
If this is the correct wave count, we are currently in wave four of a smaller five sub-wave correction. The ensuing wave five is likely to be rapid and take the price all the way to $2,200.
This possibility would be invalidated by a daily close above the low of wave one, which in the image below is marked by the red “invalidation” line.
A of Larger Triangle
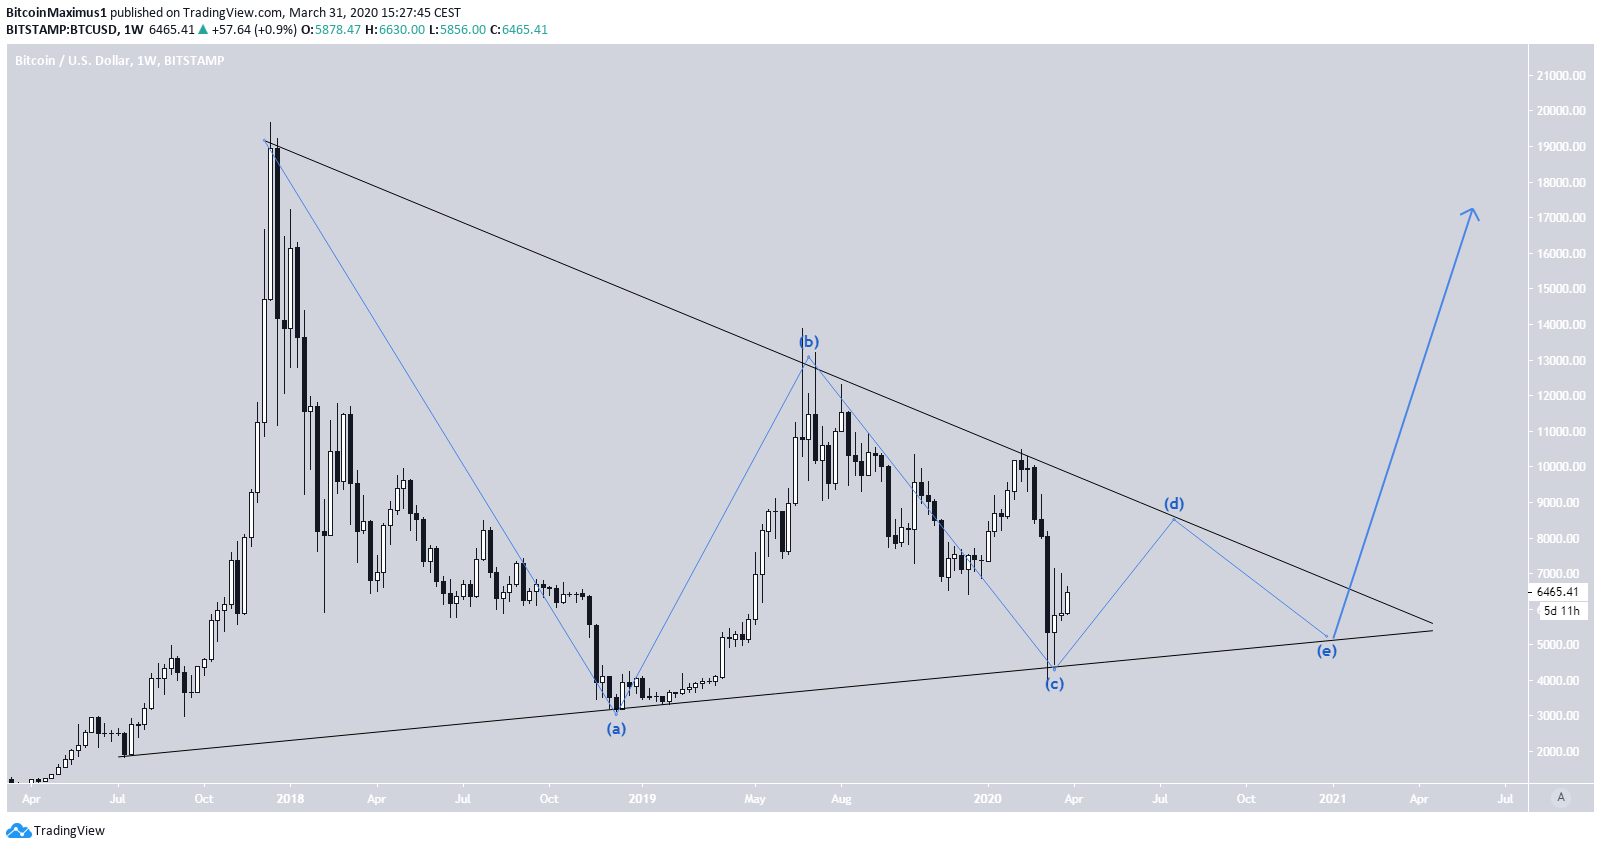
The third scenario suggests that the Bitcoin price is still correcting, however it is doing so inside a symmetrical triangle. Corrections inside the triangle take an A-B-C-D-E wave count, with each log and high being lower than the previous one.
Therefore, the December 2018 low is the lowest level the price will reach during the correction. In this scenario, the March 13, 2020 bottom was the end of wave C, while the price is currently in wave D.
The correction is expected to end by the end of the year before the price resumes its upward movement.
W of a W-X-Y Correction
We have discussed this possibility in length in this previous article, so we will not dwell on it longer. While the wave count is different, the low is very similar to that reached in the “A of larger A-B-C” scenario.
To conclude, the BTC price has been decreasing since reaching a high of $19,798 on Dec. 24, 2017. While the type of correction transpiring is not yet entirely clear, we can simplify the possibilities by applying an upper and lower price limit that would serve to eliminate possibilities as they unfold.
A weekly price close below the 200-week moving average (MA) would suggest that the price will decrease toward at least $2,200, while a weekly close above $8,000 would indicate that the price has already reached a bottom.
Whichever may be the case, it definitely seems that the price is much closer to the bottom than it is to the top.


