


Optimism (OP) price noted a 10% rally in the past 24 hours, and on a technical level, it is poised for further rally.
However, considering the broader market cues, OP might end up correcting by 15%. Here is why.
Optimism Faces Bearish Pressure
Optimism price, trading at $3.78 at the time of writing, is reeling from a 10.81% rally observed in the last 24 hours. In the short-term timeframe, this marked considerable profits for investors, preparing for further rise, which likely may not come.
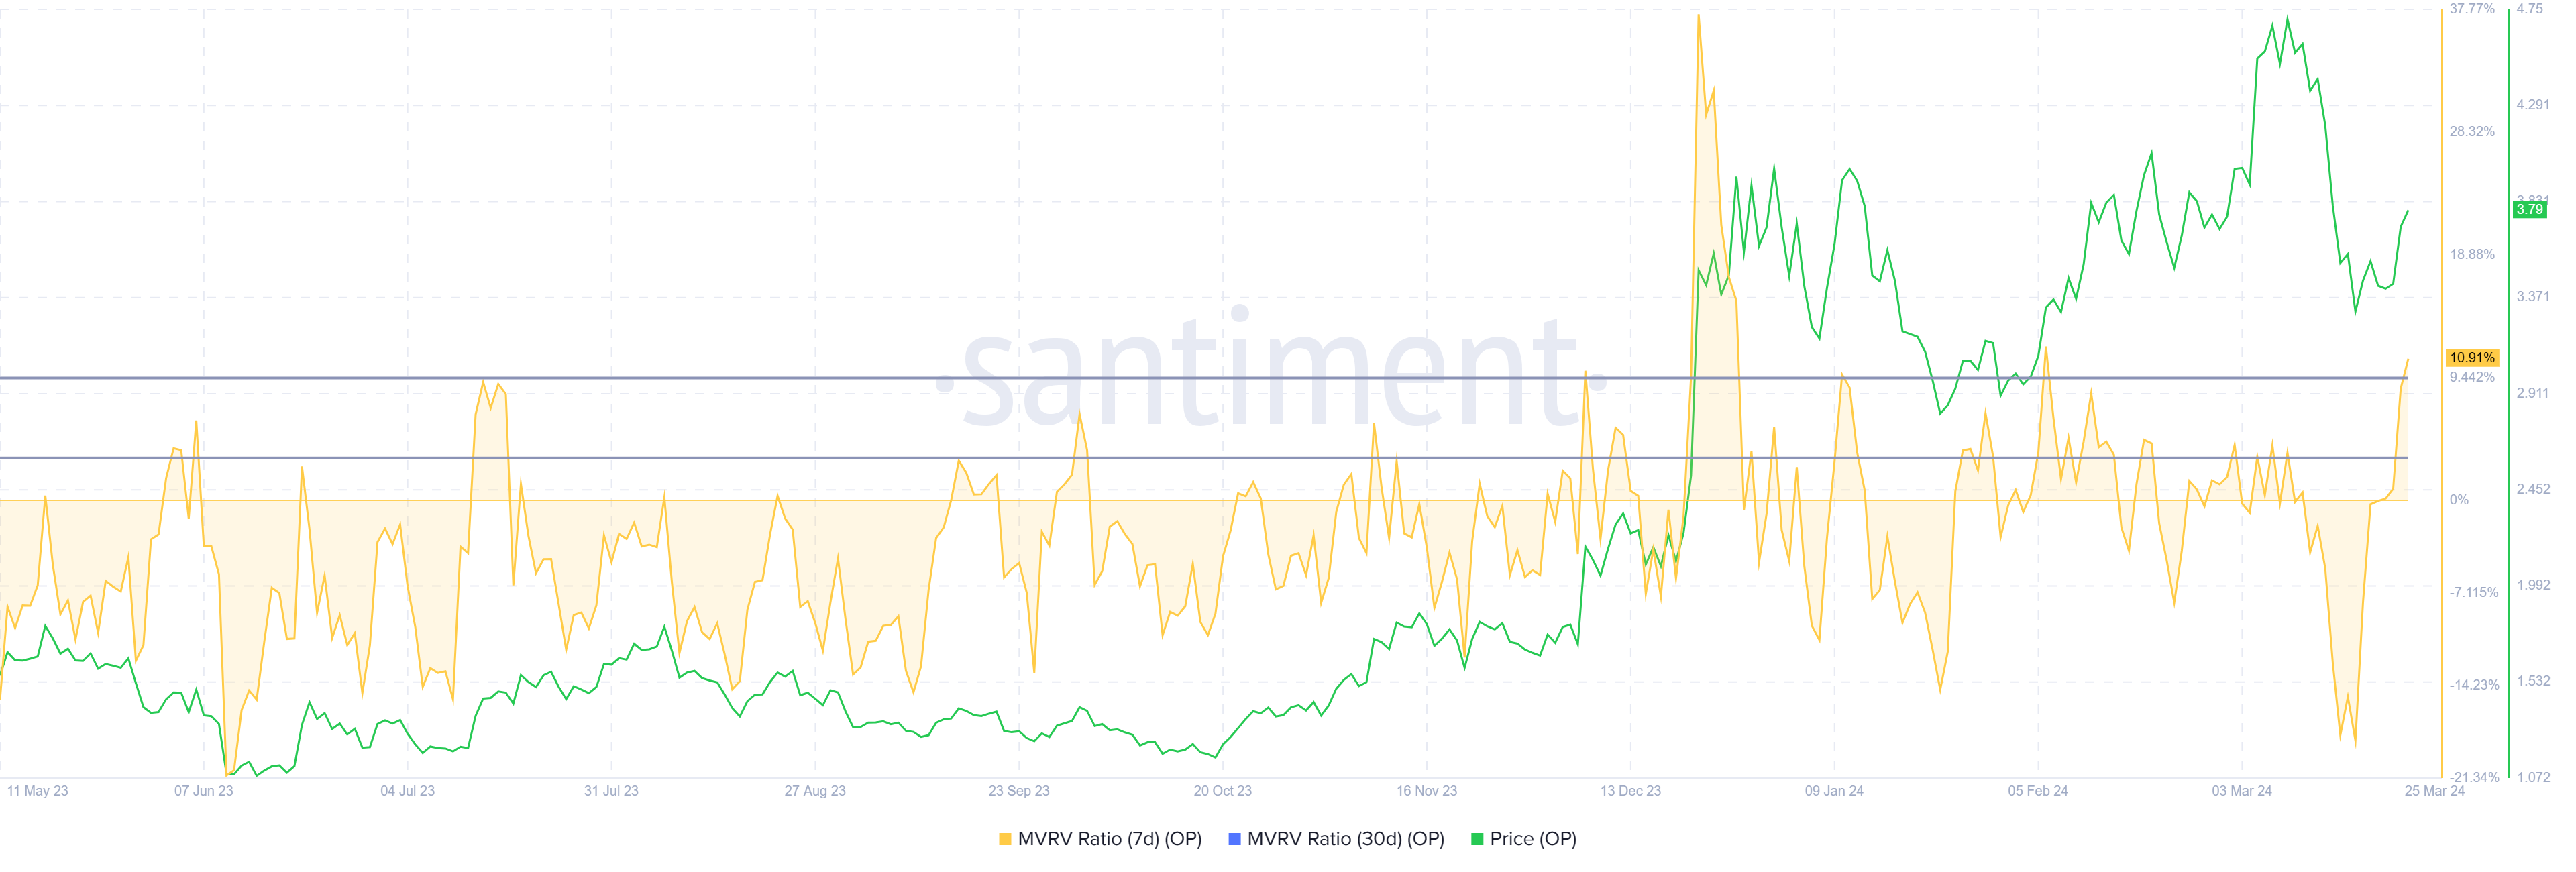
The reason is that the recent rally intensified the selling pressure as profits surged. This can be noted in the Market Value to Realized Value (MVRV) ratio. The 7-day MVRV ratio gauges investors’ profit/loss on assets bought in the last week.
Optimism’s MVRV at 10.16% suggests recent buyers’ profits are up 10.16%, likely to sell, signaling a potential downturn. MVRV between 3% and 9% signifies a danger zone for OP, hinting at potential corrections.
Read More: What Is Optimism?
Furthermore, a major resistance in the path of a rally is the 95 million OP that investors bought. This supply was purchased within the $3.87 and $4.85 range, amounting to $361 million.
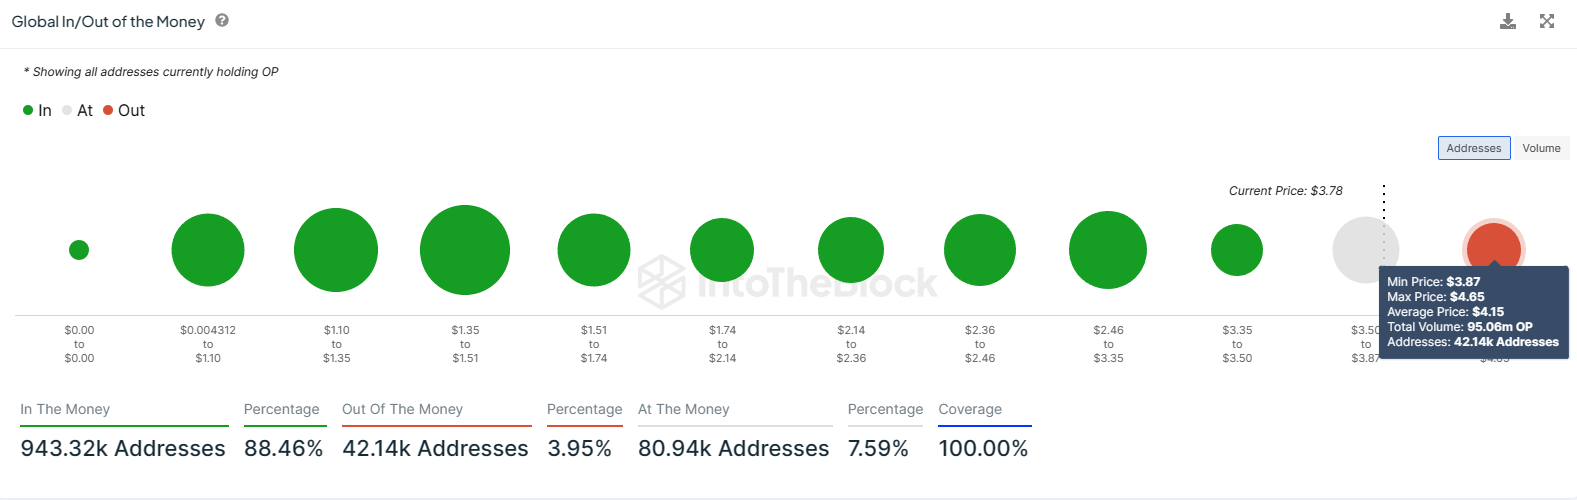
Optimism price might find difficulty in turning this entire supply profitable owing to the potential of selling at the hands of investors. This would result in corrections as OP would fail to breach the key $4 resistance level.
OP Price Prediction: What if Not a 20% Rally?
Optimism price will likely fall back to $3.40 if the aforementioned conditions end up being true. The market would subsequently cool down, and if the broader bearish cues weight upon OP, the altcoin could end up declining to $3.20.
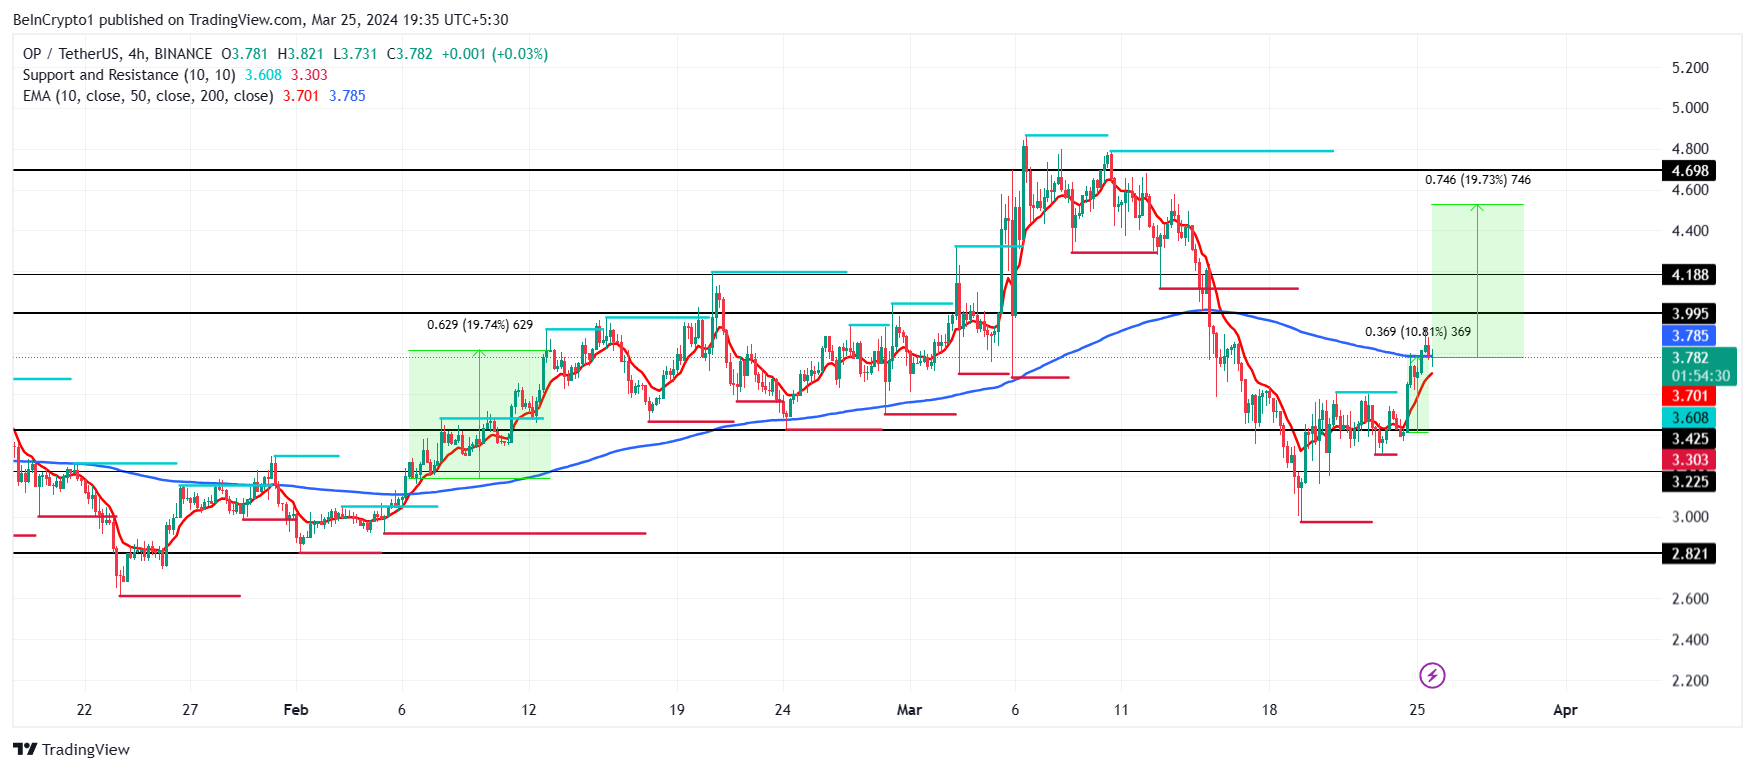
However, the Golden Cross being observed on the 4-hour chart is the first in nearly two months. The golden cross occurs in when the 50-day Exponential Moving Average (EMA) crosses above a 200-day EMA, indicating a potential bullish trend reversal in the market.
Read More: Optimism vs. Arbitrum: Ethereum Layer-2 Rollups Compared
The last time this occurred, Optimism’s price ended up rallying by nearly 20%. A similar rise this time around would send OP to $4.50, invalidating the bearish thesis and flipping $4 into support.


