


Optimism Price Prediction: OP price has likely completed its correction by breaking out from a descending wedge. An increase above $1.42 could significantly accelerate the rate of growth.
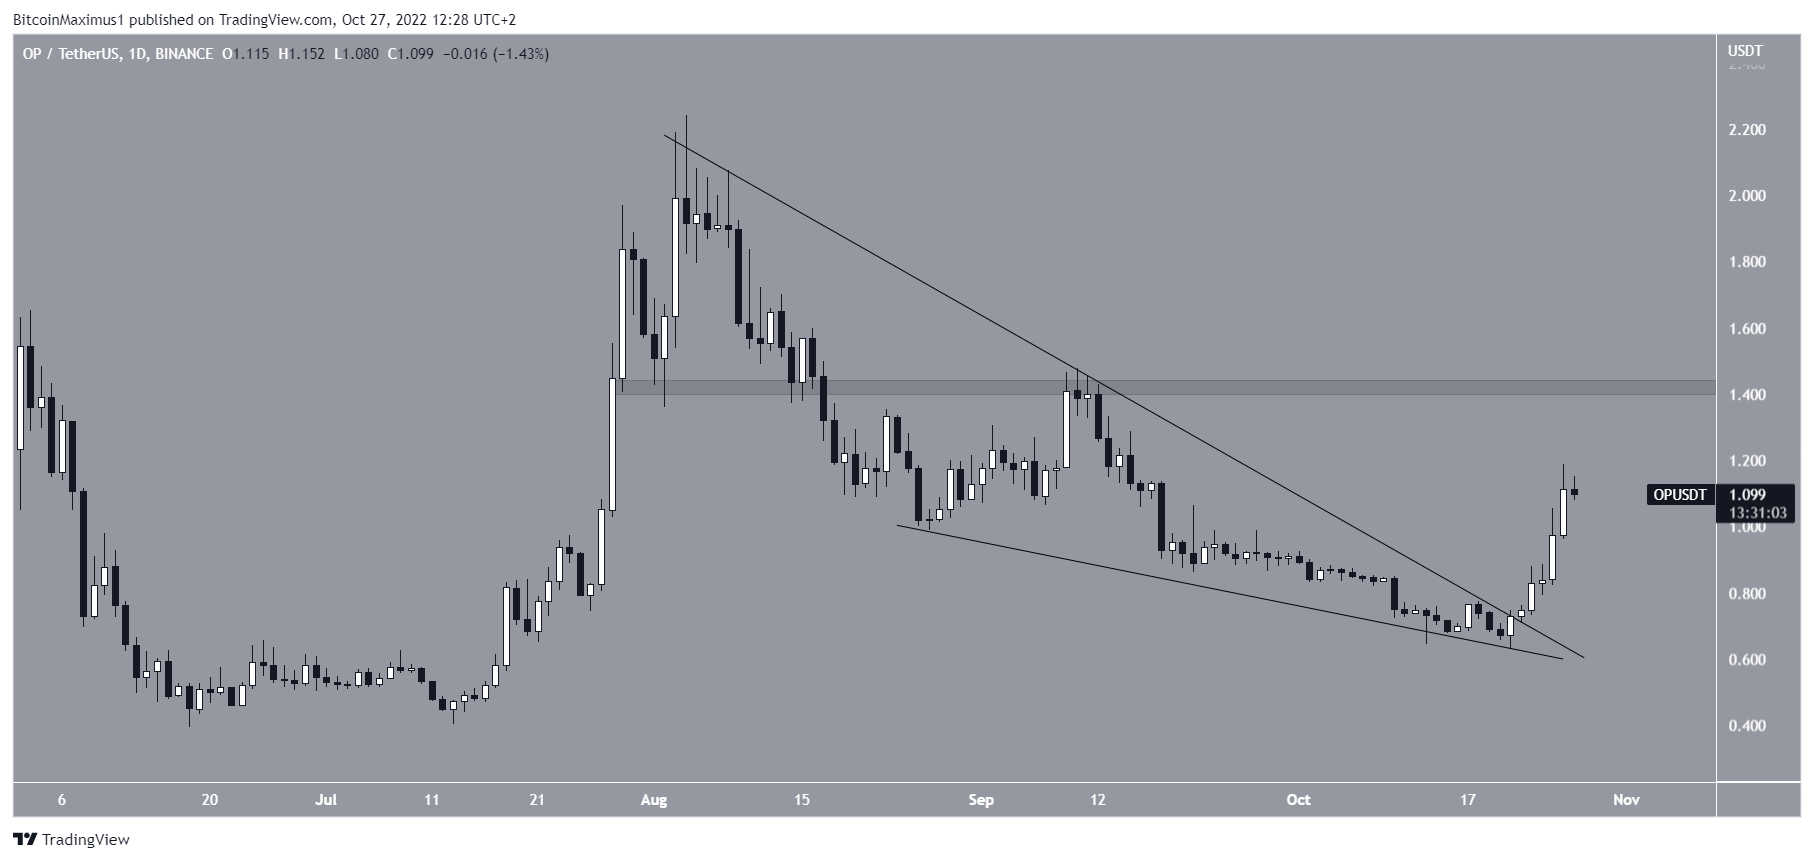
OP price had been falling inside a descending wedge since reaching an all-time high price of $2.24 on Aug. 4. The downward movement led to a low of $0.65 on Oct. 13. Afterward, Optimism price broke out and greatly accelerated its rate of increase.
On Oct. 26, the Optimism price reached a high of $1.19. If the upward movement continues, the main long-term resistance area would be at $1.42.
Optimism Price Prediction: Where to Next?
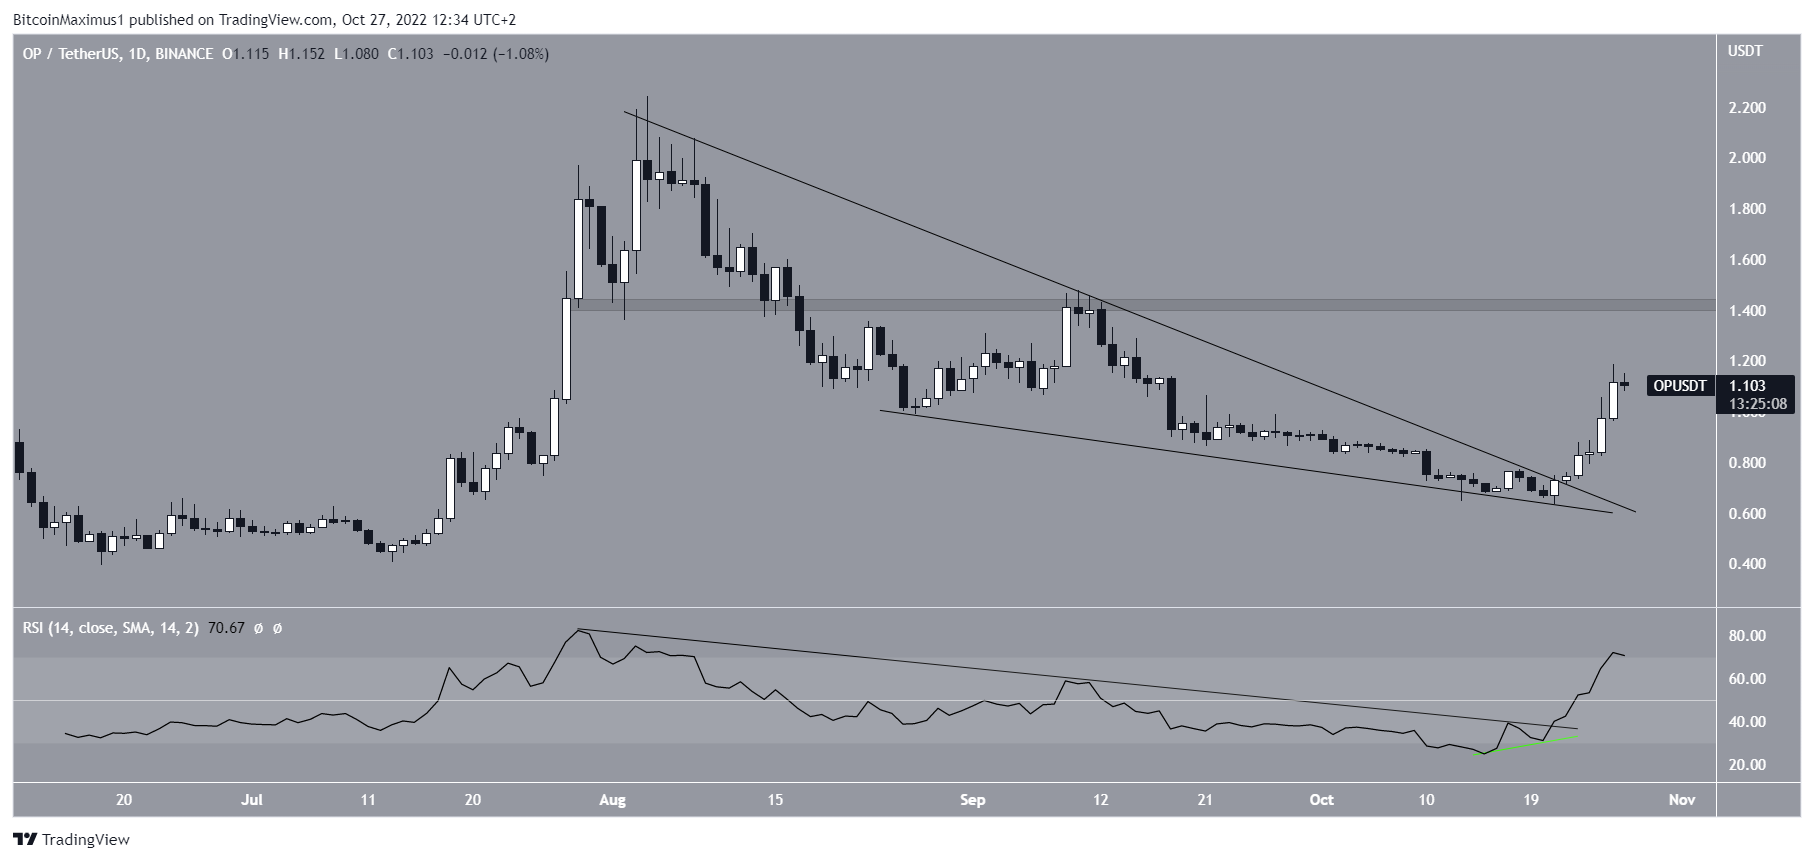
The technical analysis from the daily timeframe is bullish since the daily RSI supports the ongoing OP price increase.
Firstly, it is visible that the indicator generated a bullish divergence (green line) before the breakout. Next, the RSI broke out from its descending resistance line (black) and then increased above 50. Both are signs associated with bullish trends and grant legitimacy to the breakout.
Therefore, the continuation of the Optimism price increase towards at least $1.42 is expected.
Wave Count Supports Continuation of OP Price Increase
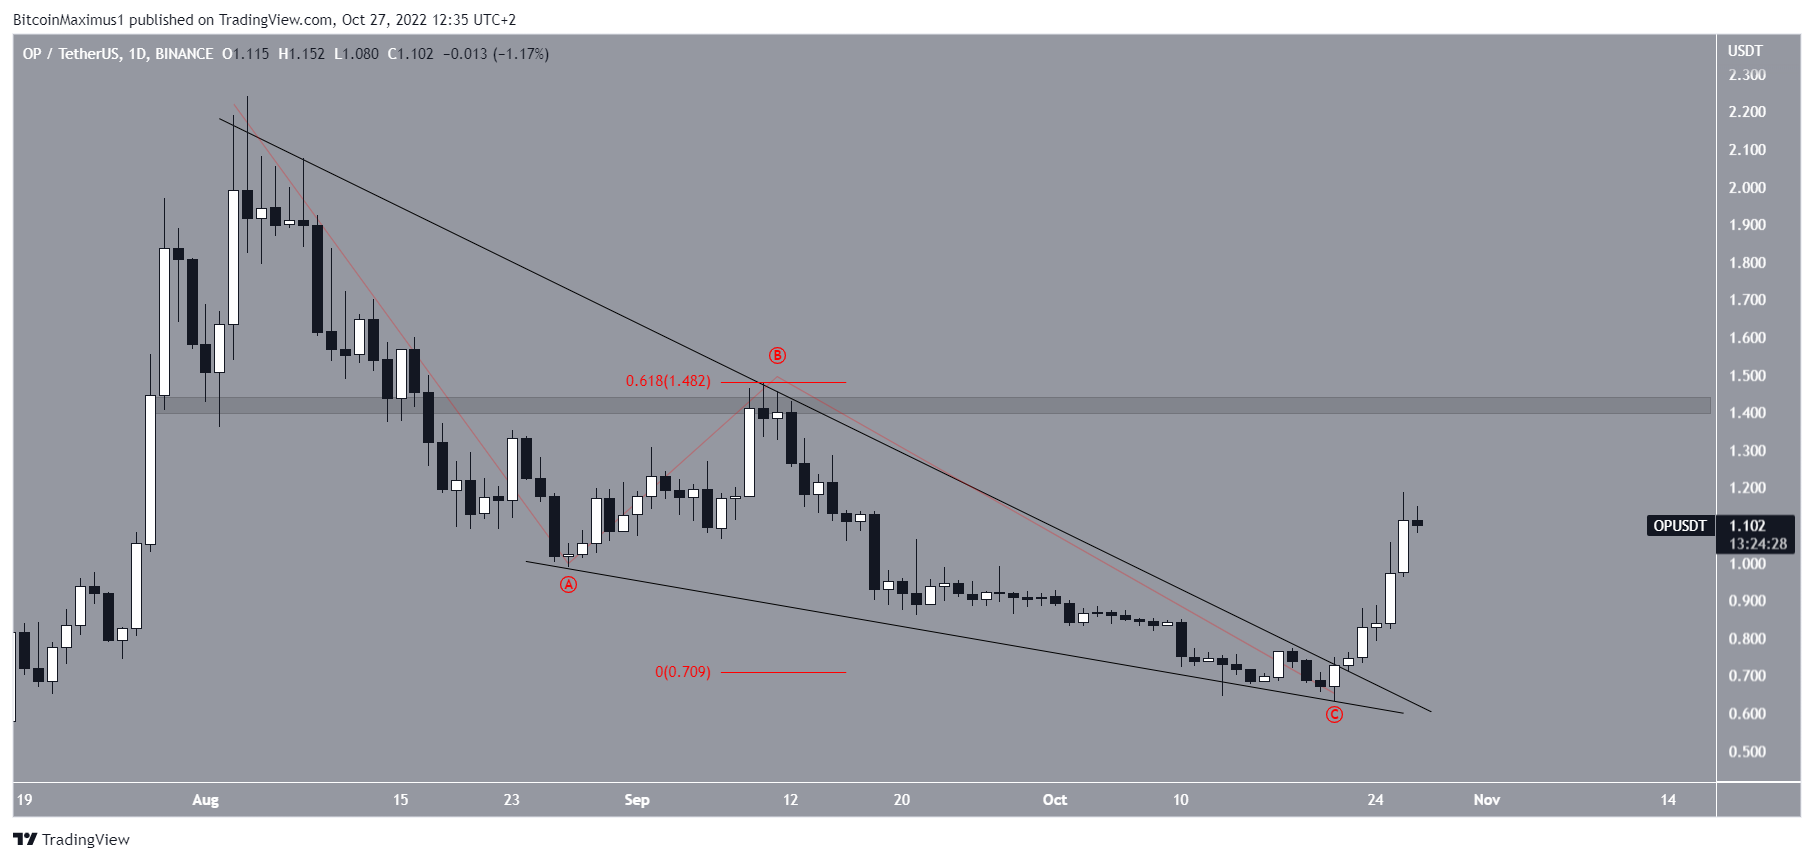
In a similar fashion to the RSI, the wave count also gives a bullish Optimism price prediction. The most likely count suggests that the OP price completed an A-B-C corrective structure (red), in which waves A:C had a 1:0.618 ratio. This is the second most likely ratio in such corrections.
Afterward, the breakout from the wedge confirmed that the correction is complete and that a new upward movement had begun.
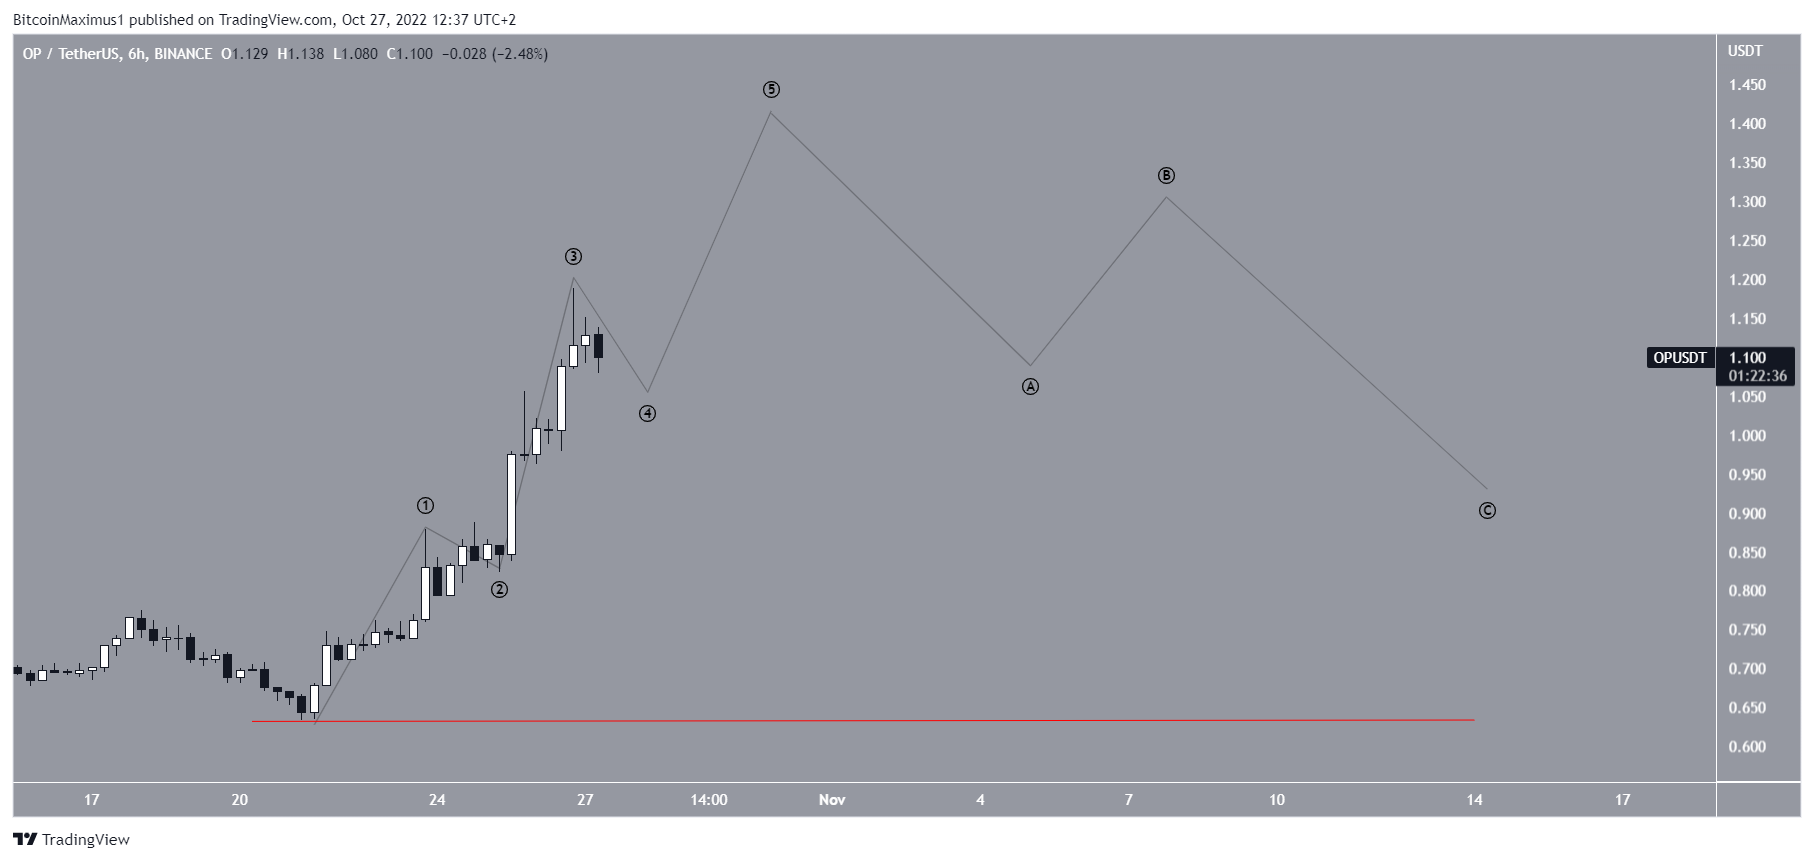
If a new upward movement began on Oct. 23, the Optimism price is currently nearing the end of its short-term increase (black). So, it would make sense for the fifth wave to end close to the $1.42 horizontal resistance area.
Afterward, a corrective period could ensue prior to the continuation of the upward movement.
These are just rough outlines of a potential OP price prediction since the exact values of the future price high are required in order to determine the potential bottom.
Conversely, a decrease below the Oct. 21 low of $0.63 would invalidate the wave count. If that occurs, a new all-time low would be expected.
For the latest BeInCrypto Bitcoin (BTC) and crypto market analysis, click here
Disclaimer: BeInCrypto strives to provide accurate and up-to-date information, but it will not be responsible for any missing facts or inaccurate information. You comply and understand that you should use any of this information at your own risk. Cryptocurrencies are highly volatile financial assets, so research and make your own financial decisions.



