


The Ontology (ONT) price fell to an all-time low on Nov. 14. While it has bounced slightly since, it is facing crucial resistance at $0.20.
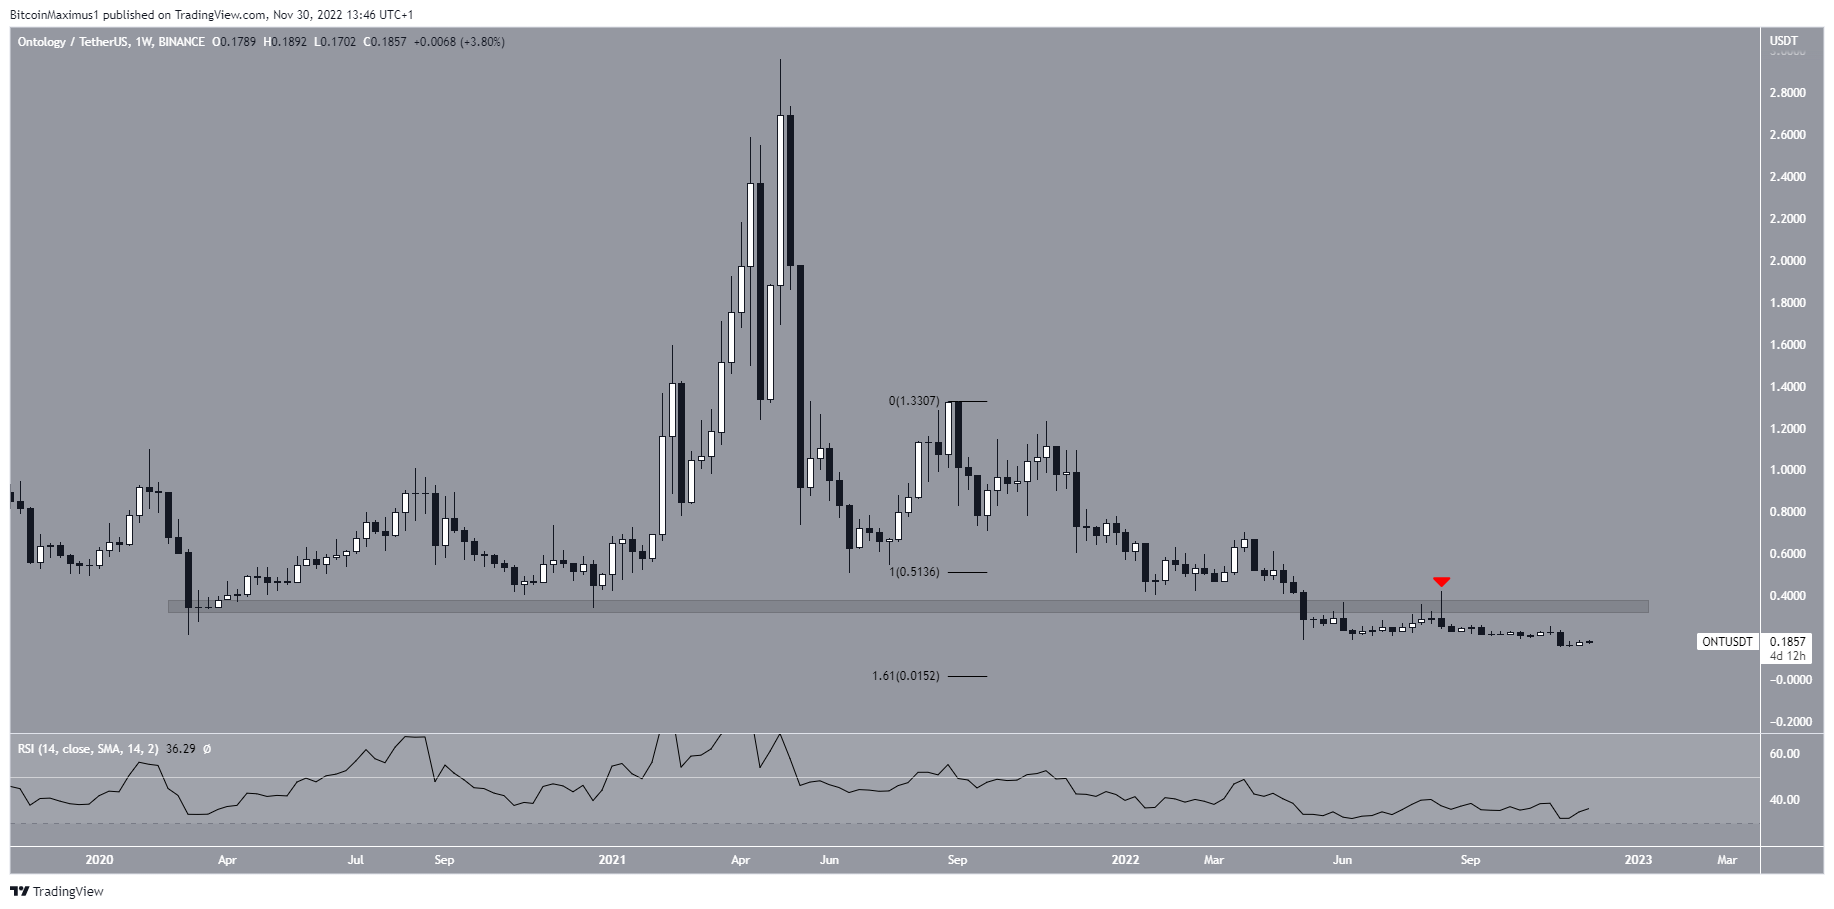
The ONT price has fallen since reaching a high of $2.96 in May 2021. The downward movement led to a new all-time low of $0.15 in Nov. 2022.
The decrease also caused a breakdown below the $0.35 area, which previously acted as the all-time low support. The area has now turned to resistance (red icon).
Technical analysis indicators do not give any bullish signs. This is visible in the weekly RSI, which is decreasing, is below 50 and has not generated any bullish divergence. As a result, the Ontology price prediction is considered bearish.
If the downward movement continues, there could be support at $0.015. This is created by using the 1.61 external Fib retracement on the most recent bounce.
Since the ONT price is trading at an all-time low, the use of Fib levels is required to find potential support levels.
Ontology Price Faces Crucial Resistance
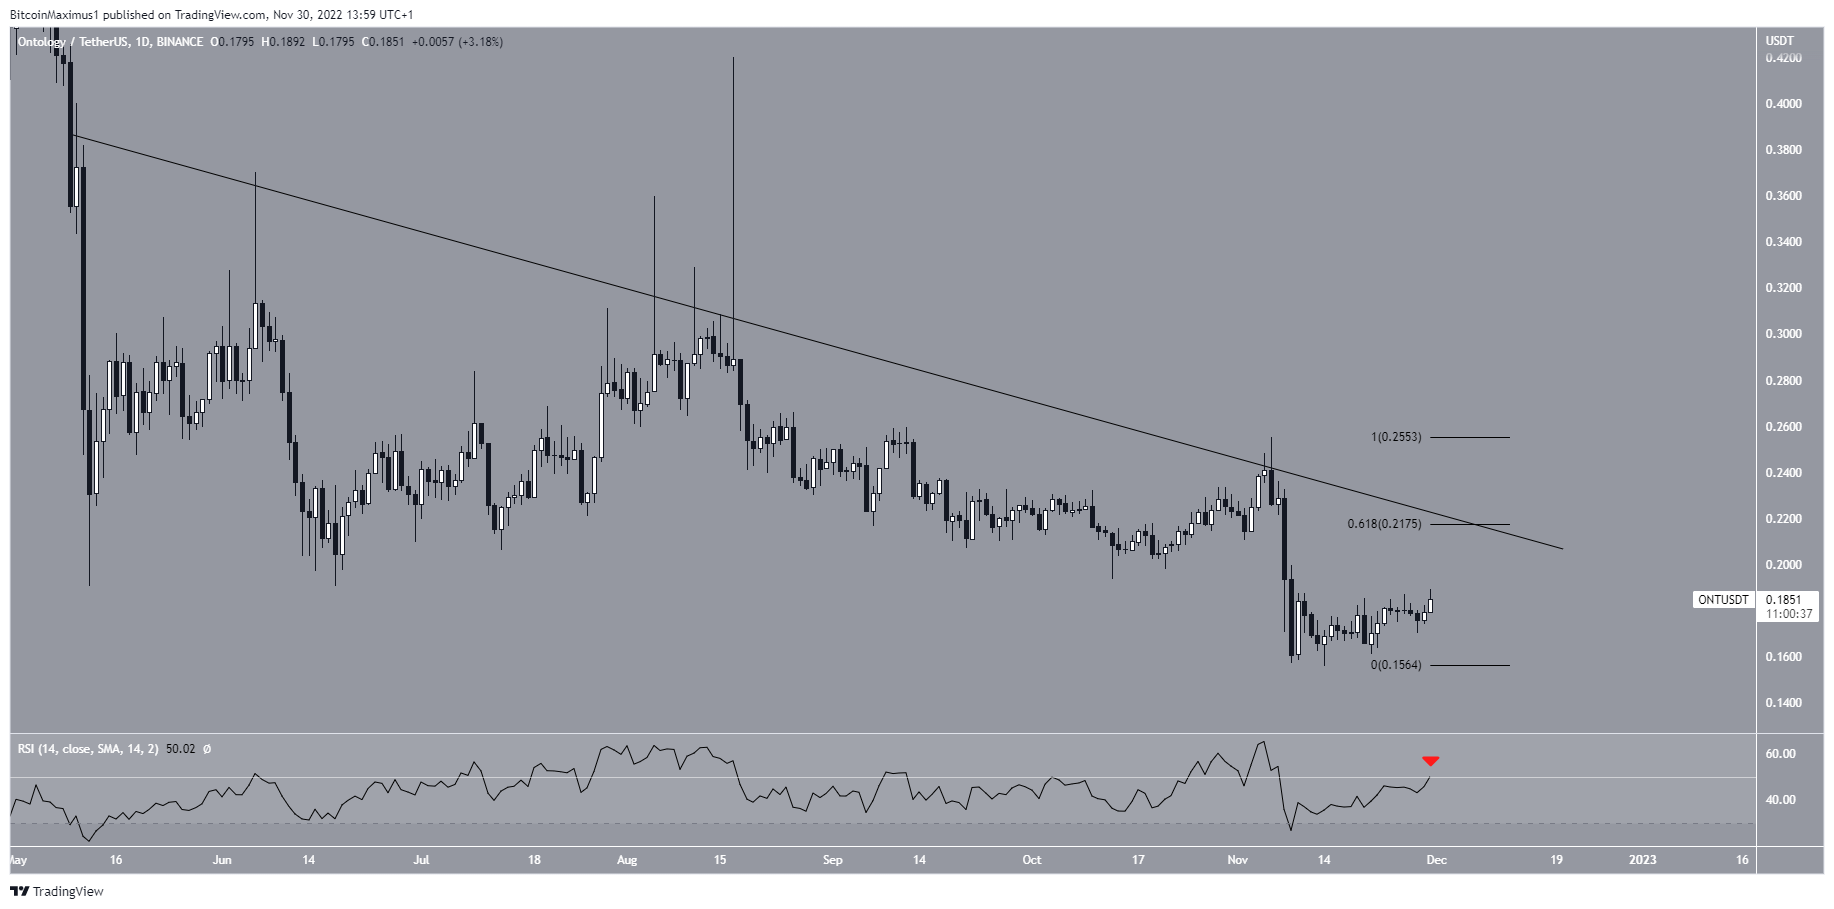
The daily time frame reiterates the bearish outlook from the weekly one.
The Ontology price has been following a descending resistance line since May 15. The line rejected ONT on Nov. 8, beginning the current downward movement.
Moreover, the line now coincides with the 0.618 Fib retracement resistance level at $0.22. This further restates the importance of the $0.20 resistance area.
Finally, the daily RSI is approaching the 50 line from below. So, it is possible that it will get rejected (red icon).
As a result, the Ontology price prediction is considered bearish until the ONT price breaks out above the resistance line.
For BeInCrypto’s latest crypto market analysis, click here.
Disclaimer: BeInCrypto strives to provide accurate and up-to-date news and information, but it will not be responsible for any missing facts or inaccurate information. You comply and understand that you should use any of this information at your own risk. Cryptocurrencies are highly volatile financial assets, so research and make your own financial decisions.


