


Today’s BeInCrypto Bitcoin on-chain analysis looks at three indicators that are currently at key points of the cycle. These indicators are RHODL Ratio, MVRV Z-Score, and NUPL.
Significant similarities in their long-term charts each time point to a period of a mature bull market just before the most expansive part of its uptrend. If the upward structure is maintained, the bull market that began in 2020 can be expected to continue in the coming weeks/months.
RHODL Ratio
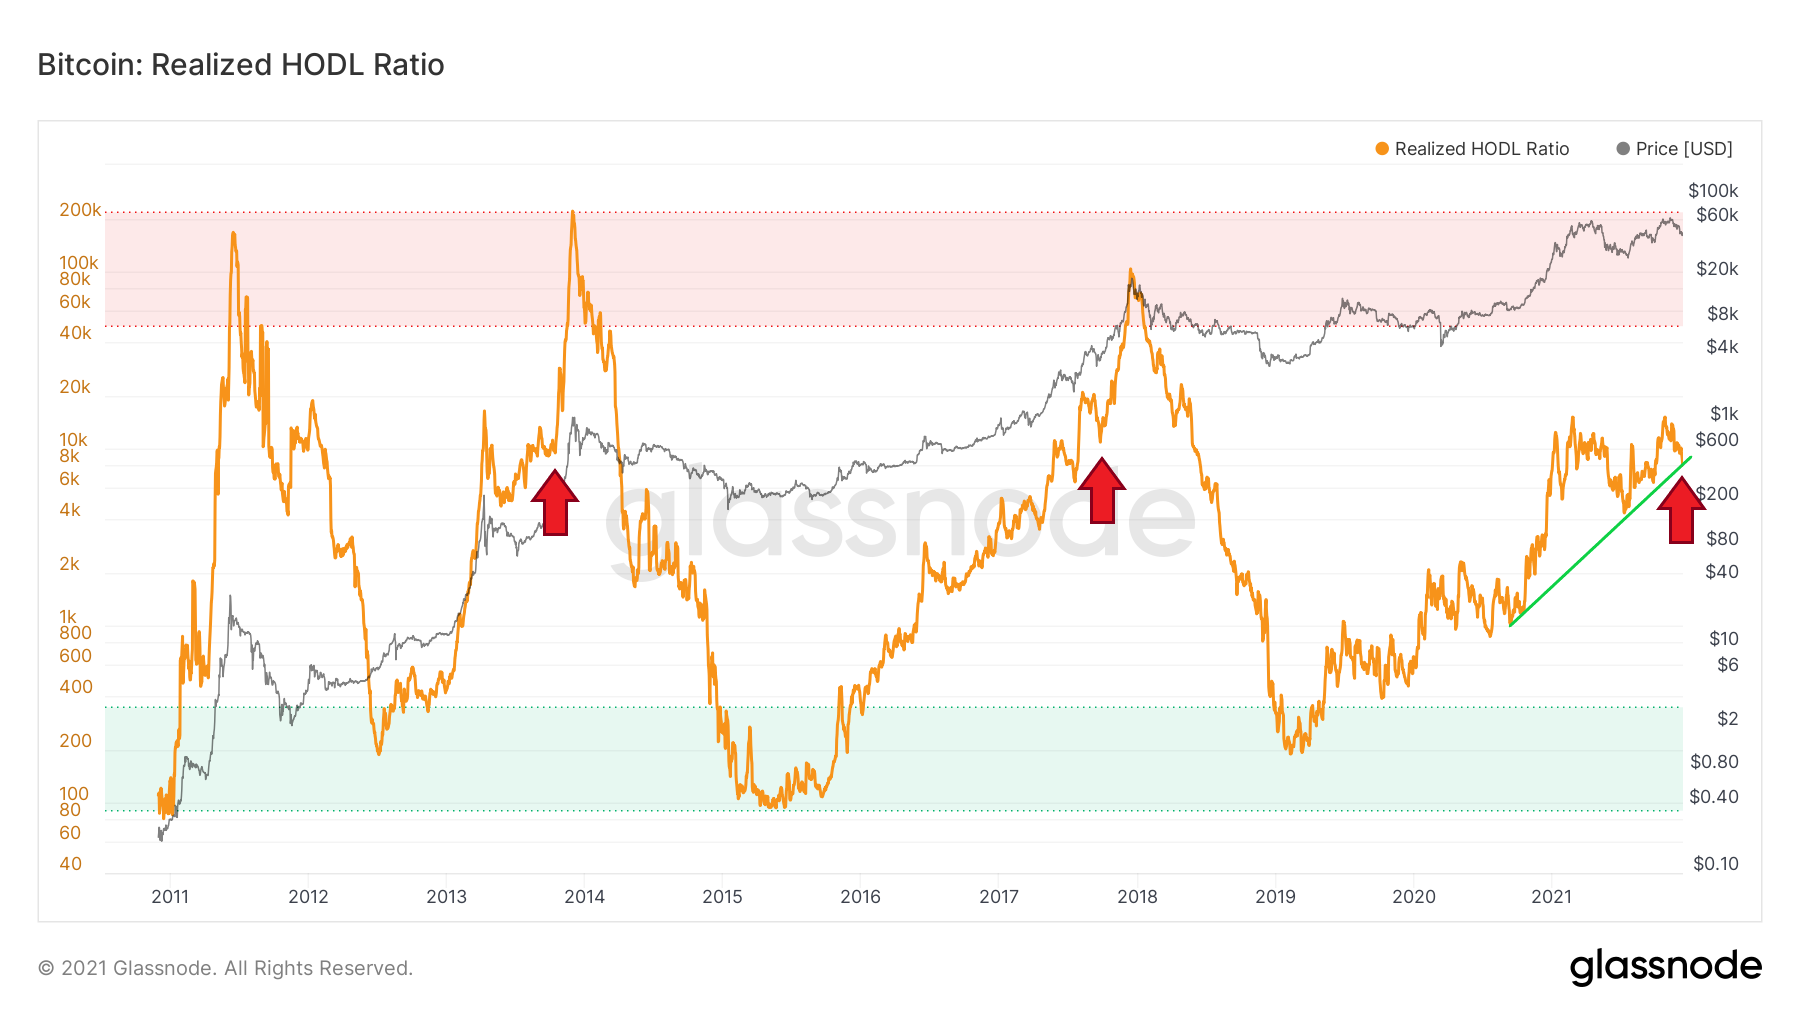
Realized HODL Ratio is a market indicator that is based on the ratio of Realized Cap HODL Waves. Specifically, RHODL Ratio takes the ratio between 1-week and 1-2 year RCap HODL bands. Additionally, it takes into account increased supply by weighting the ratio by the total market age. A high ratio indicates an overheated market and can be used to determine cycle peaks.
Historically, the indicator has peaked in the 50,000-200,000 range (red area) around BTC price peaks in consecutive cycles. These were the best opportunities to sell Bitcoin. In contrast, reaching areas below 350 (blue area) was associated with BTC price bottoms. These were the best opportunities to buy bitcoin.
It is worth noting that the RHODL Ratio has not reached the red area in this cycle. This did not happen either during April’s all-time high (ATH) at $64,800 or during the recent ATH at $69,000. At the same time, the RHODL Ratio did not experience a sharp decline, which historically has been a signal of an incipient bear market.
In contrast, it has recorded a correction but appears to still be following the rising support line (green). The structure of this rise is reminiscent of fractals in previous cycles. Today’s RHODL Ratio values are analogous to October 2013 and September 2017 (red arrows).
MVRV Z-Score
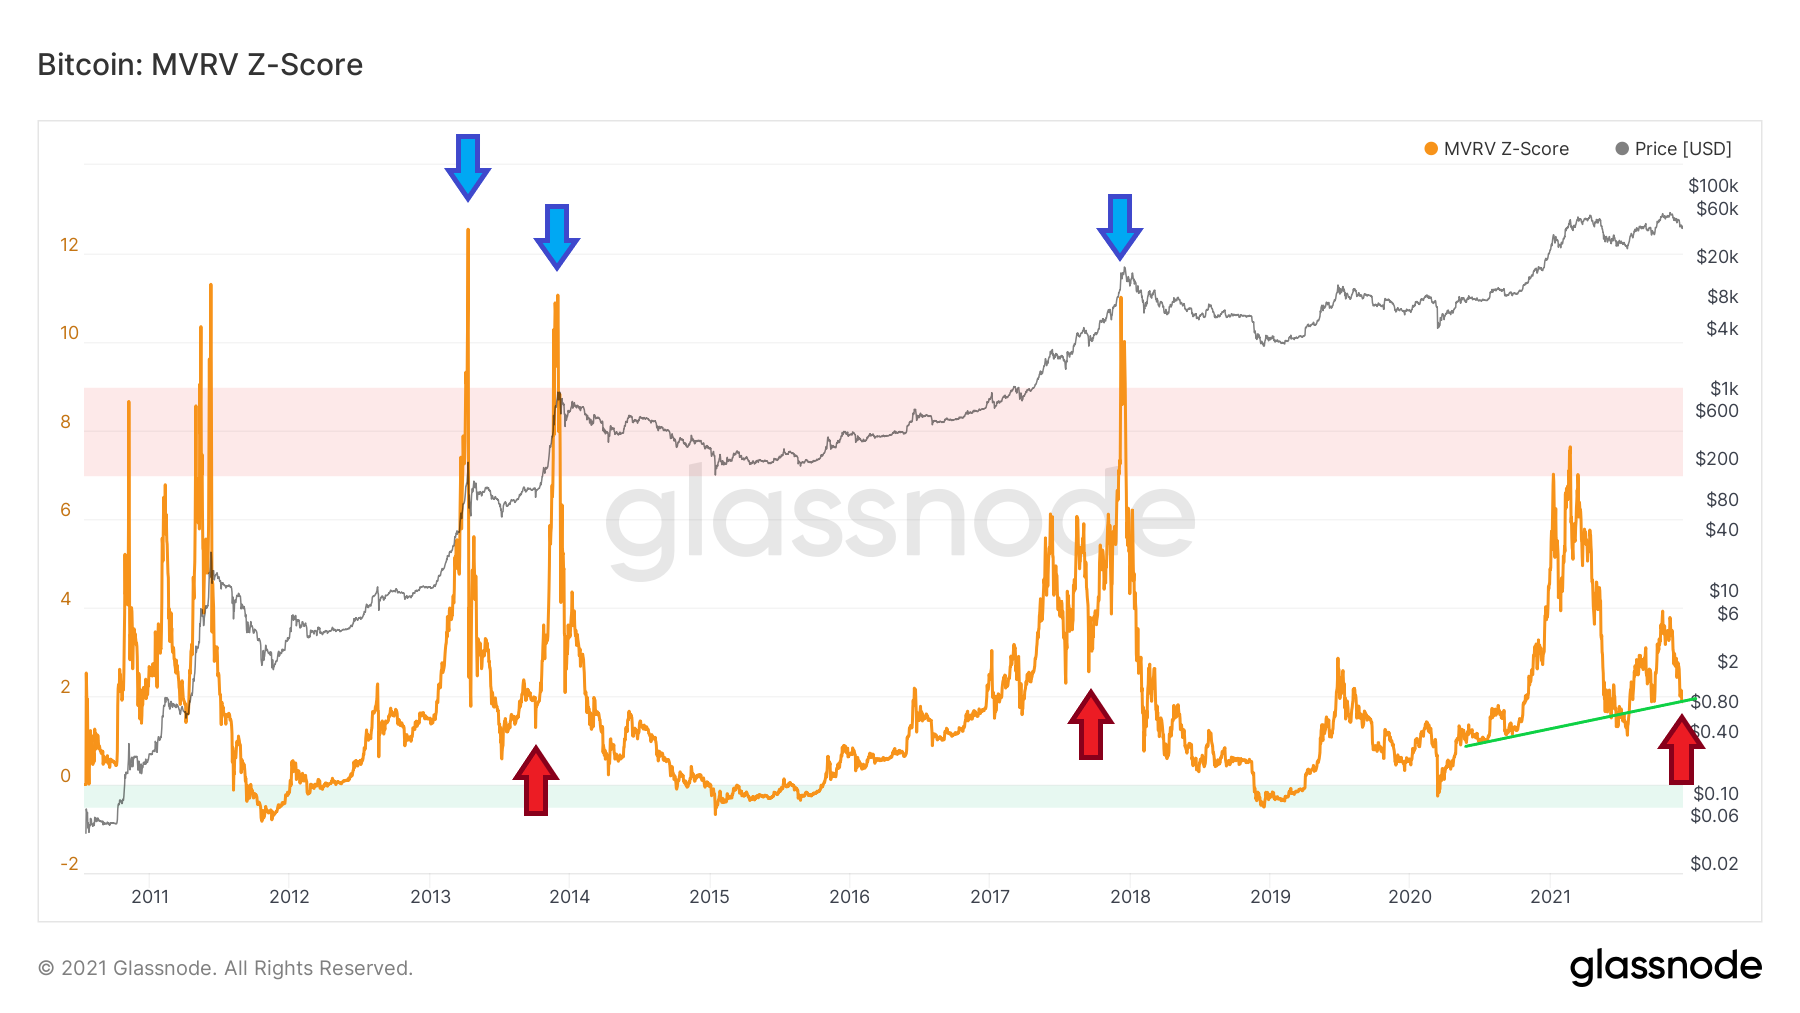
MVRV Z-Score is used to estimate when Bitcoin is overvalued/undervalued relative to its “fair value”. When the market value is significantly higher than the realized value, this historically indicates a market top (red area), while the opposite situation indicates a market bottom (blue area). Technically, the MVRV Z-Score is defined as the ratio of the difference between market cap and realized value and the standard deviation of market cap.
Unlike the RHODL Ratio, Bitcoin’s rally at the start of the year drove the index into the red area in the 7-9 range. However, the peak at 7.63 on February 21 was reached well below peaks in previous cycles. Those peaks were then 12.54 on April 9, 2013, 11.05 on Nov 29, 2013, and 11.01 on Dec 7, 2017 (blue arrows).
Also in the case of the MVRV Z-Score, one can see a rising support line (green) from which a potential bounce could signal a continuation of the bull market. Moreover, similarities can be seen between the current correction and the corresponding periods on Oct 2 2013 and Sept 14, 2017 (red arrows).
NUPL
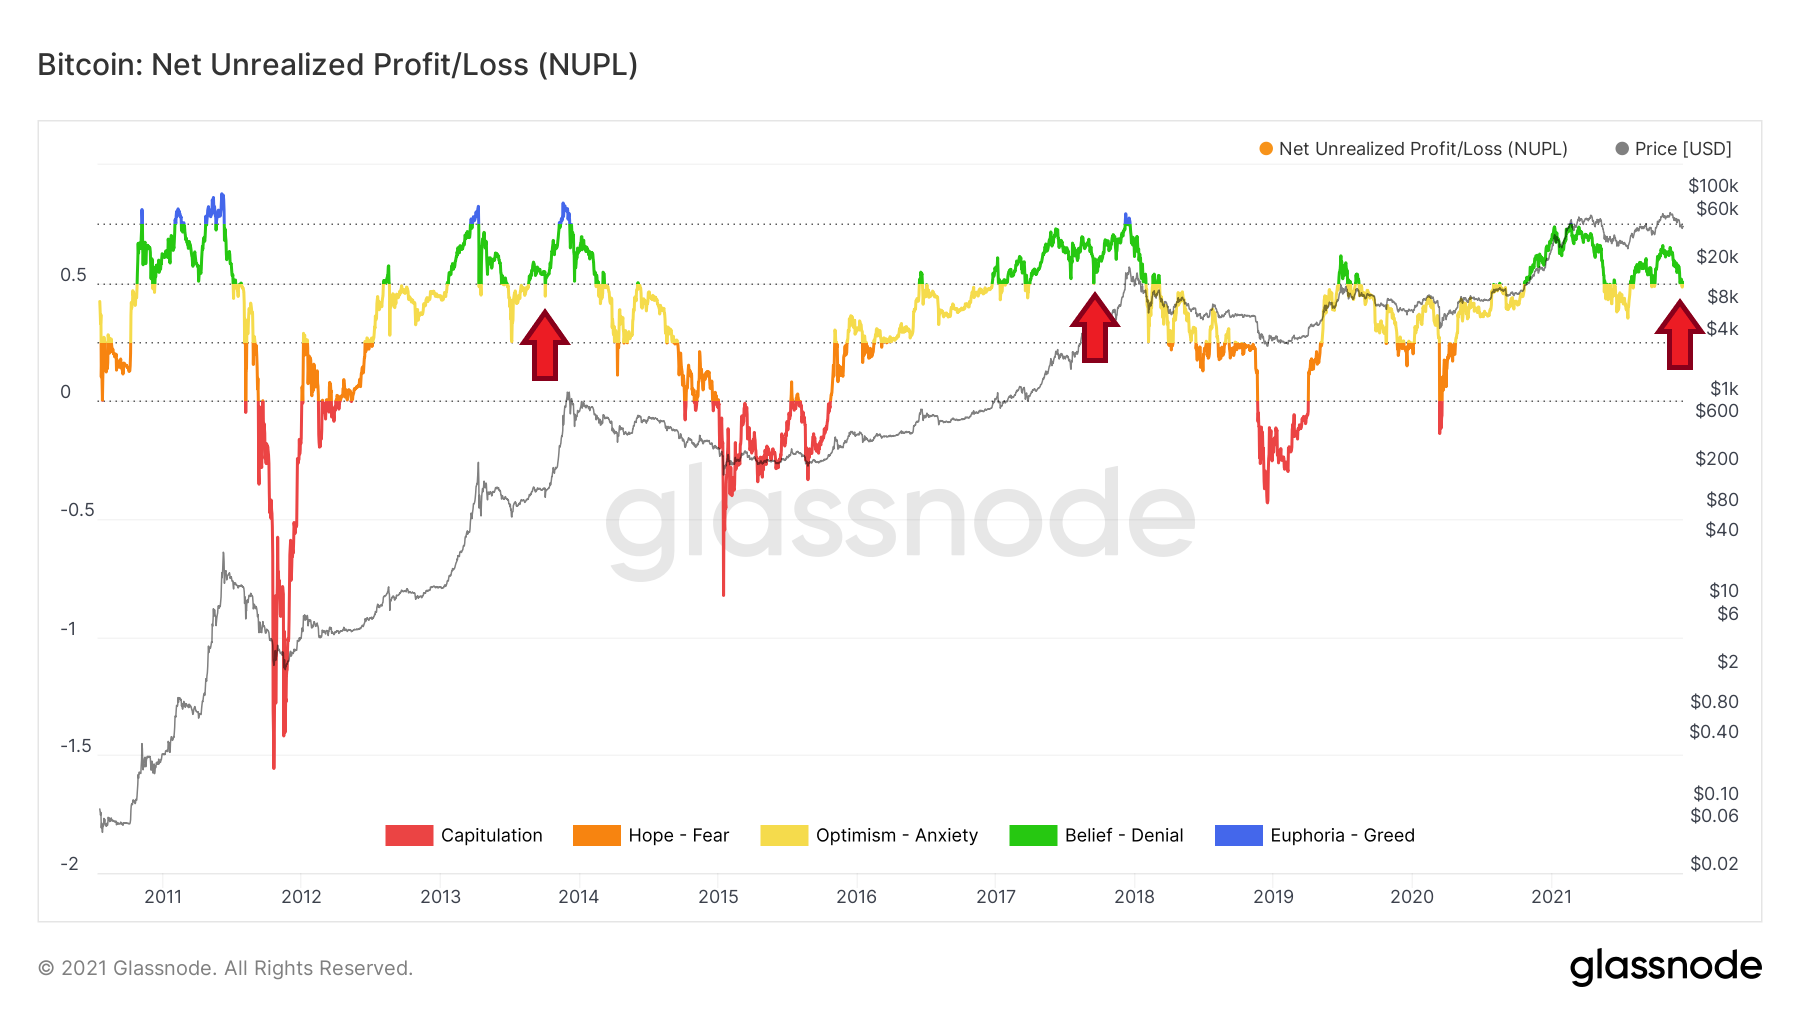
Finally, the third long-term indicator also provides an outlook of a deepening correction within a continuous upward trend. NUPL, or Net Unrealized Profit/Loss, is the difference between Relative Unrealized Profit and Relative Unrealized Loss. This metric can also be calculated by subtracting the realized capitalization from the market capitalization and dividing the result by the market capitalization.
Historically, Bitcoin has reached all macro peaks with the NUPL reading above 0.75. However, the metric peaked at 0.749 on February 21, before falling back and returning to the yellow area in the 0.25-0.5 range over the summer. Similar corrections have been seen in the previous two BTC cycles.
From the point of view of the integrity of Bitcoin’s bull market, a rapid return to the green range above 0.5 seems important. The current structure resembles the analogous periods of previous BTC cycles of Oct 2 2013 and Sept 14, 2017 (red arrows).
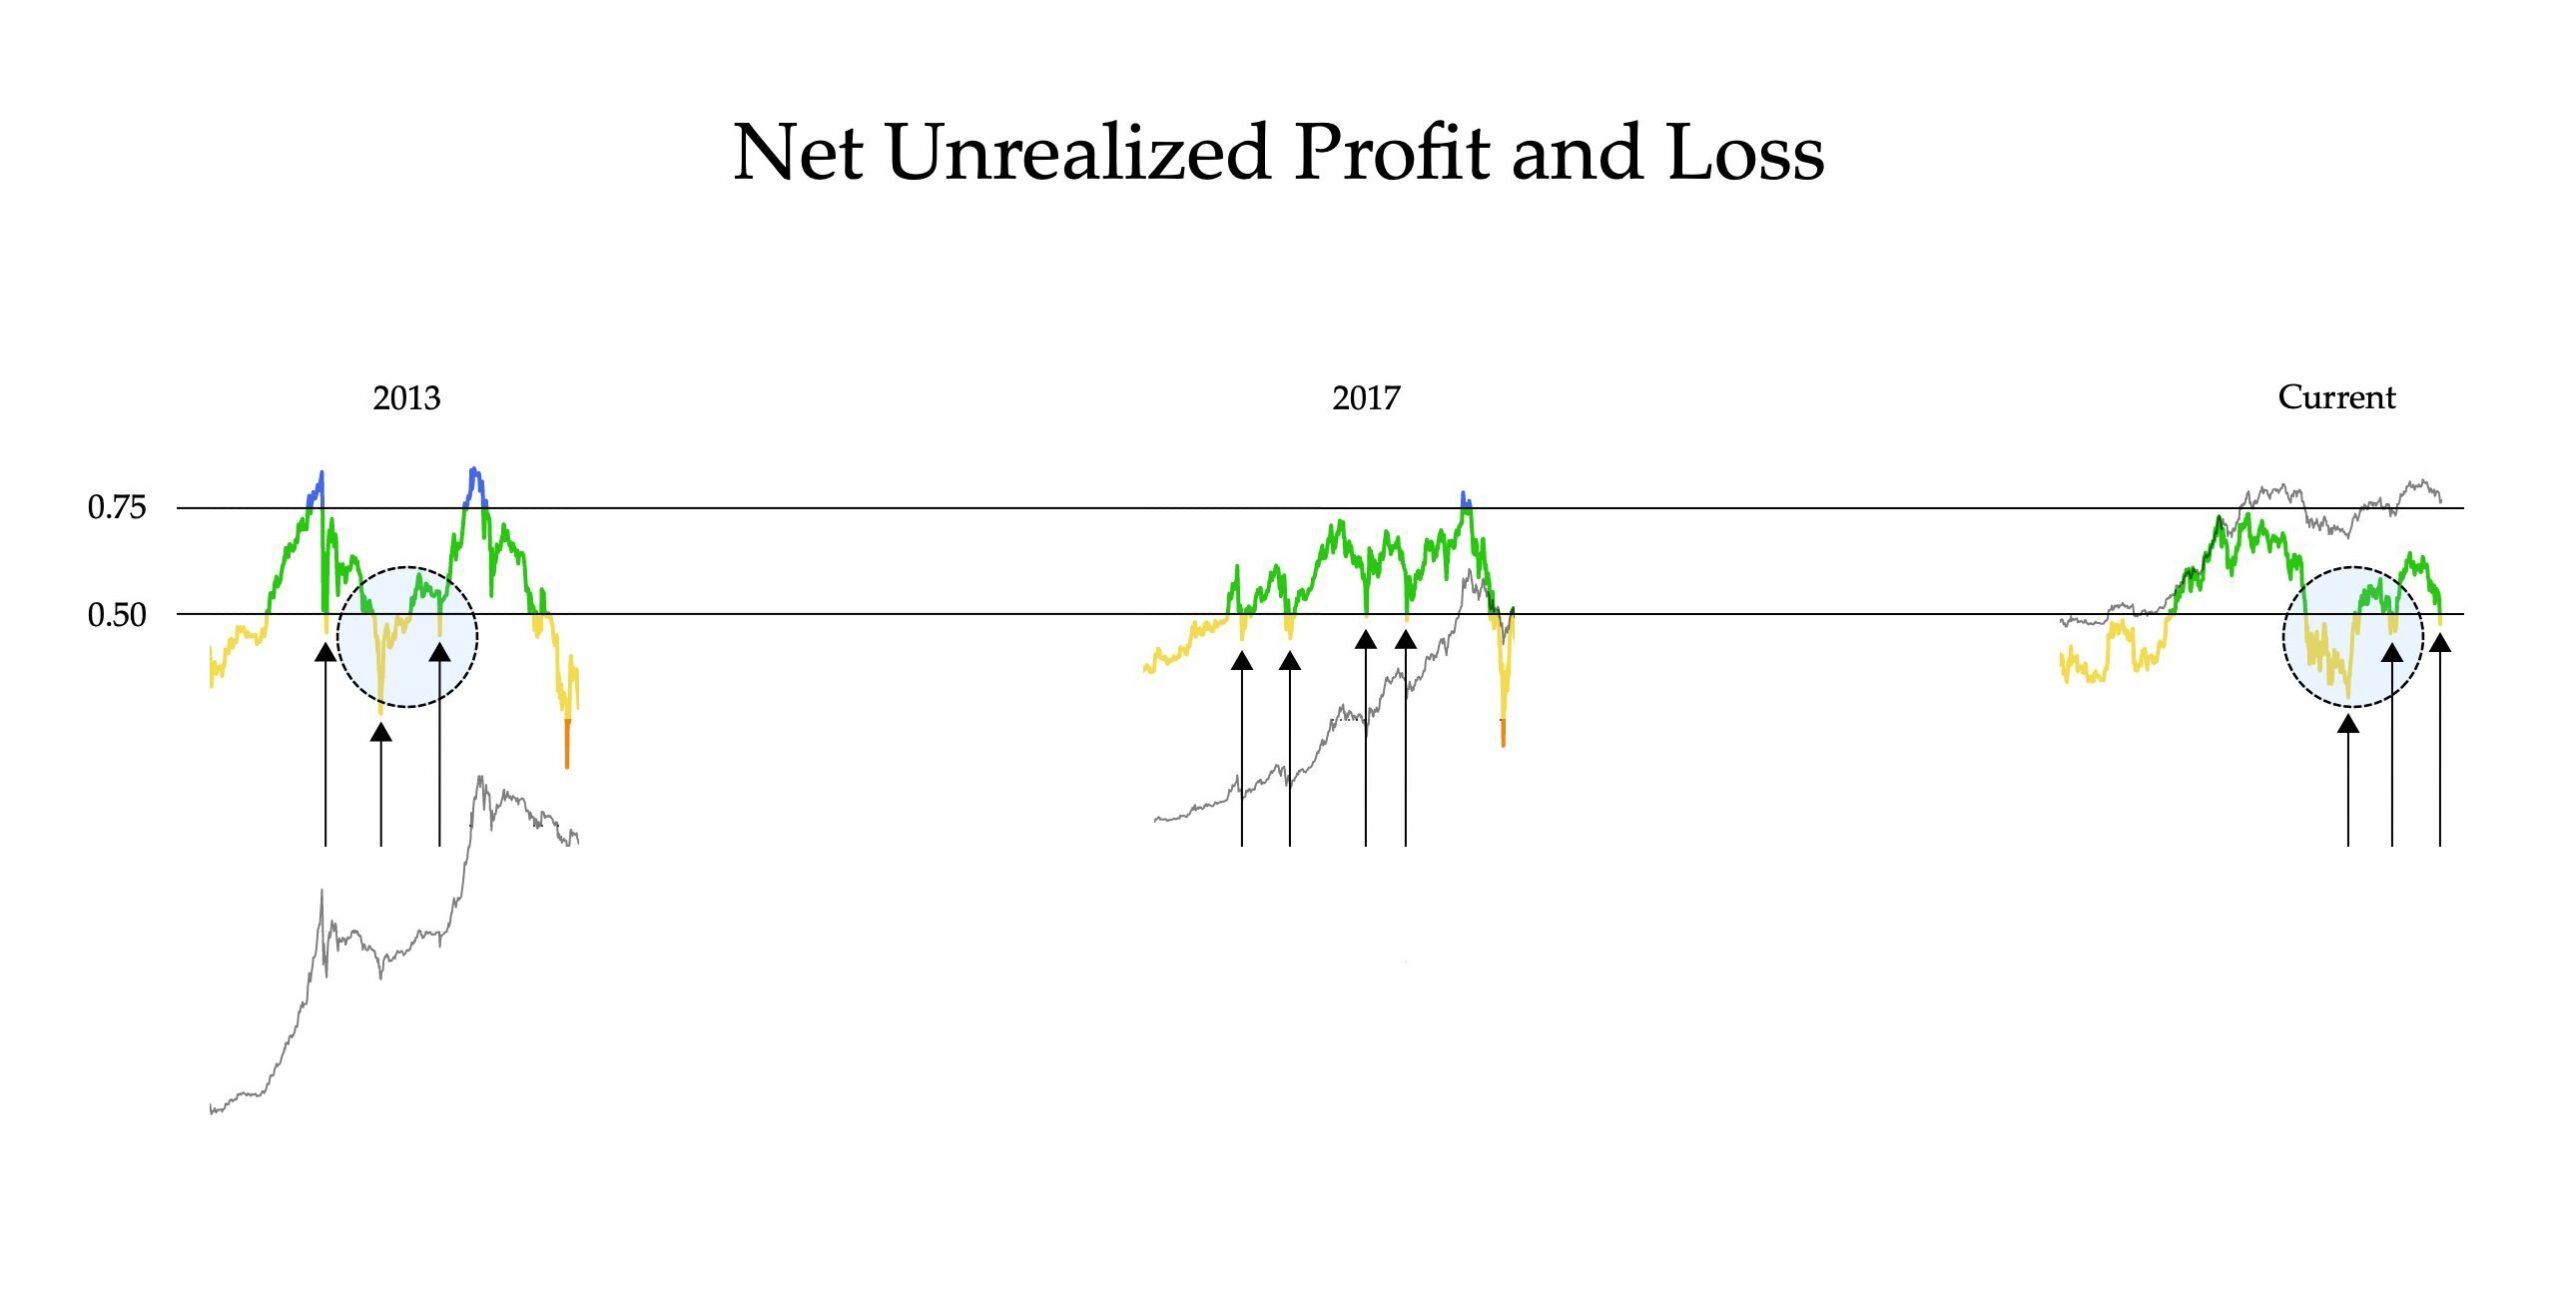
Cryptocurrency analyst @TheRealPlanC recently drew attention to NUPL, tweeting a chart that compares indicator values for three cycles. In his opinion, this is the third reset of this indicator within the ongoing bull market. Additionally, he asked the question: “How many more [resets] do you think we will get, 0,1,2 or 3?”
For BeInCrypto’s latest Bitcoin (BTC) analysis, click here.


