


Stellar (XLM) broke above a nine-month descending triangle on April 16. The move cleared resistance that had capped price since the July 2025 high near $0.50.
XLM trades near $0.18 after climbing more than 13% over the past seven days. The breakout coincides with the Protocol 26 Yardstick testnet launch, adding a fundamental tailwind to the technical setup.
XLM Daily Chart Confirms Triangle Breakout
The XLM daily chart shows a clean descending triangle formation. It stretches from the July 18, 2025 high to the $0.17 support established on February 6, 2026.
The pattern carried a flat floor near $0.17 and a descending resistance line above. That trendline rejected every rally for nine months before April 16.
On that date, price closed above the descending trendline (blue circle). The move produced the first confirmed breakout of the structure.
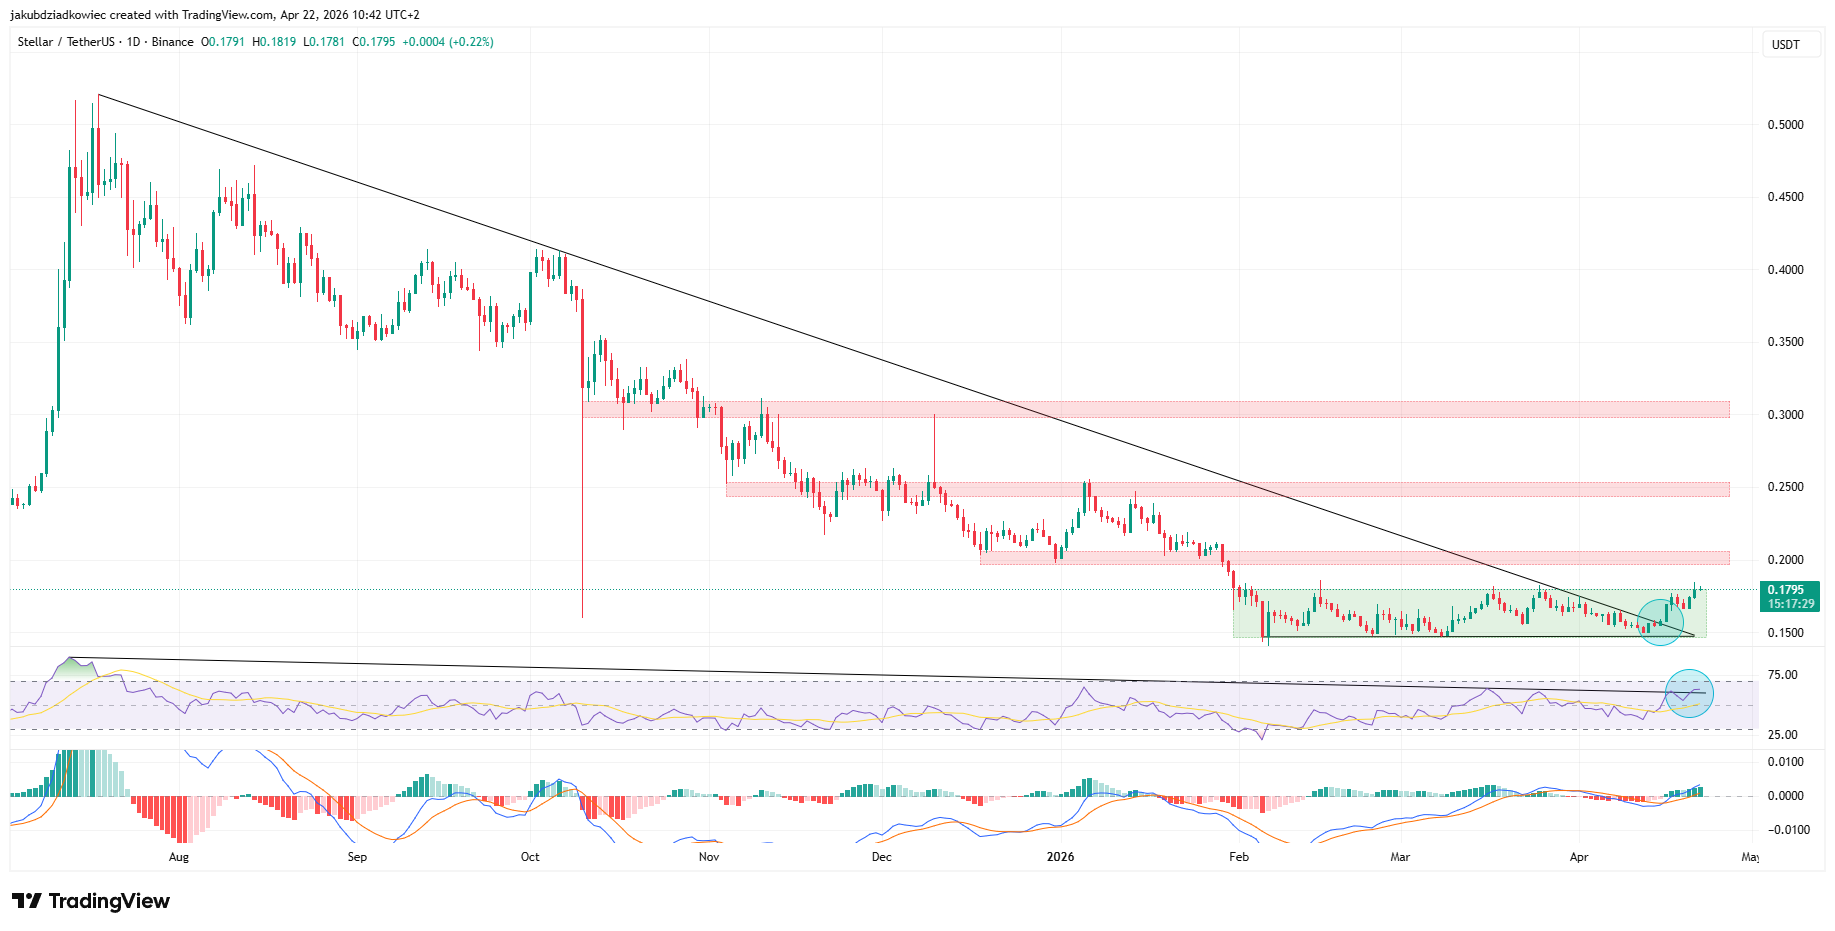
The Relative Strength Index (RSI) mirrored that move by breaking its own falling trendline. Therefore, traders see a bullish divergence signal that often accompanies price breakouts.
Meanwhile, the Moving Average Convergence Divergence (MACD) histogram continues to expand in positive territory. Momentum favors the bulls on the higher timeframe.
Three resistance zones now sit above spot. The first band caps action near $0.20, the second near $0.25, and the third near $0.30.
A close above $0.30 would complete the measured move from the triangle. Such a result would validate the wider reversal thesis.
Furthermore, Stellar entered the Protocol 26 Yardstick testnet on April 16. That launch landed on the same day as the technical breakout, with a mainnet vote scheduled for May 6.
4-Hour Chart Flags Near-Term Caution
The shorter timeframe tells a more cautious story. On the 4-hour chart, XLM trades inside a horizontal parallel channel.
The upper band sits at $0.18 and the lower band at $0.15. A dashed midline near $0.165 has alternated between support and resistance.
Price currently tests the top of that channel. In addition, it has respected the boundaries with precision across the past two months.
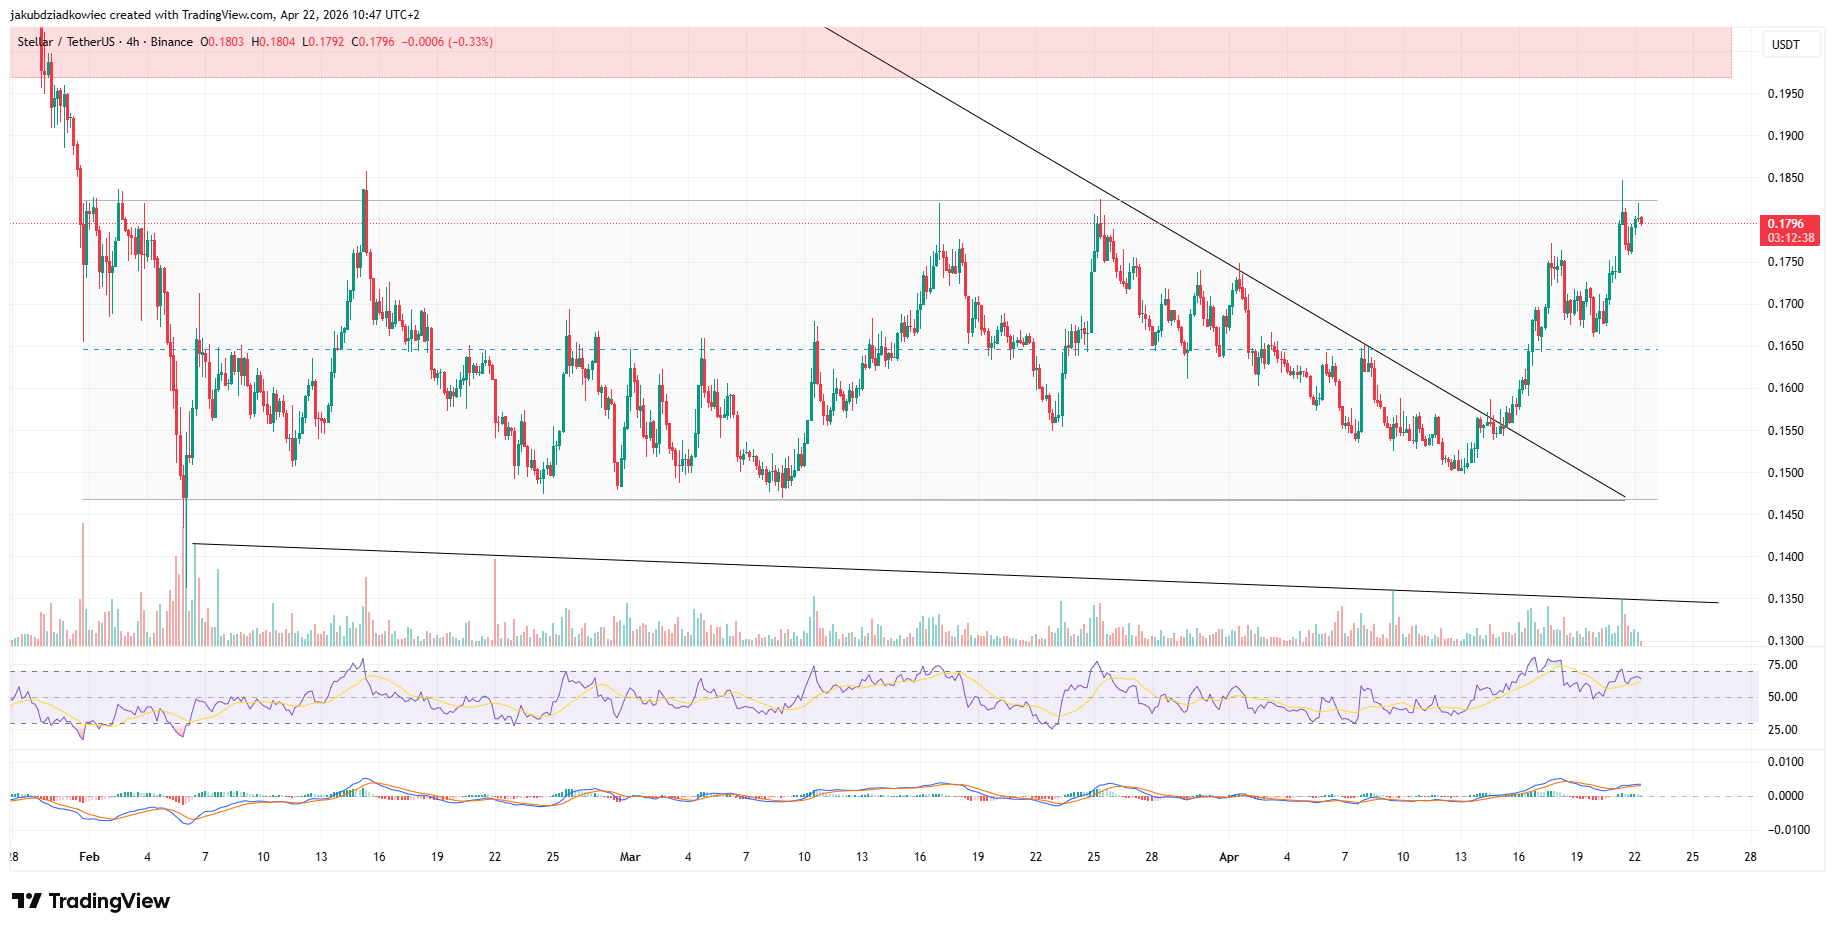
Volume, however, has contracted through the recent advance. The April 15 push above the channel lacked buying participation.
Therefore, follow-through now depends on fresh demand stepping in. A sustained move above $0.18 would open the path to $0.20.
The 4-hour RSI remains in bullish territory. Yet it has printed the first signs of bearish divergence, with higher price highs meeting lower indicator highs.
Meanwhile, MACD on this timeframe sits near the zero line. The indicator offers no directional conviction and keeps the short-term setup balanced.
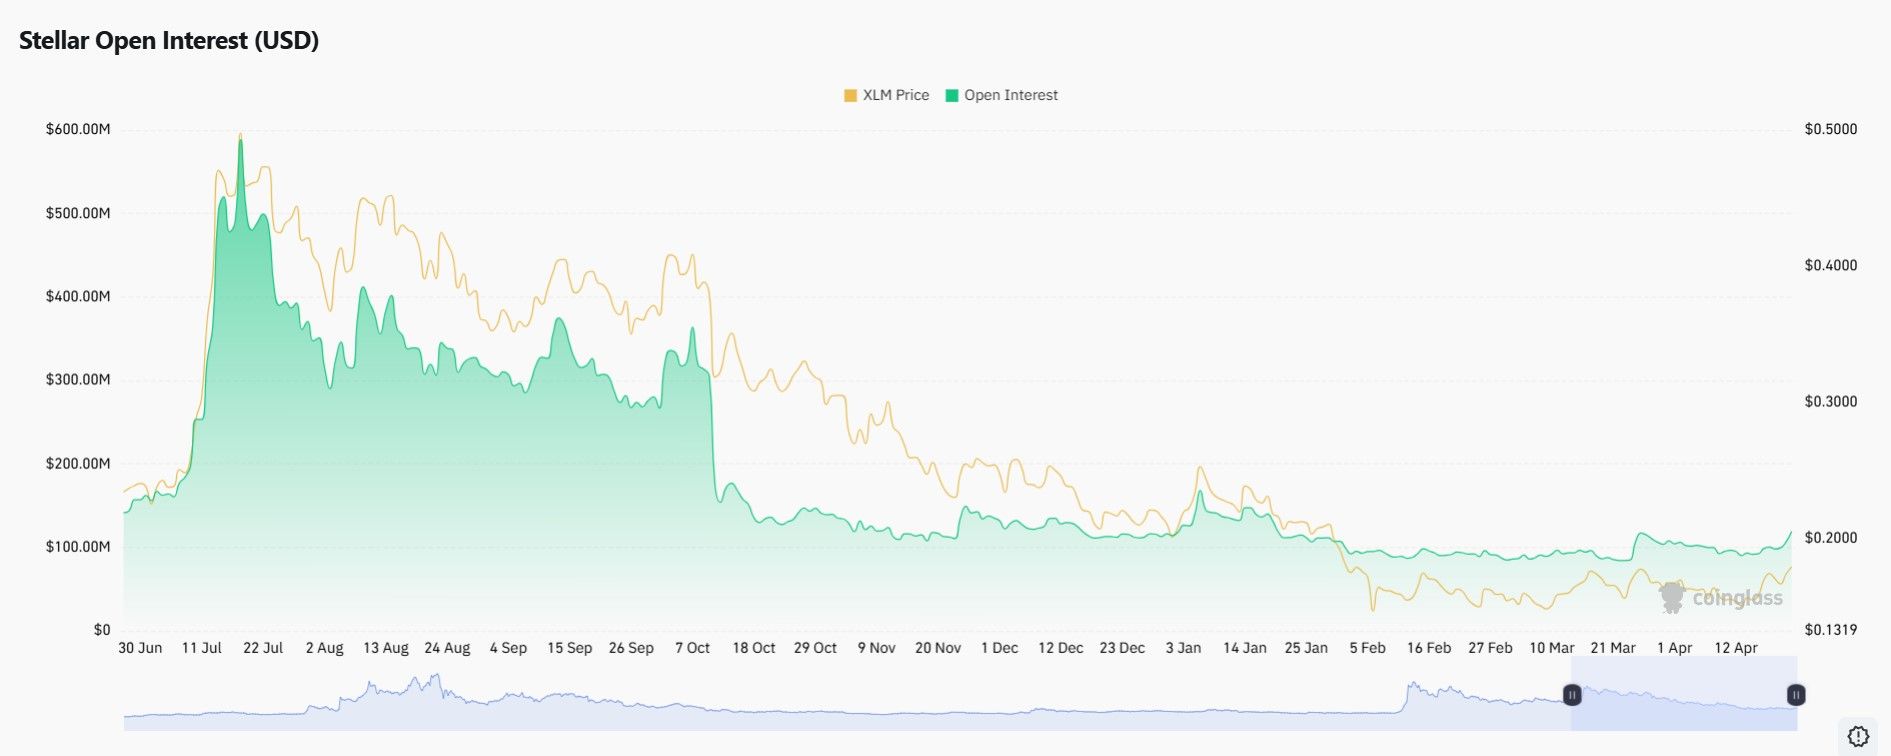
Stellar Open Interest Signals No Overheating
Futures open interest on XLM tells a supporting story. The reading peaked near $600 million in July 2025 before declining through the back half of the year.
Historically, open interest flattened around $100 million through the first quarter of 2026. It has only recently turned higher alongside the April price advance.
The current uptick remains modest by the standards of last summer. Leverage has not reset to the levels that preceded the July 2025 top.
Therefore, the lack of froth reduces the risk of a long squeeze derailing the breakout. Healthy participation returns without excess.
The bull case rests on three pillars. A multi-month pattern break, confirmation from daily momentum, and a supportive fundamental calendar frame the thesis.
Ultimately, a sustained move above $0.20 on rising volume would open the path toward $0.25. A close above $0.30 would complete the longer-term forecast on the daily chart.
Conversely, a failure to hold the breakout and a close back below $0.17 would invalidate the setup. Such a move would return Stellar to the accumulation zone.


