


BeInCrypto takes a look at Bitcoin on-chain indicators, specifically the Spent Output Profit Ratio (SOPR), RHODL Ratio, and Stock-To-Flow (STF) deflection model.
Bitcoin SOPR
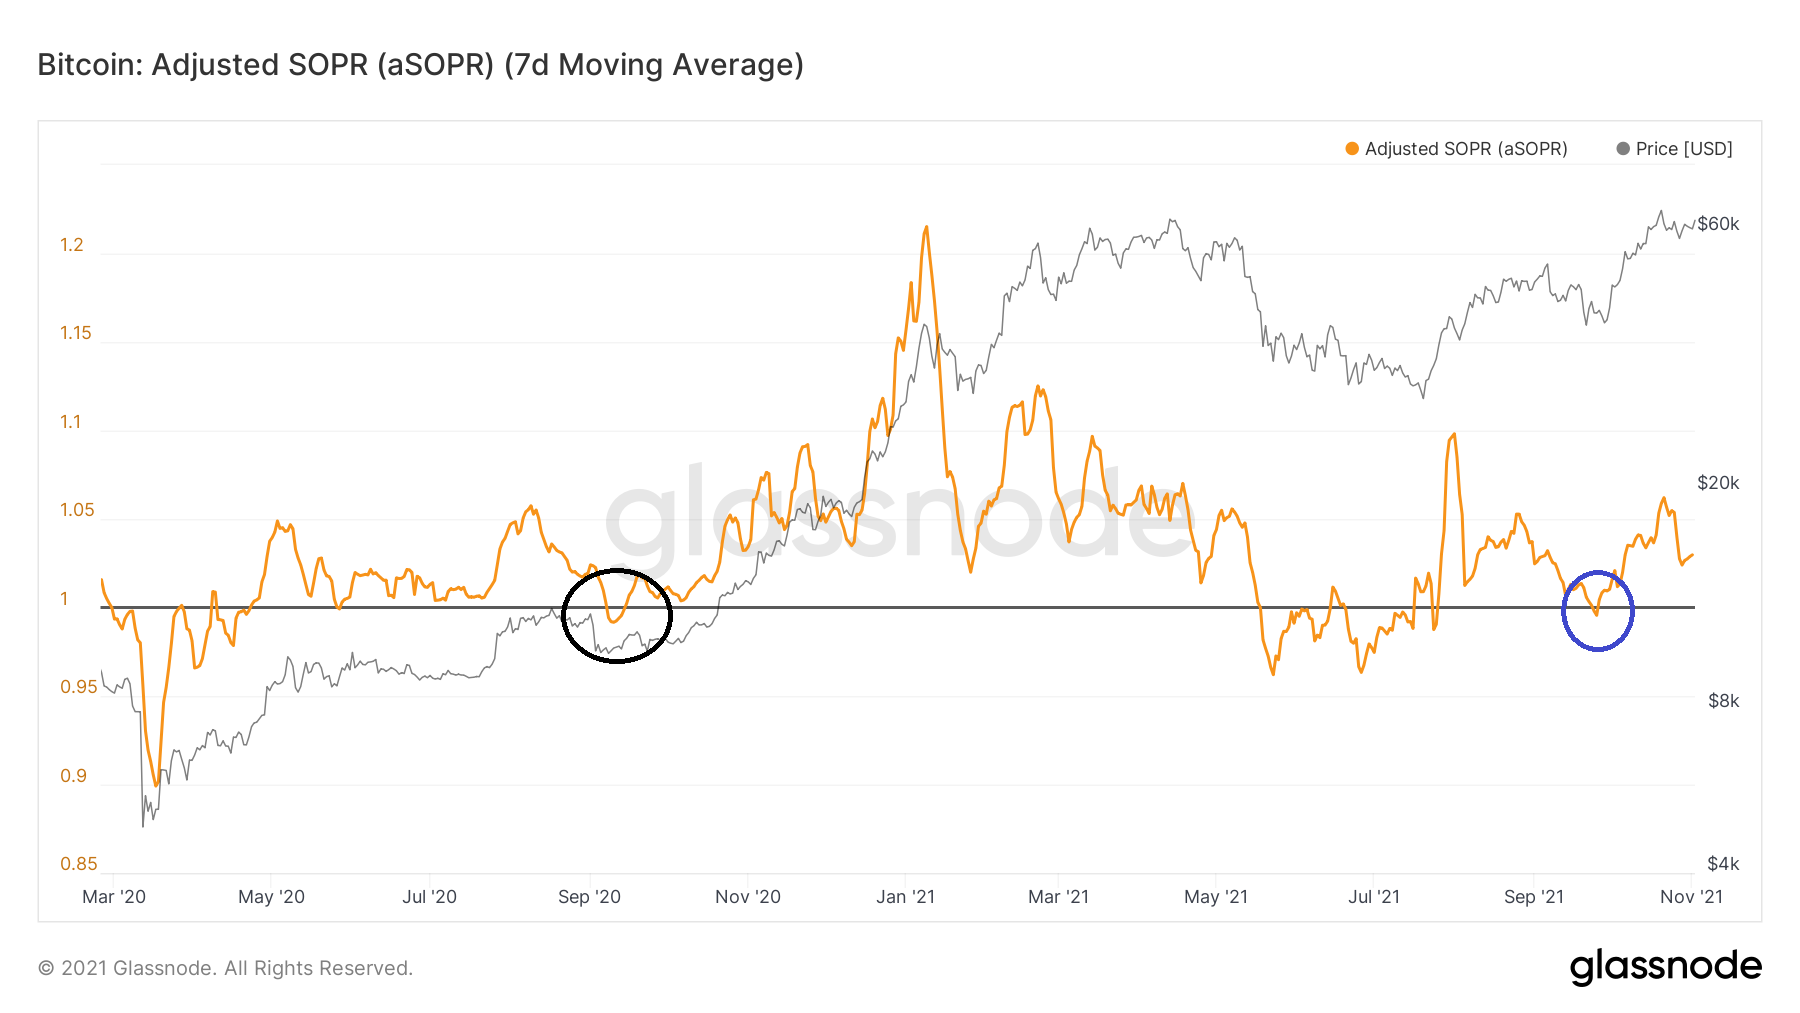
SOPR is an on-chain indicator that shows if the market is in a state of profit or loss. Readings above one (black line) show that the market is in aggregate profit, while those below one show aggregate loss.
SOPR fell below one for the entire period between May-July. However, the ongoing BTC increase has taken the indicator back into profit.
More importantly, SOPR bounced at the one-line in September (blue circle) and has been increasing since.
Previously, such bounces (black circle) have been the catalyst for considerable upward movements.
This might occur due to a fake sell-out, in which weak hands are forced out of the market prior to the resumption of the upward trend.
RHODL Ratio
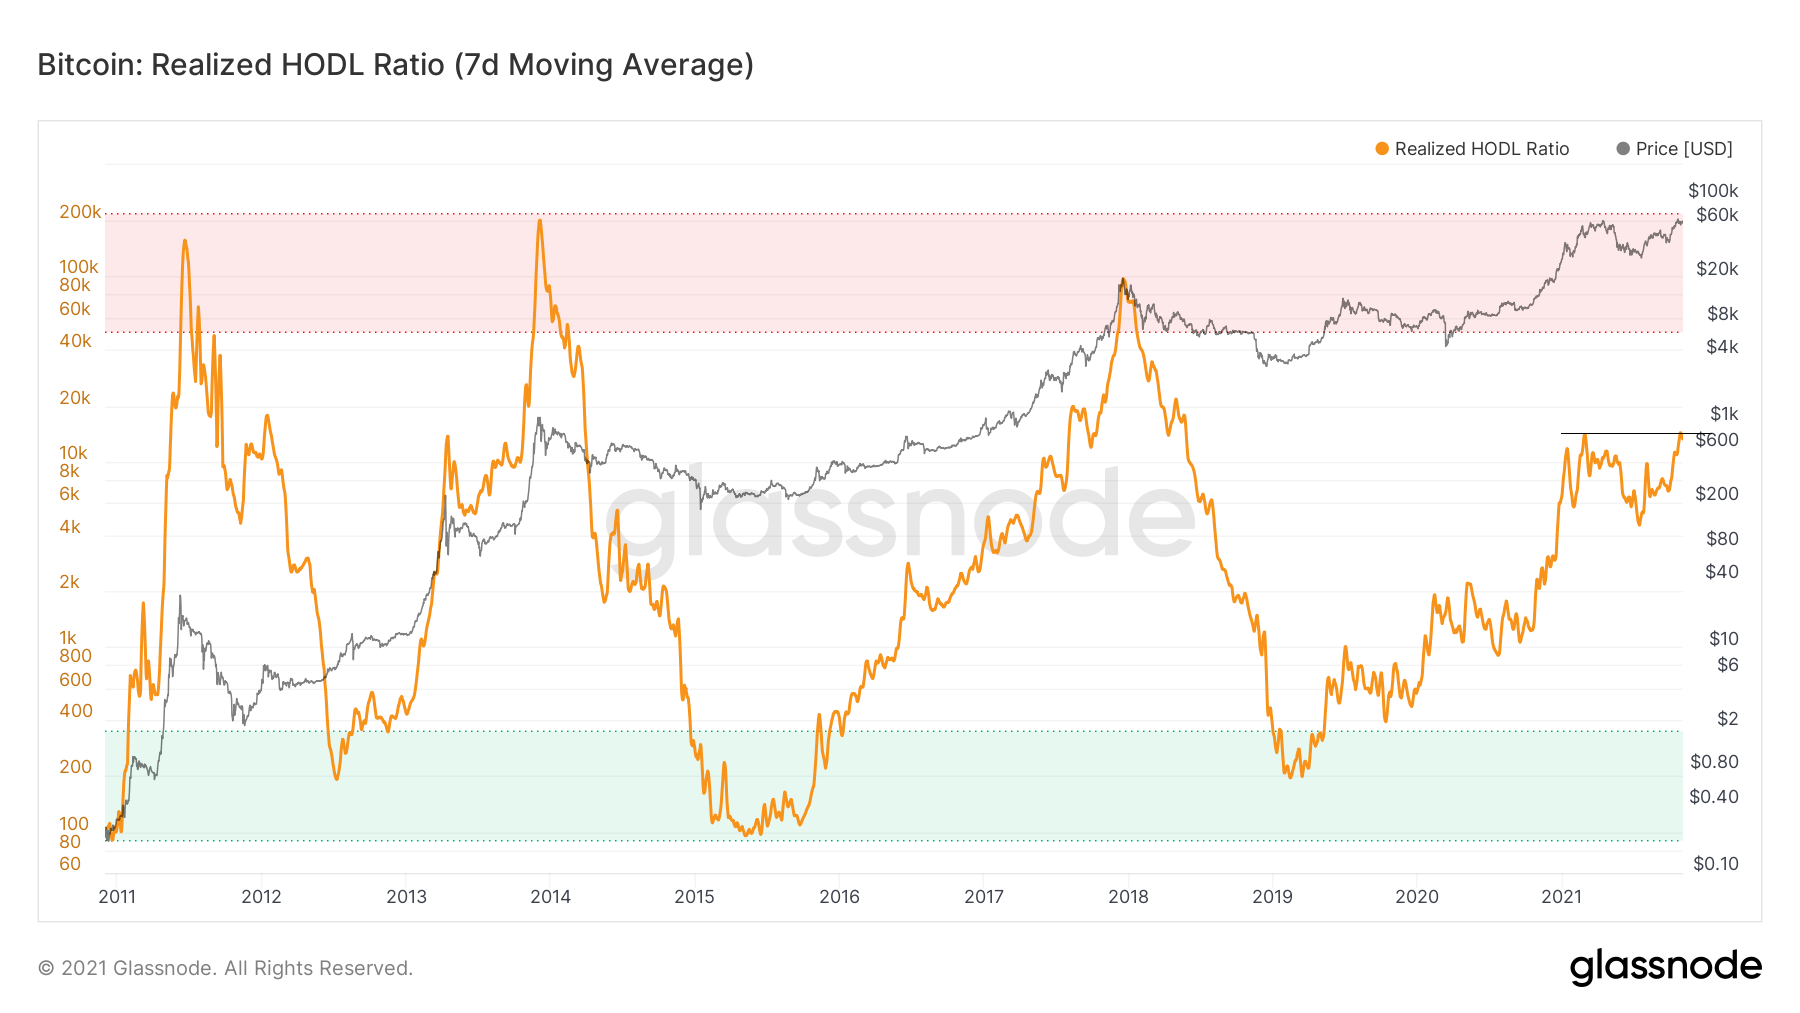
The RHODL ratio is an indicator created by taking the ratio between the 1-week and the 1-2 year HODL Wave bands. Values above 50,000 (highlighted in red) suggest that a significant percentage of the BTC supply is held by short-term holders. Historically, these values have coincided with market tops — which was the case at the 2013 and 2017 peaks.
The previous yearly high in 2021 transpired in February with a value of 13,812. This was considerably below the overbought region. RHODL has now moved above its February highs, increasing above 14,000.
However, when compared to the previous market cycles, it still has ample room to grow until it reaches the overbought territory.
Stock-to-Flow (STF) model
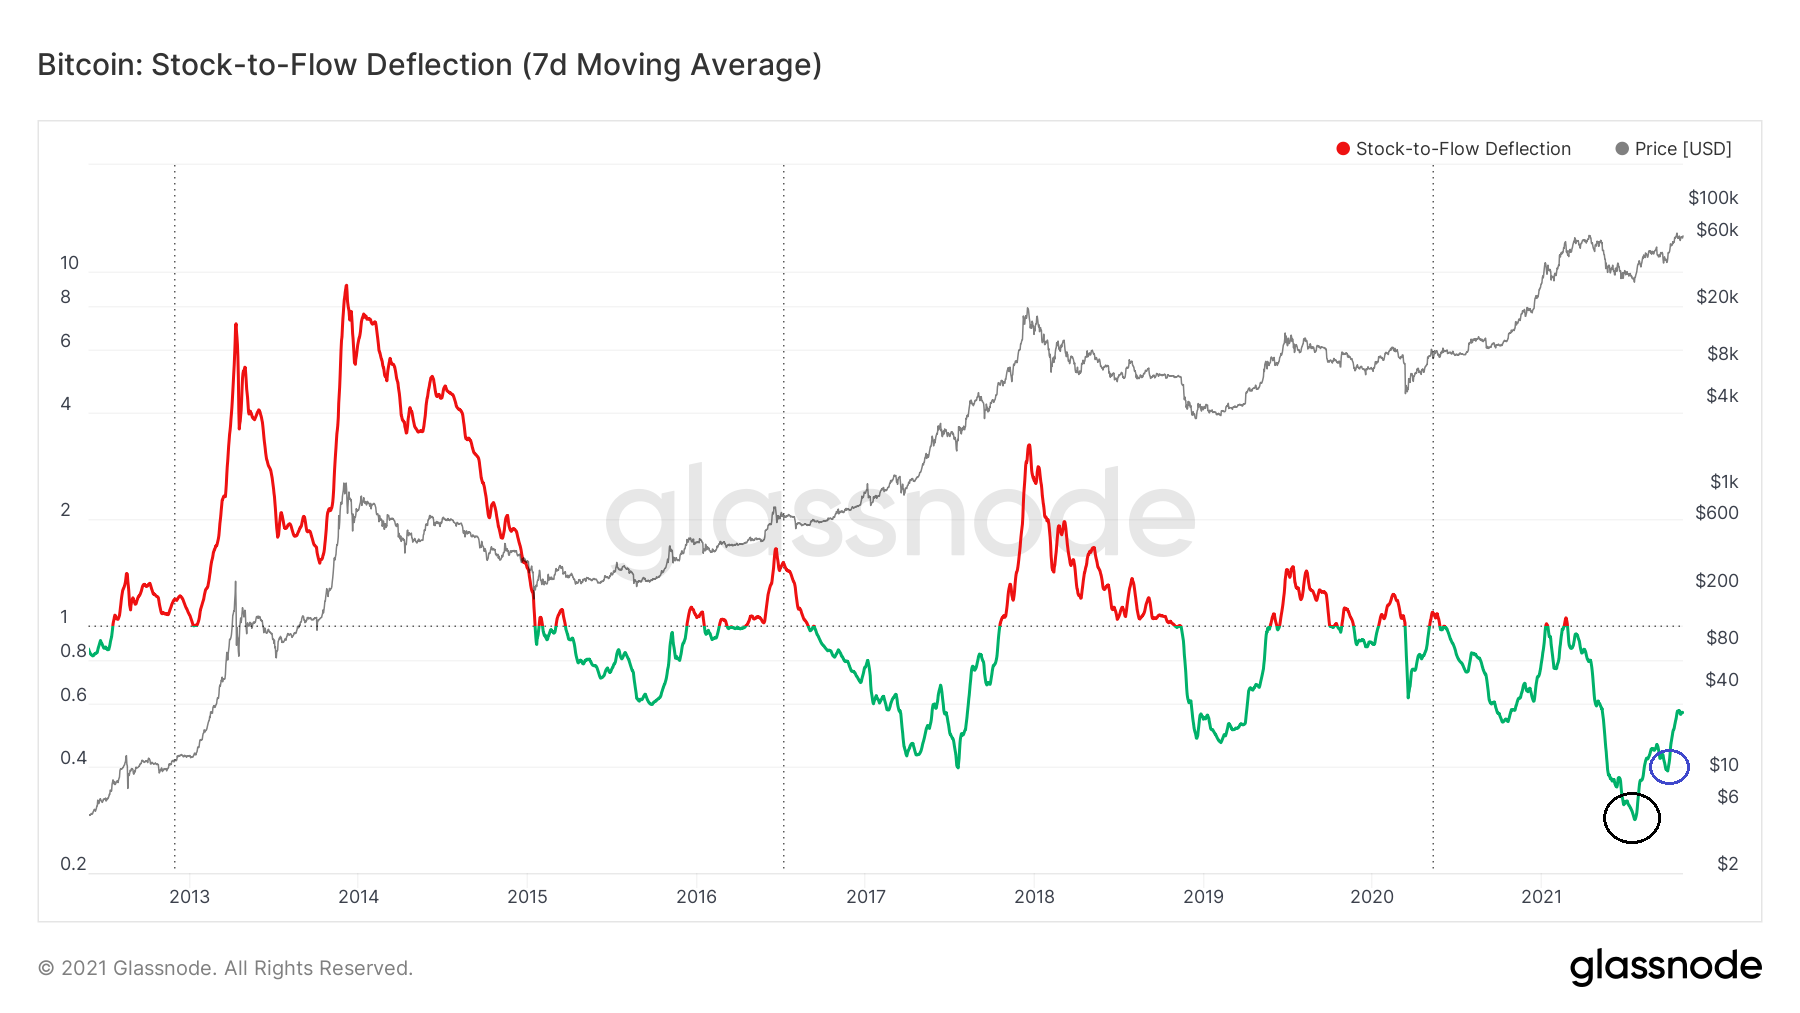
The STF deflection measures the difference between the STF model and the price of bitcoin (BTC).
Values higher than one (denoted by the red line) suggest that relative to the model, BTC is overvalued. On the other hand, values lower than one (denoted by the green line) show undervaluation.
The indicator gives values in the form of a ratio. So, a value of 0.5 means that the BTC price is 0.5 times the price predicted by the model, while a value of 1.5 means that the price is 1.5 times that given by the model.
In July (black circle) the indicator gave a value of 0.314, which was the lowest in ten years. This was a sign of extreme undervaluation relative to the model. Afterward, the STF bounced on Oct 2 (blue circle) and has been increasing since.
The current value of 0.6 still shows that BTC is undervalued, despite the considerable increase.
Historically, values above 1 have coincided with local and cycle tops.
For BeInCrypto’s latest Bitcoin (BTC) analysis, click here.


