

The OMG Network price has reclaimed a minor resistance level and is in the process of making an attempt at breaking out above a long-term resistance at $6.50.
Due to OMG Network reclaiming the minor resistance area and the bullishness from technical indicators, it’s likely that the breakout will be successful.
OMG Network Long-Term Levels
The weekly chart shows that OMG is trading just below the long-term $6.50 resistance area, which has been in place since OMG broke down in April 2018. The same area rejected the price during the attempt at an upward movement in August 2020.
Despite the rejection, OMG is in the process of making another attempt, which is also supported by the bullish readings from technical indicators.
If successful in breaking above, the next closest resistance areas would be found at $11.75 and $15.28.

Current Movement
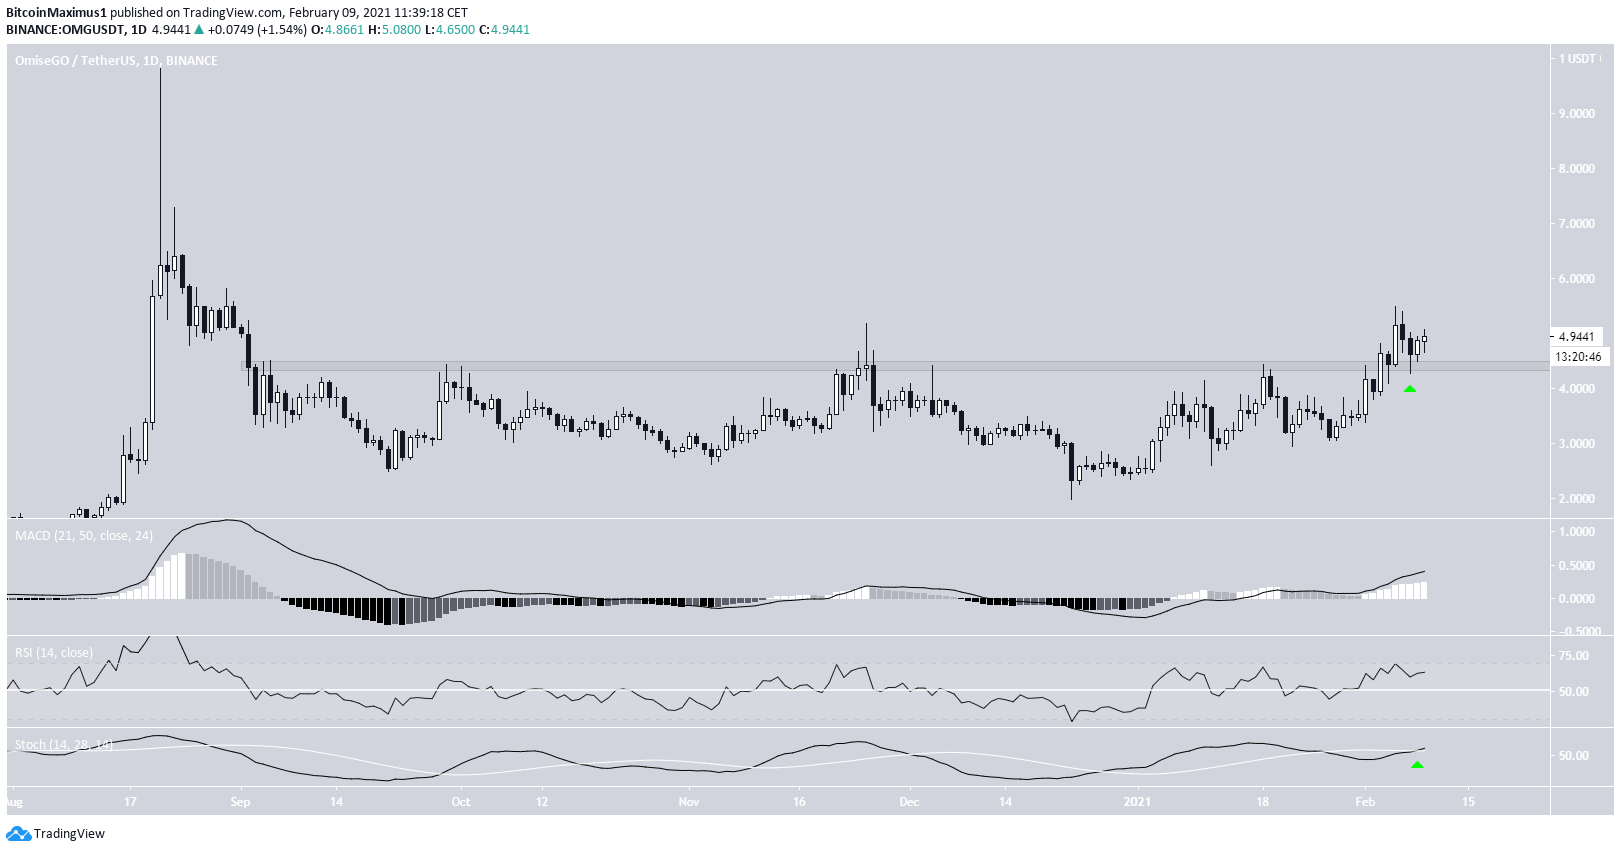
The daily chart also supports the probability of a breakout.
OMG has already reclaimed the minor $4.40 resistance area, which had been in place since September 2020, and validated it as support after (green arrow).
Technical indicators are also bullish, thus indicating that OMG is likely to reach the $6.50 area once more and possibly break out.
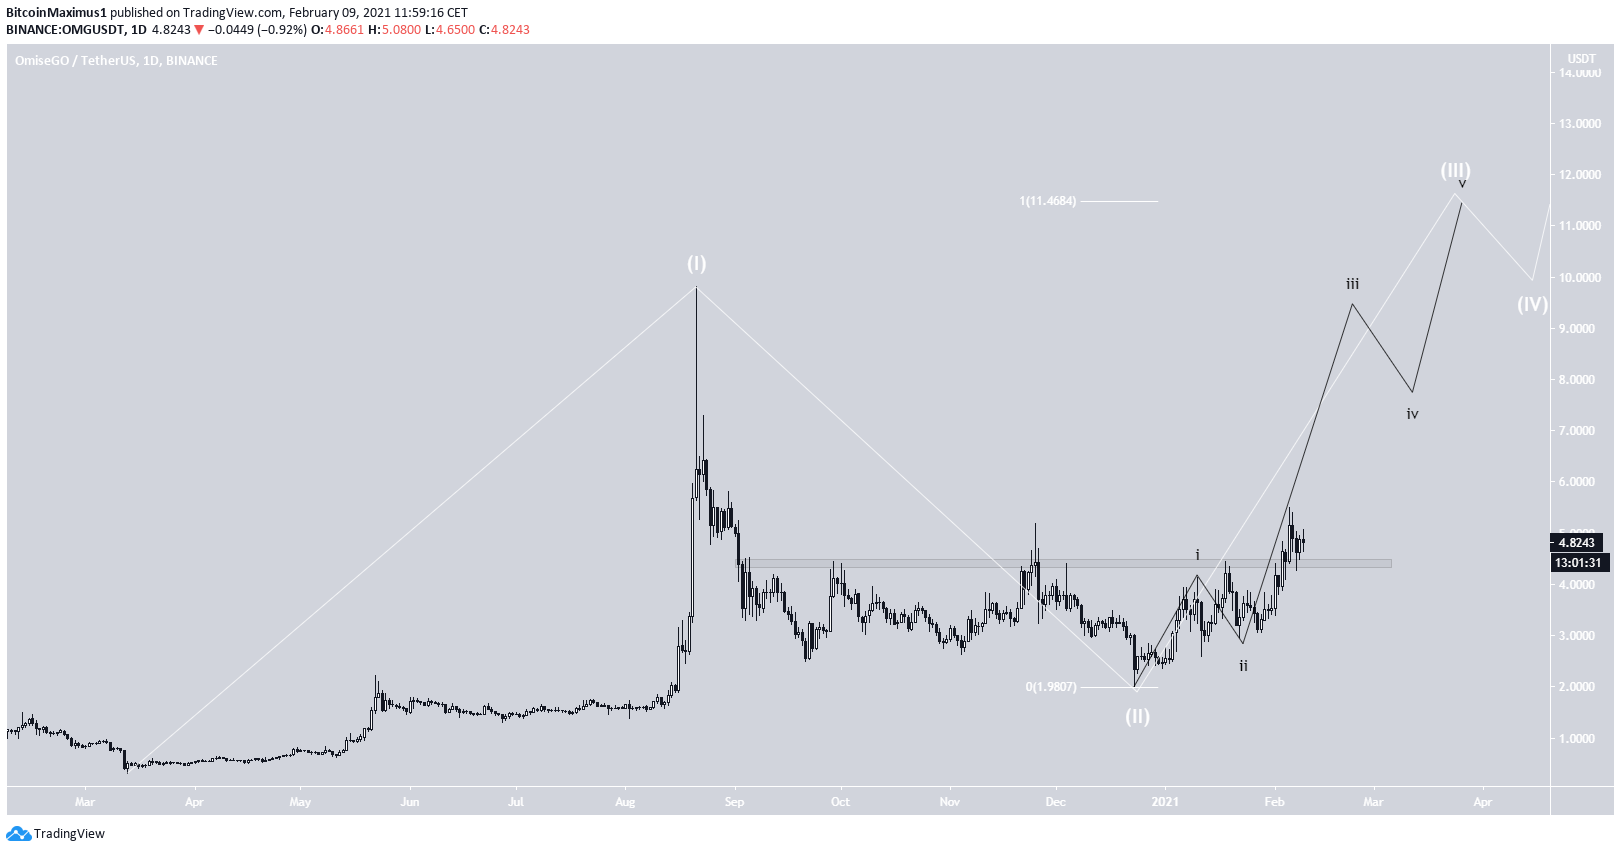
Wave Count
The wave count suggests that OMG is in wave three (white) of a bullish impulse that began with the March 2020 lows.
The minimum target for the top of this move would be found at $11.46, which would give waves one and three a 1:1 ratio and would also coincide with the long-term resistance outlined in the previous section.
The sub-wave count is shown in black, suggesting that OMG is in sub-wave 3.
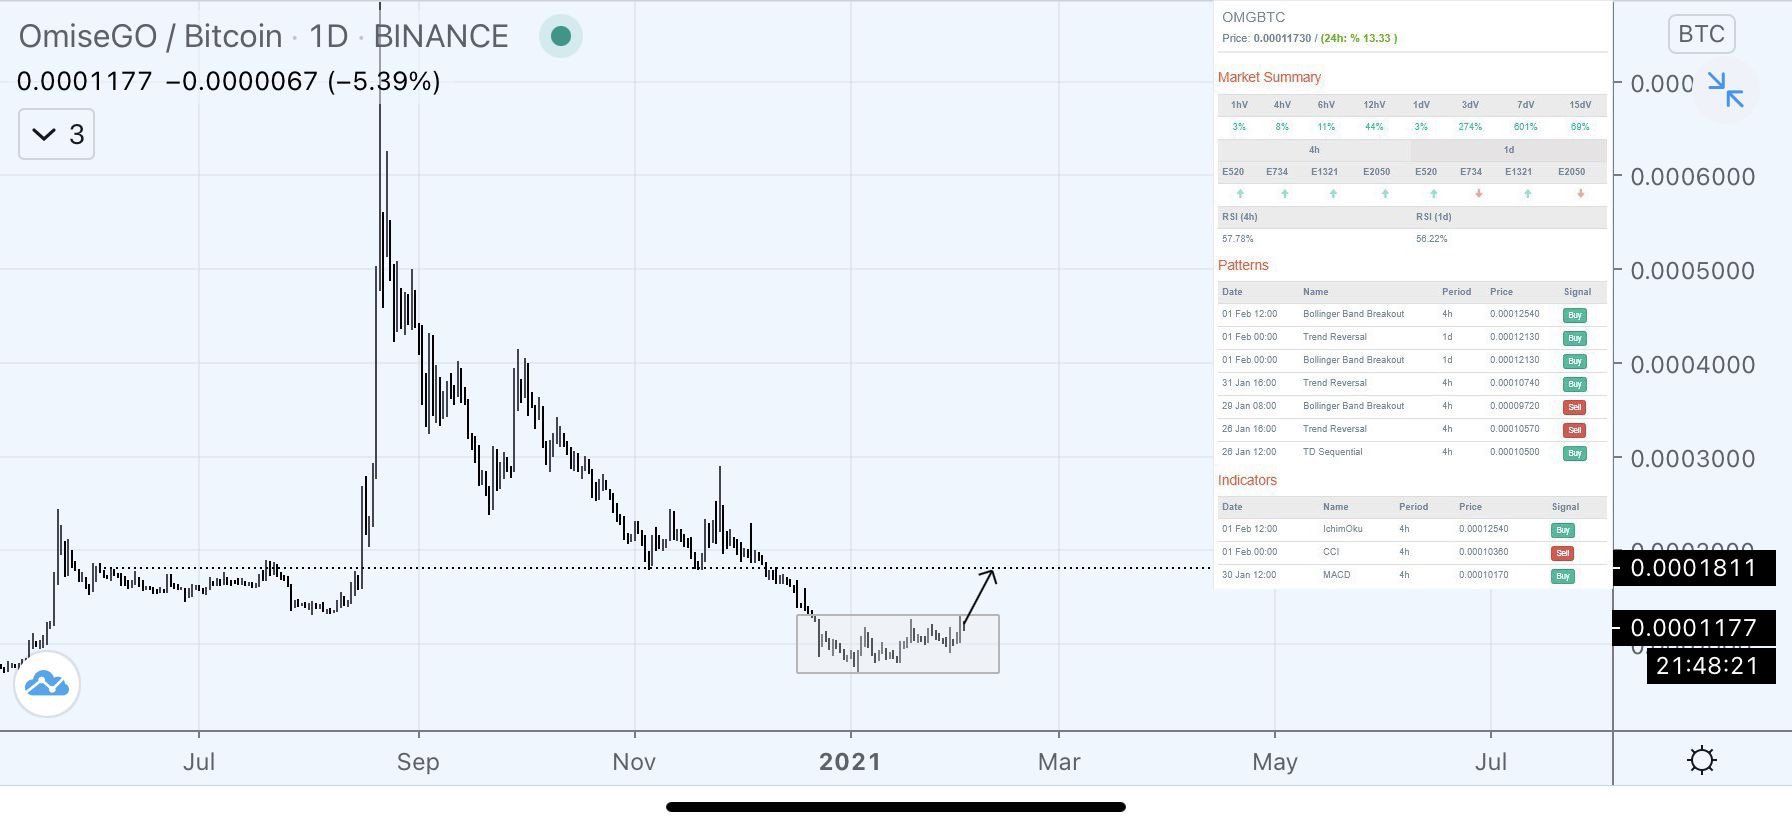
OMG/BTC
Cryptocurrency trader @Coinlegs outlined an OMG/BTC chart, stating that the current accumulation will likely lead to a breakout.
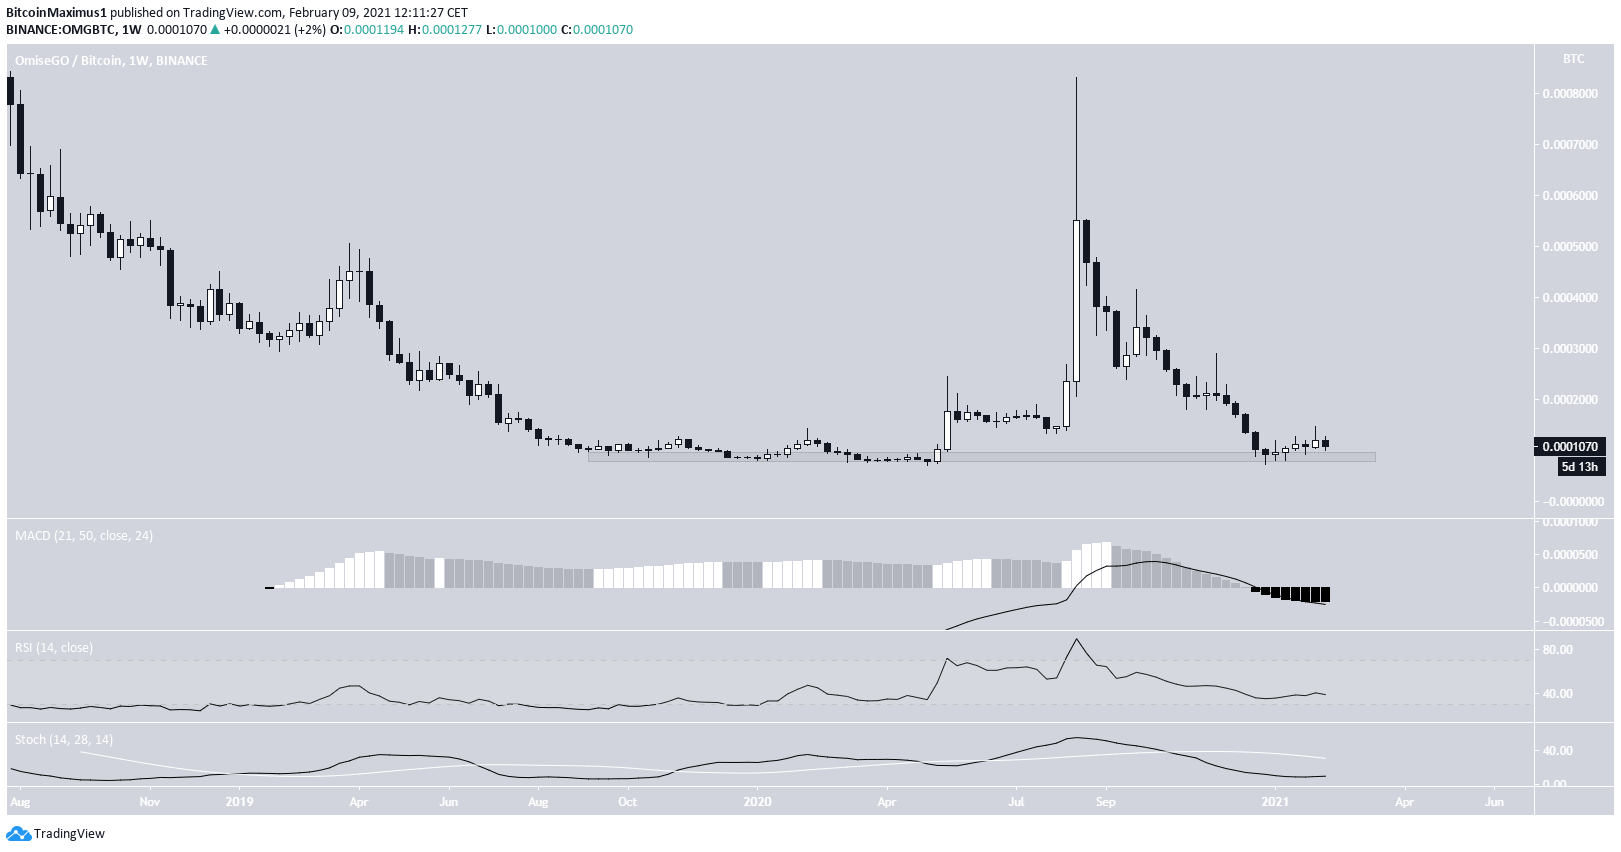
At the beginning of December 2020, OMG reached an all-time low price of 716 satoshis.
However, it managed to bounce at the 800 satoshi support area previously reached near the end of 2019.
Despite being at a significant support level, OMG has not yet shown any bullish reversal signs that would indicate a trend reversal.
Conclusion
OMG/USD is expected to reach the $6.50 resistance area and possibly break out.
Despite being near an all-time low support level, OMG/BTC has yet to show any bullish reversal signs.
For BeInCrypto’s latest Bitcoin (BTC) analysis, click here
Disclaimer
In line with the Trust Project guidelines, this price analysis article is for informational purposes only and should not be considered financial or investment advice. BeInCrypto is committed to accurate, unbiased reporting, but market conditions are subject to change without notice. Always conduct your own research and consult with a professional before making any financial decisions. Please note that our Terms and Conditions, Privacy Policy, and Disclaimers have been updated.
