


Ethereum Classic (ETC) has decreased and validated the previous all-time high resistance level as support.
EOS (EOS) has fallen back below $8.15 horizontal area.
After breaking out in February, Bitcoin Cash (BCH) has returned to the $470 support area.
ETC
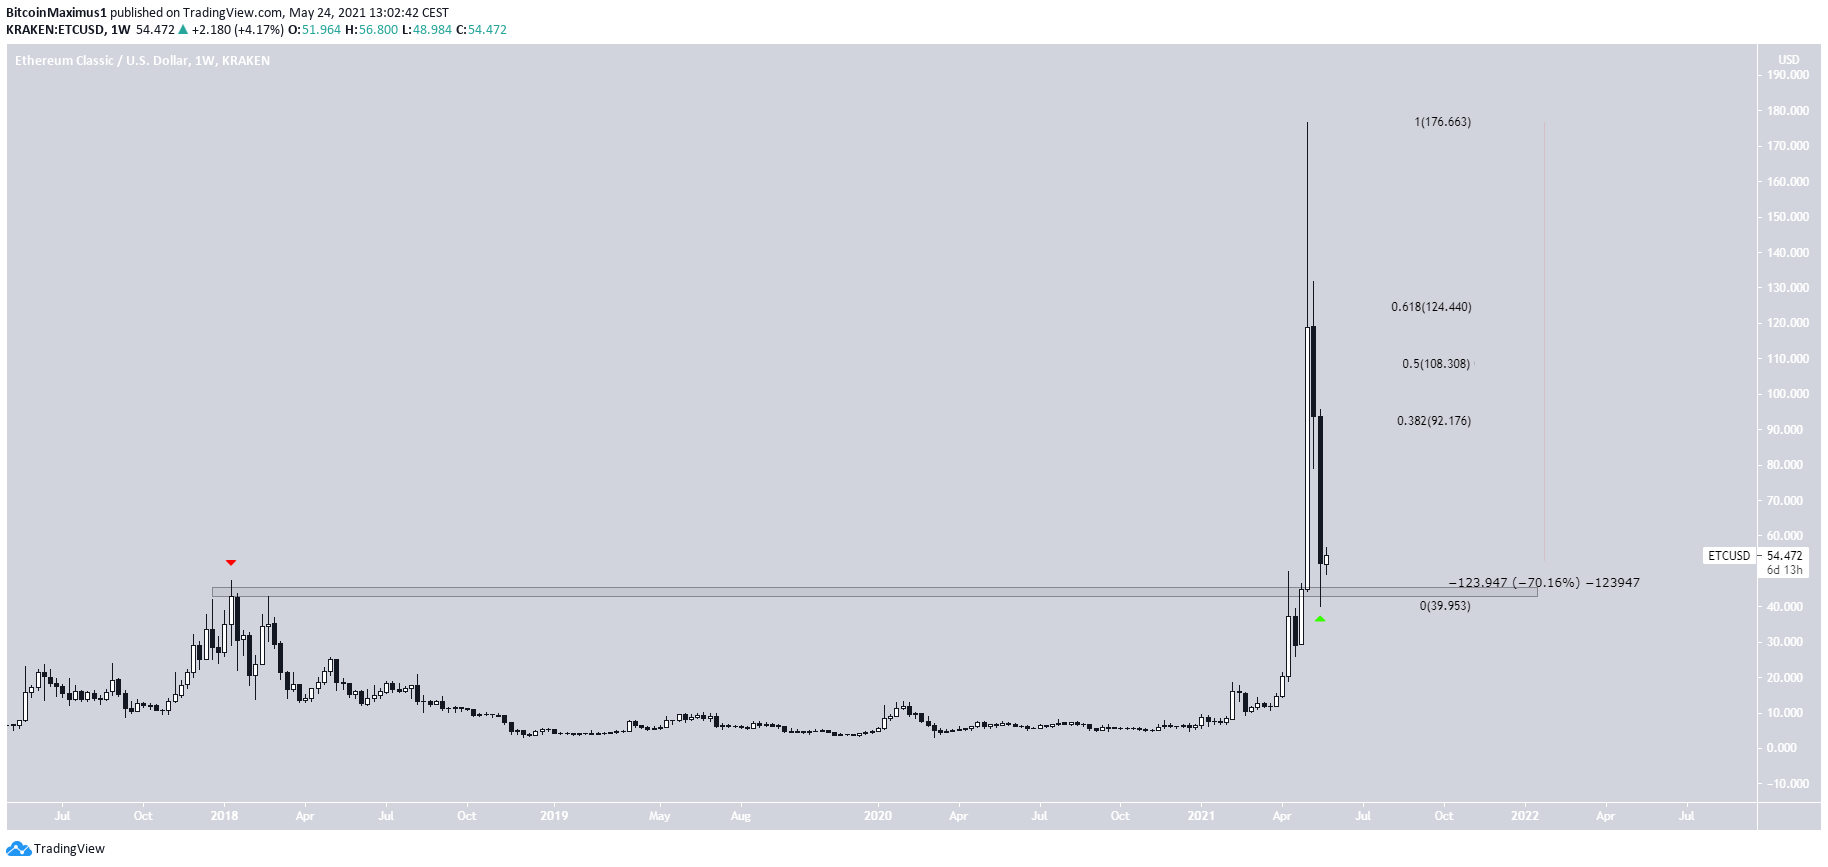
On May 6, ETC reached a new all-time high price of $176.72. However, the higher prices could not be sustained, leaving a very long upper wick in place. In the two weeks since, ETC has fallen by 70%.
However, the drop took it to the previous all-time high resistance level at $46. The token has not re-tested it after initially breaking out.
Therefore, a bounce from this level would be likely. If so, the closest resistance areas are found at:
- $92.2
- $108.3
- $124.4
These are the 0.382, 0.5 and 0.618 Fib retracement resistance levels, respectively.
Highlights
- ETC reached an all-time high on May 7.
- There is support at $44.
EOS
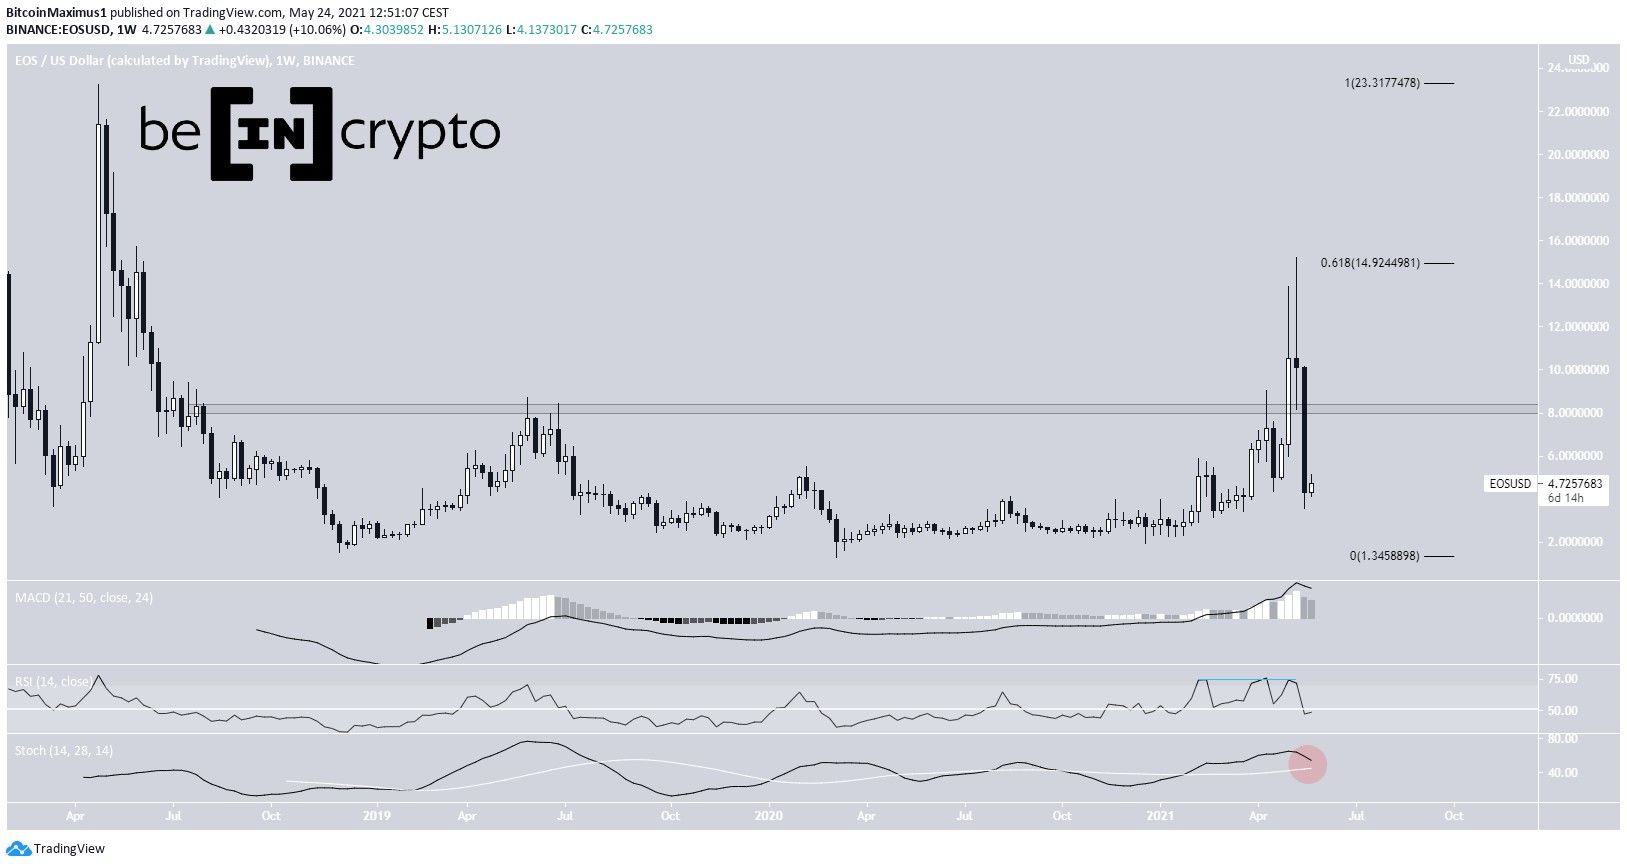
During the first week of May, EOS managed to break out above the $8.15 resistance area. Previously, the level had been acting as resistance since Aug. 2018.
After the breakout, EOS proceeded to reach a high of $15.21. The high was made right at the 0.618 Fib retracement resistance level, when measuring from the previous all-time high.
However, it was rejected, creating a very long upper wick and falling afterwards.
More importantly, EOS is now back below the $8.15 area. In addition, it has reached a weekly close below it. Therefore, the area is now likely to act as resistance once again.
Technical indicators have turned bearish. Prior to the decrease, the RSI generated bearish divergence. The Stochastic oscillator is close to making a bearish cross, while the MACD is already decreasing.
Until the $8.15 area is reclaimed, we cannot consider the trend bullish.
Highlights
- EOS has fallen below the $8.25 resistance area.
- Technical indicators are bearish.
BCH
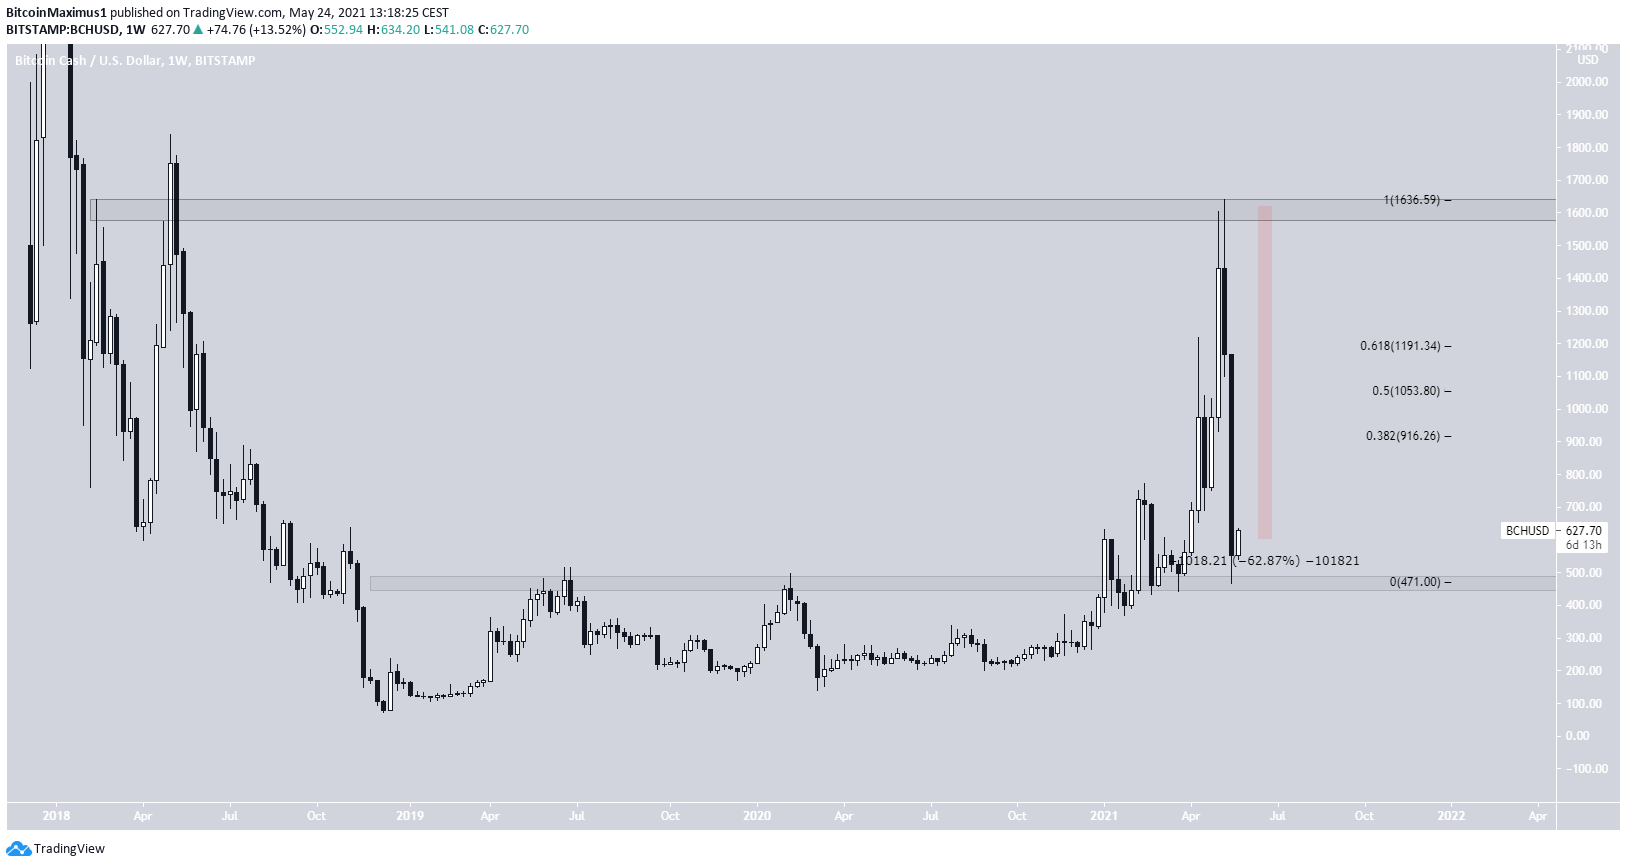
In the beginning of February, BCH broke out above the $470 area, which has been acting as resistance since 2018.
It continued to increase until a high of $1,640 was reached on May 12. However, a sharp drop followed.
So far, BCH has decreased by 62%. The drop took it back to the $470 area, validating it as support once more.
Therefore, some type of bounce is expected.
The closest resistance levels are found at :
- $916.3
- $1,053.8
- $1,191.3
These are the 0.382, 0.5 and 0.618 Fib retracement resistance levels, respectively.
It is likely that the price will consolidate between the $470 area and one of these levels, before deciding on the direction of its next move.
Highlights
- There is long-term support at $470
- There is long-term resistance at $1,600.
For BeInCrypto’s latest bitcoin (BTC) analysis, click here.


