
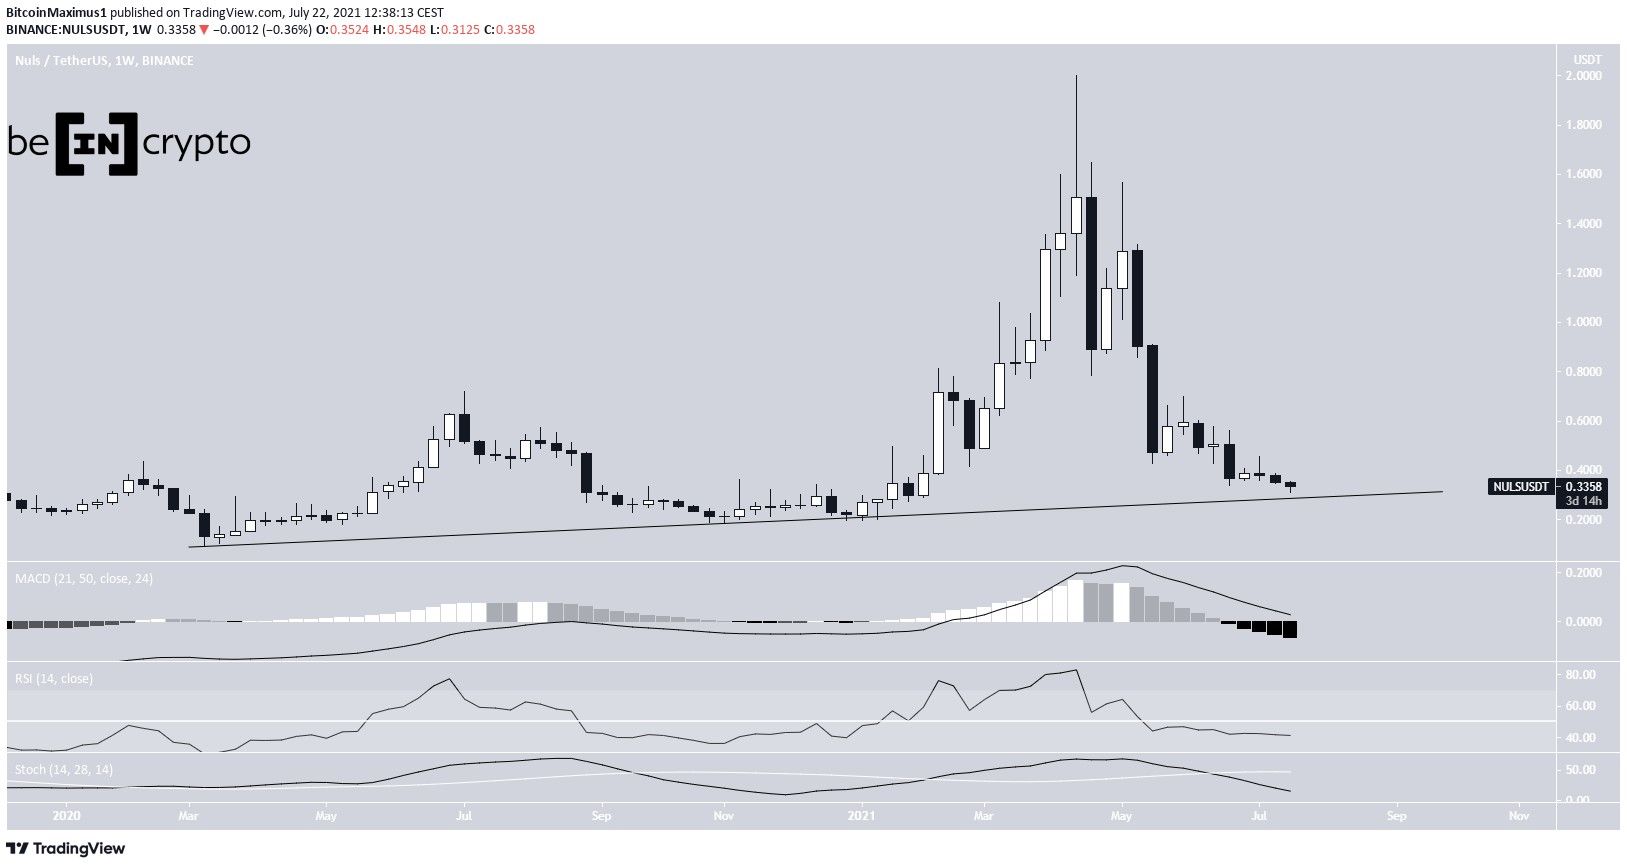
NULS (NULS) has nearly reached a long-term ascending support line that has been in place since March 2020.
There are bullish reversal signs in lower time-frames that indicate an upward move is likely.
NULS long-term support
NULS has been moving downwards since it reached a high of $1.99 on April 18. The downward movement has been sharp, and it reached a low of $0.31 on July 20.
The low was made very close to a long-term ascending support line, which has been in place since March 2020.
Technical indicators in the weekly time-frame are bearish. This is evident by the RSI cross below 50 and the bearish cross in the Stochastic oscillator. Nevertheless, some type of reaction to this support line is likely despite the possibility of the long-term trend being bearish.
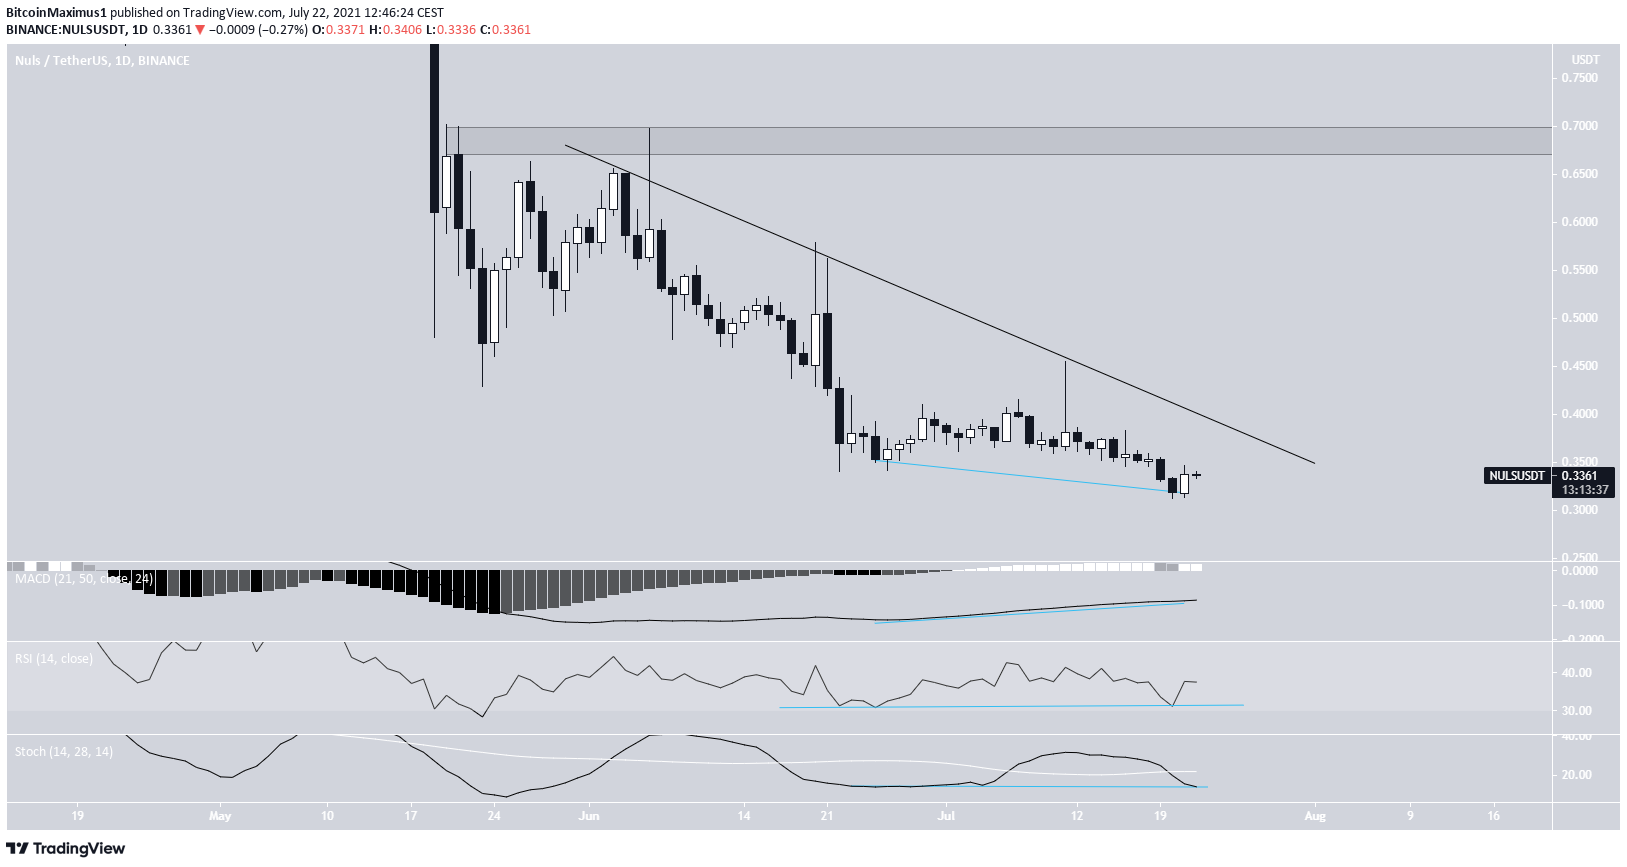
Future movement
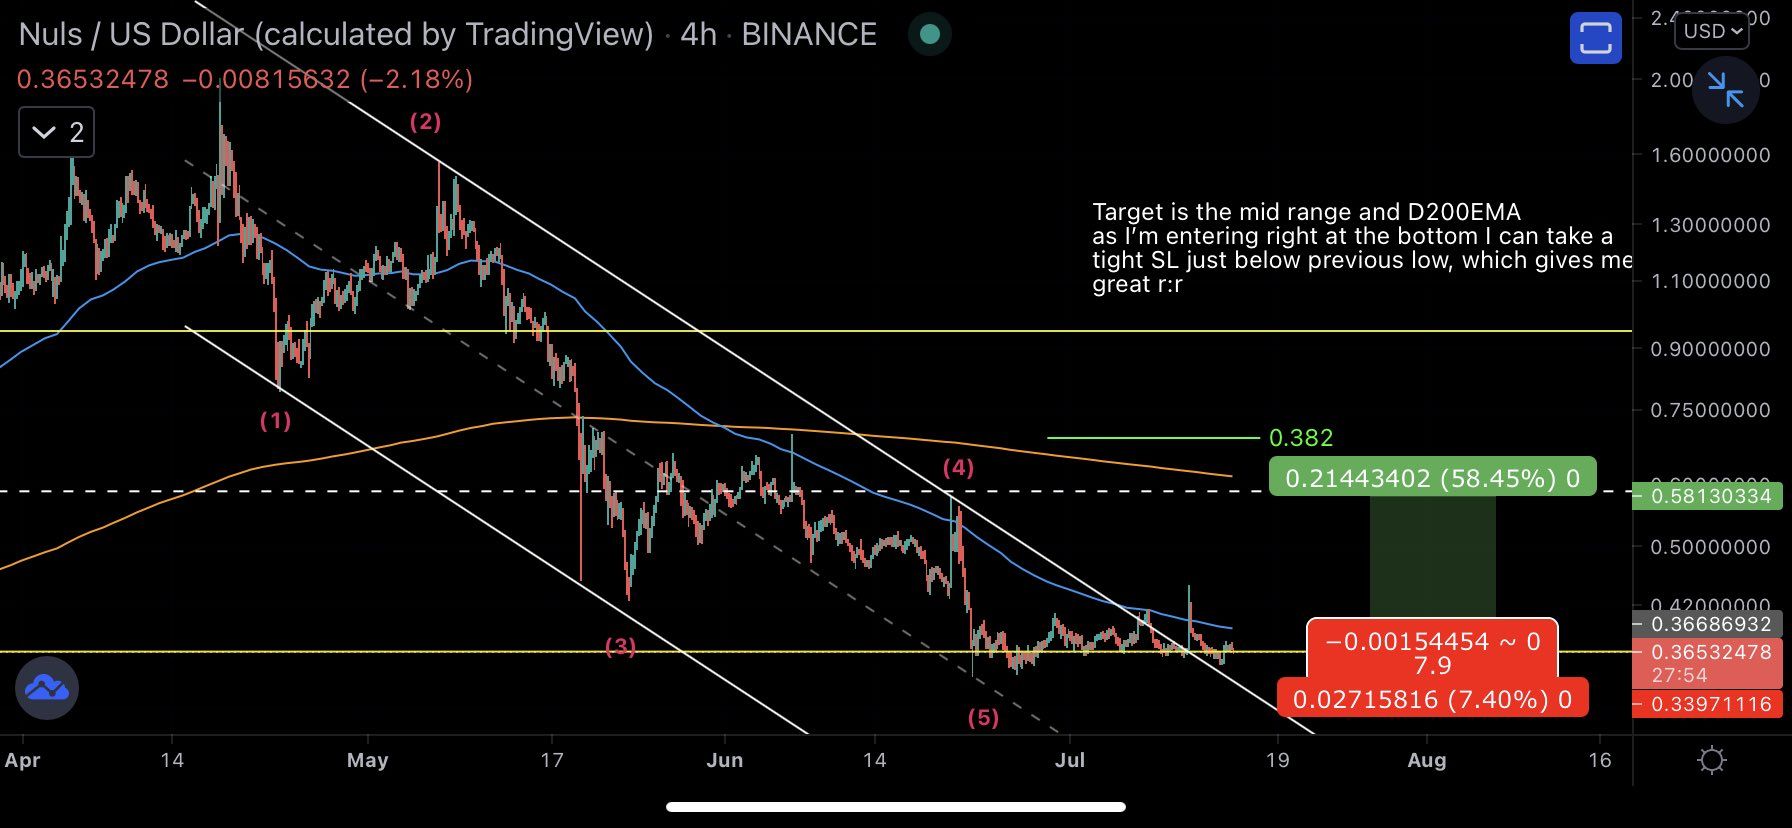
Cryptocurrency trader @Mesawine1 outlined a NULS chart, stating that it could test the mid range at $0.58.
The daily time frame does provide a more bullish outlook than the weekly signals.
While NULS made a lower low on June 23 and July 21, the lows were combined with very significant bullish divergences in the MACD signal line, RSI, and Stochastic oscillator. These are signs of an impending bounce.
NULS is also following a descending resistance line. A breakout above this line could trigger an upward movement towards the closest resistance at $0.68.
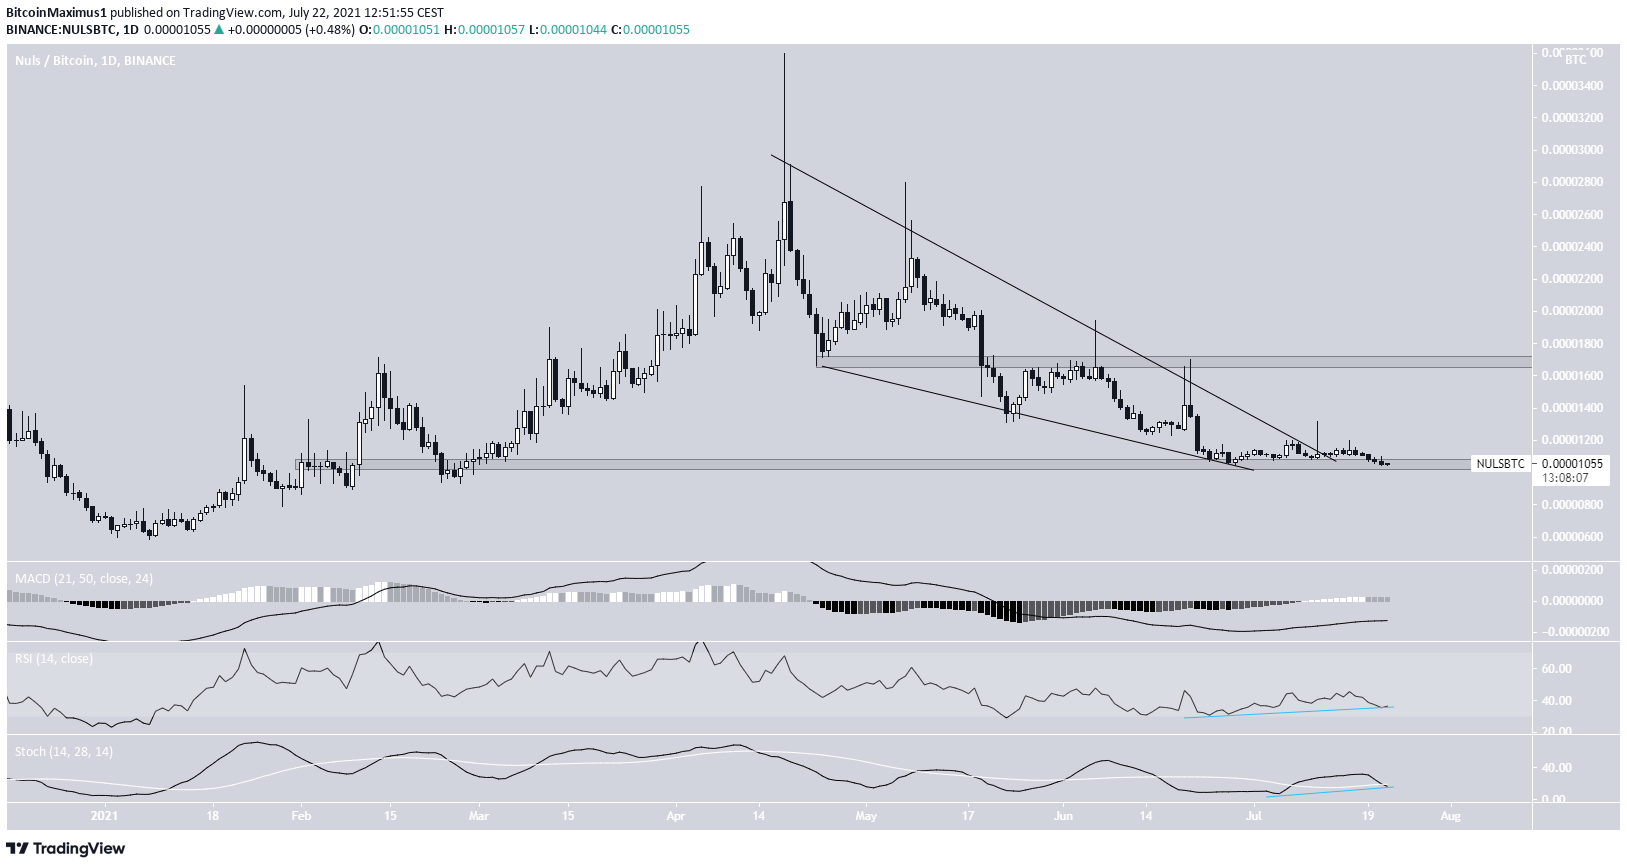
NULS/BTC
The NULS/BTC chart is more bullish than its USD counterpart. It’s broken out from a descending wedge, even though the exact slope of the pattern is difficult to determine because of numerous long lower wicks.
The upward movement was initiated after NULS reached the 1,050 satoshi support area.
Similar to the USD pair, there are multiple bullish divergences in place.
If the breakout continues, the closest resistance would be found at 1,700 satoshis.
For BeInCrypto’s latest bitcoin (BTC) analysis, click here.
